R E S E A R C H
Open Access
A global microRNA screen identifies regulators of
the ErbB receptor signaling network
Annabell Bischoff
1, Michaela Bayerlová
2, Michaela Strotbek
1, Simone Schmid
1, Tim Beissbarth
2and Monilola A Olayioye
1*Abstract
Background:The growth factor heregulin (HRG) potently stimulates epithelial cell survival and proliferation
through the binding of its cognate receptor ErbB3 (also known as HER3). ErbB3-dependent signal transmission relies on the dimerization partner ErbB2, a receptor tyrosine kinase that is frequently overexpressed and/or amplified in breast cancer cells. Substantial evidence suggests that deregulated ErbB3 expression also contributes to the transformed phenotype of breast cancer cells.
Results:By genome-wide screening, we identify 43 microRNAs (miRNAs) that specifically impact HRG-induced activation of the PI3K-Akt pathway. Bioinformatic analysis combined with experimental validation reveals a highly connected molecular miRNA-gene interaction network particularly for the negative screen hits. For selected miRNAs, namely miR-149, miR-148b, miR-326, and miR-520a-3p, we demonstrate the simultaneous downregulation of the ErbB3 receptor and multiple downstream signaling molecules, explaining their efficient dampening of HRG responses and ascribing to these miRNAs potential context-dependent tumor suppressive functions.
Conclusions:Given the contribution of HRG signaling and the PI3K-Akt pathway in particular to tumorigenesis, this study not only provides mechanistic insight into the function of miRNAs but also has implications for future clinical applications.
Keywords:MicroRNA/miRNA, ErbB3/HER3, Heregulin, PI3K-Akt pathway, Breast cancer
Background
ErbB receptors play a well-established role in various types of cancer, including those of the breast. The ErbB recep-tors comprise four members: epidermal growth factor receptor EGFR/ErbB1, ErbB2/HER2, ErbB3/HER3 and ErbB4/HER4. In breast cancer, ErbB2/HER2 is found to be amplified and/or overexpressed in up to 30% of patients, correlating with poor prognosis [1,2]. Although ErbB2/ HER2 function can successfully be blocked with antibodies such as Herceptin/Trastuzumab, a subset of tumors is found to be non-responsive or tumor cells acquire resist-ance during therapy. In this context, ErbB3/HER3 has attracted growing attention because upregulation of signal-ing through this receptor plays an important role in the re-sistance to targeted therapies. This can be explained by the
very efficient coupling of ErbB3 to the phosphatidylinositol 3-kinase (PI3K)/Akt survival pathway [1,2].
Signaling pathways activated by ErbB receptors include the mitogen activated protein kinase (MAPK) and PI3K pathways, which stimulate cellular responses such as survival, proliferation, and migration. Ligand binding to ErbB receptors induces the formation of homo- and het-erodimers and activation of the intrinsic kinase domain, resulting in the phosphorylation of a set of tyrosine resi-dues within their cytoplasmic tails. These phosphory-lated residues serve as docking sites for Src homology 2 and phosphotyrosine-binding domain containing pro-teins, the recruitment of which leads to the activation of specific intracellular signaling pathways [3,4]. The path-ways activated are dependent upon the individual ErbB receptors due to their ability to bind distinct effector proteins. Heregulin (HRG) specifically binds to ErbB3 and ErbB4, inducing heterodimerization mainly with ErbB2. Although ErbB2 has no direct ligand, it readily dimerizes with the other ErbB receptors due to its * Correspondence:[email protected]
1
Institute of Cell Biology and Immunology, University of Stuttgart, Allmandring 31, 70569 Stuttgart, Germany
Full list of author information is available at the end of the article
constitutively active conformation, as revealed by struc-tural analyses [5]. ErbB3 is unique in that it has an im-paired kinase domain lacking catalytic function, but in a heterodimer with a signaling competent ErbB family member, ErbB3 is transphosphorylated, thus serving as a signaling platform. The presence of six binding sites for p85, the regulatory subunit of PI3K, within the ErbB3 cytoplasmic tail explains the strong activation of this pathway by ErbB3-containing heterodimeric ErbB receptor complexes [6]. The production of PIP3 by PI3K recruits Akt to the plasma membrane via its pleckstrin homology domain, where Akt is then activated by phosphorylation on threonine 308 by phosphoinositide-dependent kinase 1 and on serine 473 by mTOR complex 2 or DNA-PK, the latter phosphorylation known to be required for full kinase activity [7].
microRNAs (miRNAs) are 17-nt to 24-nt long non-coding RNAs that regulate gene expression in metazoans [8]. miRNAs act by partial complementary binding to their target mRNAs usually within the 3′-untranslated region (3′UTR), resulting in translational repression and/or mRNA degradation [9]. Microarray and prote-omic experiments have demonstrated the impact of a single miRNA on fine-tuning expression of a hundred of targets [10]. Fundamental biological cellular processes such as development, proliferation, tumorigenesis and apoptosis are now known to be regulated by miRNAs. Furthermore, miRNAs are implicated in various diseases including the development of cancer, making them attract-ive targets for therapeutic intervention or as diagnostic markers [11,12]. In recent years, miRNA profiling studies undertaken in different tumor types have identified sets of miRNAs that have altered expression in tumor versus nor-mal tissue. While certain upregulated miRNAs, so-called oncoMirs, such as miR-155 and the miR17-92 cluster have been characterized to possess transforming potential, there are also examples of miRNAs with inherent tumor sup-pressive activity, such as the let-7 family, that are down-regulated in cancer cells [11,12].
miRNAs that impact ErbB signaling are of special interest due to the major contribution of this pathway to cancer progression. miR-7 was one of first miRNAs identified to simultaneously target EGFR and down-stream signaling molecules including Raf1 [13,14]. Fur-thermore, miR-125a and miR-125b* were shown to co-target ErbB2 and ErbB3, which was accompanied by the suppression of MAPK and PI3K signaling pathways [15]. miR-199a, on the other hand, contributes to enhanced HRG-induced ErbB2-ErbB3 signaling. This miRNA ex-erts its oncogenic effect by reducing the protein level of Necl-2, which is involved in receptor dephosphorylation via PTPN13 [16,17]. Moreover, upregulation of miR-21, which targets the tumor suppressor and lipid phosphat-ase PTEN and therefore promotes sustained ErbB
receptor signaling, was detected in cells with acquired Herceptin resistance [18]. These examples of miRNA-mediated regulation of the ErbB signaling network at different levels illustrate the importance of miRNA regu-lation and emphasizes their potential for prognostic and therapeutic purposes.
Here, we performed a genome-wide miRNA screen in the breast cancer cell line MCF7 based on Akt phos-phorylation as a read-out to investigate the extent by which miRNAs modulate the ErbB receptor signaling pathway. Our data analysis identifies 43 miRNAs that specifically regulate HRG-induced Akt activation, either positively or negatively, and reveals the complexity of coordinated miRNA-target interactions within the ErbB signaling pathway. We further validate four miRNAs with potential tumor suppressive function as novel regu-lators of ErbB3 transcript and protein levels, the expres-sion of which is shown to block HRG-dependent proliferation. Our findings thus give mechanistic insight into miRNA function and have implications for future clinical applications.
Results
Screen establishment: analysis of heregulin-induced signaling by miR-149
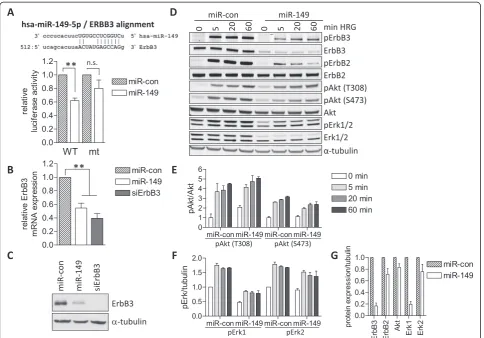
protein levels, respectively, compared with those in miRNA-control transfected cells (Figure 1B,C). As a posi-tive control, an ErbB3-specific siRNA pool was used, which efficiently silenced ErbB3 expression (Figure 1B,C).
Having established ErbB3 as a target of miR-149, we next investigated the impact of miR-149 on HRG-induced phosphorylation kinetics by immunoblotting of the recep-tors and the downstream kinases Erk1/2 and Akt as readouts for PI3K and MAPK pathways, respectively. In agreement with the data shown in Figure 1C, miR-149 ex-pression decreased ErbB3 protein levels, thereby impairing HRG-induced phosphorylation and activation of ErbB3
itself and its dimerization partner ErbB2 (Figure 1D). This potent suppression of ErbB2/3 phosphorylation was ac-companied by reduced Erk1/2 phosphorylation and mod-estly reduced Akt(S473) phosphorylation (Figure 1D-F). In the case of Akt(T308) phosphorylation, the levels in HRG-stimulated control and miR-149 expressing cells were similar, however, in the latter cells the fold induction was reduced due to increased basal Akt(T308) phosphoryl-ation (Figure 1D,E), possibly resulting from the compensa-tory activation of feedback mechanisms. Apart from its effect on ErbB3, miR-149 expression also reduced Erk1 protein levels, whereas only subtle changes in Erk2, Akt
and ErbB2 were observed (Figure 1D,G). Because miRNAs often co-regulate several targets within a specific signaling pathway, it is possible that miR-149 also regulates Erk1 post-transcriptionally; alternatively, miR-149 may affect Erk1 expression indirectly.
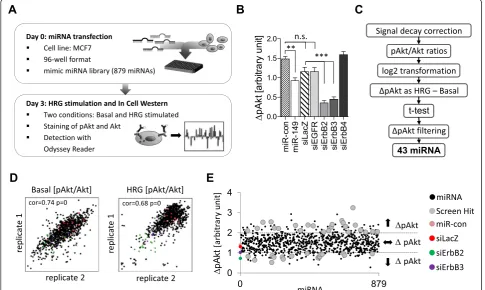
For screening purposes, we transferred the analysis of HRG signaling to a 96-well format using an In-Cell Western protocol (Figure 2A). This method is based on the direct antibody staining of cells, and when combined with IRDye-labeled secondary antibodies and the Odyssey scanning system, it yields quantitative data and enables the simultaneous detection of two signals in a single well. Testing of the different phosphospecific antibodies used in Figure 1D by In-Cell Western revealed that the pAkt (T308)- and pErk-specific antibodies gave rise to spe-cific and sustained signals upon HRG stimulation with kinetics corresponding to those of the Western blot (Additional file 1: Figure S1), whereas the
pAkt(S473)-specific antibody did not yield a pAkt(S473)-specific signal under these conditions (data not shown). Considering the greater dynamic range of the pAkt(T308) signal upon stimulation of cells with different HRG concentrations (Additional file 1: Figure S1), we selected the pAkt (T308) antibody, an intermediate HRG concentration (10 ng/ml) and stimulation of cells for 1 hour for our high-throughput screen. Next, MCF7 cells were trans-fected with a control miRNA, miR-149, a control siRNA (siLacZ) and siRNAs against all members of the ErbB family, stimulated with HRG followed by co-staining with pAkt and Akt antibodies, respectively. In parallel, unstimulated cells were stained to determine basal Akt activity. pAkt/Akt ratios were determined for each sam-ple and the basal values were then subtracted from the HRG-stimulated ones, yieldingΔpAkt (see Methods for details). Compared with the controls, ErbB2 and ErbB3 knockdowns almost completely abolished HRG-induced
Akt activation, whereas ErbB1 and ErbB4 had minimal ef-fects (Figure 2B), confirming that ErbB2/3 is the relevant signal heterodimer in this setting. Compared to the miRNA control, ectopic expression of miR-149 reduced
ΔpAkt by ~40% (Figure 2B), in accordance with the re-duced fold induction observed by Western blot (Figure 1E), demonstrating that miRNA-mediated modulation of ErbB receptor signaling can be quantified using this method.
Genome-wide miRNA screening for regulators of HRG-induced Akt activation
In-Cell Western screening of a miRNA mimic library comprising 879 miRNAs (Additional file 2: Table S1) was performed as detailed in Figure 2A. The screen was repeated to obtain a second independent data set for both the basal and HRG-stimulated condition. Screen data were then normalized by determining pAkt/Akt ratios for all replicate samples (see Additional file 2: Table S2 for raw data). For quality control, the replicates were correlated yielding an average Pearson’s coefficient of 0.74 (basal) and 0.68 (HRG), respectively (Figure 2D). HRG-induced Akt activation was determined and plotted for all miRNAs (ΔpAkt; Figure 2C). The majority of miRNAs had no effect onΔpAkt values and clustered in the range of the negative controls miR-con and siLacZ (Figure 2E; Additional file 1: Figure S2). By contrast,ΔpAkt values for the positive controls miR-149, siErbB2 and siErbB3 were ≤1 (Figure 2E, Additional file 1: Figure S2) and therefore used to define a cut-off: Only those miRNAs were considered as screen hits for whichΔpAkt changes were significant and either below 1 or greater than 2 (Figure 2C,E). 43 miRNAs met these criteria, 19 of which significantly reduced (ΔpAkt < 1) and 24 of which significantly increased HRG-induced Akt activation (ΔpAkt > 2).
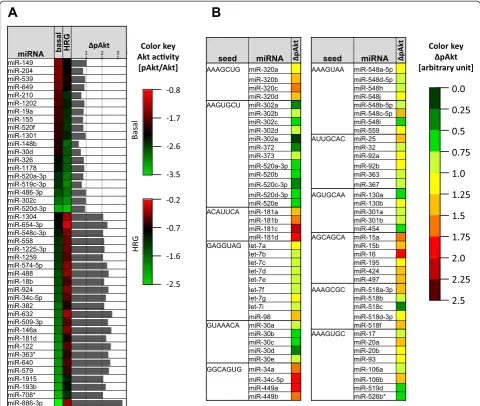
In Figure 3, the ΔpAkt values as well as the basal and HRG-stimulated pAkt/Akt ratios are depicted for the miRNA screen hits. Red coloring indicates an increase, green coloring a decrease of the pAkt/Akt level com-pared to that in miR-con expressing cells. This reveals that those miRNAs that enhance HRG-stimulated pAkt/ Akt levels generally suppress basal pAkt/Akt levels. This is most pronounced for miR-886-3p, for which the greatest difference in HRG-induced Akt activation is observed (ΔpAkt = 3.25). In the case of miR-1304 and miR-654-3p, basal pAkt/Akt levels were unaffected, thus, the increase in ΔpAkt was specifically due to enhanced Akt activity upon HRG stimulation. For those miRNAs that negatively affected ΔpAkt, there was no uniform trend regarding basal pAkt/Akt levels, as some miRNAs such as 204 enhanced, whereas others, e.g. miR-520a-3p, reduced basal pAkt/Akt levels. Regardless of the effect on basal Akt activity, all miRNA hits in this category attenuated Akt activation in response to HRG.
This is best reflected by miR-148b, for which the lowest
ΔpAkt value was obtained, indicating almost complete suppression of HRG-induced Akt activation. Furthermore, a general reduction of pAkt/Akt levels for the basal and HRG-stimulated situation is seen for 520a-3p, miR-519c-3p, miR-485-3p, miR-302c and miR-520d-3p. Not-ably, three of these miRNAs possess the same seed region, which is critical for target recognition. The similarΔpAkt values obtained for the different seed family members underscores the reliability of the screen and suggests that the effects of these miRNAs are mediated by common targets (Figure 3B).
Construction of an ErbB/Akt signaling network with integrated miRNA-target information
For network construction we used data from the Reac-tome database [20] and identified 24 pathways con-nected to ErbB/Akt signaling. These pathways were parsed into R using r-package rBiopaxParser [21] as di-rected graphs. Next, 24 graphs were merged into a single signaling network, comprising 312 nodes representing genes, and 3582 edges representing activation or inhib-ition effects. Because some of the genes are components of protein complexes, to simplify the network, we merged these gene-nodes into protein-complex-nodes. This was done for PIK3 (PIK3CA, PIK3R1), mTORC1 (AKT1S1, MLST8, MTOR) and mTORC2 (RICTOR, MLST8, MTOR), finally yielding 309 nodes and 3542 edges. To acquire miRNA-target information for the 43 screen hit miRNAs, we searched 3 databases with com-putationally predicted miRNA targets: MicroCosm Tar-gets release v5 [22], miRDB v4.0 [23] and microRNA.org August 2010 release [24]. For 3 miRNAs (1304, miR-1259, miR-1915) no targets were found in these databases. The remaining 40 miRNAs were divided into two groups: a first group with negative effects onΔpAkt (19 miRNAs), and a second group with positive effects on ΔpAkt (21
miRNAs). We pooled miRNA – target information from
In agreement with the opposing effects on ΔpAkt, the target genes identified for negatively and positively acting mRNAs differed, showing little overlap.
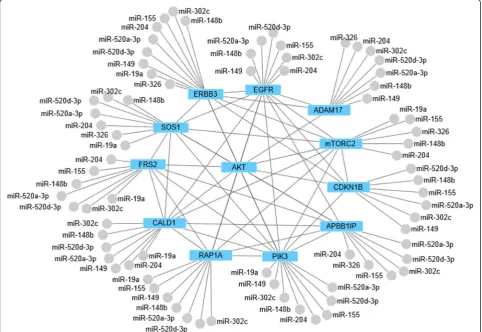
Next, we focused our attention on those miRNAs that reduced Akt activation because their effect can be ex-plained by the direct targeting of key players within the ErbB-Akt pathway. Interestingly, ErbB3 and PIK3 were among the most frequently predicted target genes. To investigate in more detail the potential co-regulation of these genes, we created a miRNA-protein interaction graph that integrated additional information on protein-protein interactions from the STRING database [25] and comprised only directly connected proteins and miRNAs predicted to target ErbB3, namely 520a-3p,
520d-3p, 302c, 19a, 148b, 204, miR-155, miR-149, miR-326 (Figure 4 and Additional file 1: Figure S3). Intriguingly, all nine miRNAs, of which only 520a-3p, 520d-3p and 302c were members of the same seed family, had largely overlapping target spectra. Apart from ErbB3 and PIK3, genes such as RAP1A, a member of the Ras GTPase family, mTOR complex 2, the Ras GDP exchange factor SOS1 and the metalloproteinase Adam17/Tace were predicted as targets. This indicates that this subset of miRNAs negatively regulates HRG-induced Akt activation by targeting the PI3K pathway at multiple levels, thereby multiplying the effects caused by the post-transcriptional suppression of single pathway components.
miR-148b, miR-149, miR-326 and miR-520a reduce ErbB3 expression and dampen HRG-induced MAPK and PI3K signaling
We next sought to validate ErbB3 as a target for select miRNA screen hits: miR-148b gave rise to the strongest reduction ofΔpAkt; miR-520a-3p was chosen as a repre-sentative of the 520/302 seed family; miR-326 was the only miRNA for which no co-regulation of ErbB3 and PIK3 was predicted. To this end, MCF7 cells were
tran-siently transfected with the non-targeting control
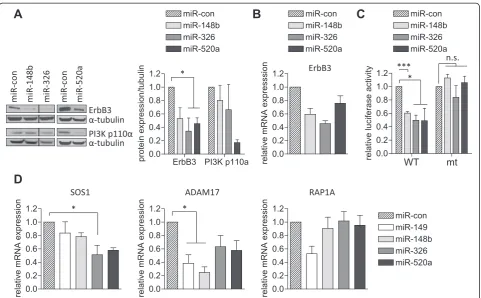
miRNA (miR-con), miR-148b, miR-326 and miR-520a-3p, followed by Western blot analyses of total cell ly-sates. In line with the target prediction, reduced ErbB3 expression was confirmed for miR-148b, miR-326, and miR-520a-3p (Figure 5A). By contrast, downregulation of the catalytic subunit of PIK3 (PI3K p110α) was only evident in cells overexpressing miR-520a-3p (Figure 5A). qRT-PCR analyses further confirmed reduced ErbB3 transcript levels (Figure 5B), suggesting that the ErbB3 mRNA is targeted by 148b, 326, and
miR-520a-3p. To test this directly, luciferase expression vectors with mRNA regions of ErbB3 containing the predicted binding sites of these miRNAs were generated as detailed in the Methods section. Co-transfection of miR-148b, miR-326 or miR-520a-3p with the different luciferase expression vectors suppressed luciferase activ-ities, which was fully restored by deletion of the respective seed regions from the predicted binding sites (Figure 5C, Additional file 1: Figure S7), providing evidence for the direct targeting of the ErbB3 mRNA by 148b, miR-326 and miR-520a-3p.
To explore the extent by which these miRNAs trig-gered degradation of additional targets associated with the ErbB signaling network, we further assessed SOS1, Adam17, and Rap1a mRNA levels by qRT-PCR. These experiments revealed miRNA-induced downregulation of Adam17 and SOS1 transcripts in all cases (Figure 5D), in accordance with the target prediction. However, Rap1a transcript levels were only suppressed by 149 (Figure 5D). It is possible that 148b and
520a-3p regulate Rap1a expression by translational inhibition rather than degradation, however, it should also be noted that in silico prediction algorithms give rise to false positives and therefore any candidates must be experimentally validated as genuine targets. Never-theless, our analysis confirms the simultaneous suppres-sion of a number of ErbB pathway molecules by the miRNA screen hits at the transcript level.
miR-148b, miR-149, miR-326 and miR-520a reduce HRG-induced signaling and viability. We next investi-gated how the selected miRNAs affected ErbB2/3 receptor activation and downstream signaling by immunoblotting of cell lysates derived from HRG-stimulated cells. In agreement with Figure 5A, the expression of miR-148b, miR-326 and miR-520a-3p reduced ErbB3 protein and
phosphorylation levels, which was accompanied by reduced ErbB2, Akt and Erk1/2 phosphorylation (Figure 6A, C-D). In addition, overexpression of miR-148b and miR-520a-3p reduced Erk2 protein levels, whereas miR-326 affected both, Erk1 and Erk2 (Figure 6A,B). Erk1/2 are not predicted targets for these miRNAs based on perfect base pairing of the seed region, however, increasing evidence suggests that nucleotides other than the seed region contribute to effi-cient miRNA targeting. Furthermore, ErbB2 and Erk1 levels were increased by miR-520a-3p expression, possibly result-ing from compensatory mechanisms. Taken together, these experiments confirm that 148b, 326 and miR-520a-3p reduce ErbB3 expression and severely impact HRG-induced ErbB receptor downstream signaling. HRG signaling was also negatively affected by 149 and
520a-3p expression in SKBR3 cells, a breast cancer cell line with ErbB2 amplification. In both cases, miRNA expression suppressed ErbB3 expression and reduced HRG-induced Akt and Erk phosphorylation (Additional file 1: Figure S8A), however, in the case of miR-148b no suppression was ob-served (data not shown). Note that miR-149 expression appears to favor HRG-induced ErbB3 degradation in these cells, demonstrating that the precise signaling response differs in different cell lines. A recent study by the Sorger lab on growth factor signaling in different cell lines supports the view that growth factor responses across different breast cancer cell lines are diverse, even within the same subtype [26]. This diversity was found to arise from the variation in the abundance of the receptors themselves and in the abundance and activity of down-stream signaling molecules.
HRG is known to support the viability of breast cancer cells. To assess the impact of the selected negative miRNA screen hits in a biological assay, we measured the viability of MCF7 cells ectopically expressing miR-148b, miR-149, miR-326 and miR-520a-3p in the presence of HRG. In control cells, viability was increased 2.8 fold in medium containing 0.5% FCS and HRG compared with medium supplemented with 0.5% FCS only (Figure 6E). In the pres-ence of HRG, the viability of cells was reduced by all miR-NAs (Figure 6E). Furthermore and consistent with the inhibition of HRG signaling, miR-149 and miR-520a-3p suppressed the migration of SKBR3 cells in Transwell as-says containing HRG in the bottom chamber (Additional file 1: Figure S8B). These data provide support for the inhibition of HRG-induced biological responses by these miRNAs and their potential tumor suppressive function.
Discussion
The tight control of HRG responses is of fundamental importance for proper cell function as, on the one hand, HRG-induced signaling is essential for the morphogen-esis and differentiation of the mammary gland [27] and, on the other hand, up-regulation of HRG signaling is sufficient to drive malignant transformation and the de-velopment of tumors in the breast [28]. Here, we identi-fied by genome-wide screening miRNAs that modulate HRG-induced Akt activation in MCF7 breast cancer cells. By setting a stringent cut-off requiring effects to be at least as potent as those of miR-149, we identified 43 miRNAs that specifically altered HRG-induced Akt acti-vation, with 24 increasing and 19 decreasing Akt activa-tion. The similar results obtained for individual miRNA seed family members underscore the importance of this region in target selection and prove the robustness of our screen. In addition to miR-149, nine miRNA screen hits that suppressed HRG-induced Akt activation were predicted to target the ErbB signaling network at the level of ErbB3 concomitant with key downstream ef-fector proteins. Three miRNAs, namely 148b, miR-326 and miR-520a-3p as a representative of the miR-520 seed family, were validated to reduce both ErbB3 tran-script and protein levels, indicating that these miRNAs, similarly to miR-149, target ErbB3 directly.
Despite its ligand-independent active conformation, ErbB2-induced transformation of breast cancer cells is dependent on ErbB3 [29,30]. Moreover, due to the po-tent activation of the PI3K survival pathway, ErbB3 plays an important role in the responsiveness of cancer cells to targeted therapies. Breast cancer cells were shown to upregulate ErbB3 via multiple mechanisms to escape pharmacological EGFR inhibition [31], and in lung cancer cells, autocrine activation of ErbB3 caused resistance to the EGFR-specific small molecule inhibitor Gefitinib [32]. miRNA alterations may thus modulate the efficacy of such treatments by impacting ErbB3 expression. In support of this hypothesis, drug-resistant MCF7 cells showed down-regulation of miR-326 and ectopic re-expression sensitized cells to doxorobucin [33]. Additionally, in SKBR3 cells, miR-205, previously shown to target ErbB3, blocked Akt activity and increased the response to the pharmacological ErbB inhibitors Gefitinib and Lapatinib [34].
Because miRNAs tend to have moderate effects on the expression of a single gene, the simultaneous targeting of several genes contained within a functional signaling unit appears to be a common mechanism by which miRNA ef-ficacy is increased. Such multifaceted targeting was also observed by Uhlmann et al., investigating the EGFR-driven cell cycle pathway in MDA-MB-231 breast cancer cells [35]. Specifically, apart from controlling ErbB3 ex-pression, the negatively acting miRNAs analyzed also tar-geted Adam17 (Figures 4 and 5D). This metalloproteinase
plays an important role in the shedding of ErbB ligands, leading to autocrine and paracrine stimulation of cancer cells, a mechanism often activated in drug resistance [36]. It will be interesting to validate in future studies the sup-pression of Adam17 at the protein level and investigate its contribution to cell autonomous signaling in the context of the screen hit miRNAs.
We further provide evidence that miR-149, miR-326, miR-148b and miR-520a-3p block HRG-mediated viability of MCF7 cells and thus possess tumor suppressive proper-ties. In support of this, miR-148b was reported to be downregulated in gastric cancers and aggressive breast tu-mors where it was identified to target multiple genes in-volved in cell signaling, including PIK3CA [37,38]. The latter regulation, however, appears to depend on the cell type, as miR-148b did not affect PIK3CA expression in MCF7 cells, in accordance with our observations. Simi-larly, a recent miRNA screen performed in the ErbB2 amplified cell lines KPL-4 and JIMT-1 identified several miRNAs that directly targeted the human ErbB2 UTR [39], none of which were identified by our screen. Consid-ering that the ectopic expression of miR-125a previously reported to target ErbB2 [15], did not affect ErbB2 levels in MCF7 cells suggests that miRNA regulation of this re-ceptor is also highly cell type specific. This may be associ-ated with the fact that the ErbB2 3′UTR does not contain sites that are well conserved amongst mammals [13].
Bioinformatic analysis of the screen data combined with predicted miRNA targets and experimental valid-ation further revealed connections between parallel pathways. The downregulation of Erk1/2 and SOS1 by miR-149, miR-326 and miR-520a-3p plus the predicted targeting of signaling molecules such as FRS2 and Gab1 uncover extensive miRNA-dependent co-regulation of the PI3K and MAPK pathways. Our screen analysis fur-ther highlights the interdependence of growth factor and integrin signaling. Rap1a is a small GTPase that is pivotal for integrin activation [40]. Data from our lab shows that miR-149 suppresses Rap1a/b in basal breast cancer cells and impairs cell spreading, migration, and invasion in vitro, and lung metastasis formation in vivo [19]. The coordinate suppression of survival, proliferative and migratory path-ways was also seen in the case of miR-148b [37]. Similarly, the miR-520 family was shown to suppress both NFκB and TGFβ signaling in breast cancer cells, providing another example of pathway co-regulation by miRNAs [41].
signaling pathways. Pathway topology information was re-trieved from Reactome, a manually curated and fast grow-ing pathway database, and combined with protein-protein interaction data. For the identification of potential miRNA targets of the screen hits we used three major databases of computationally predicted miRNA targets using different prediction algorithms to ensure finding as many potential targets as possible. The distinct miRNA-gene networks obtained for the positive and negative screen hits confirm the validity of this approach. However, these networks have to be seen within the limitation of the prior know-ledge used for their construction. Nevertheless, target val-idation for the positively acting miRNAs is also of interest as they may regulate the expression of tumor suppressor genes. Intriguingly, PTEN was not identified as a top miRNA-regulated gene by our screen data analysis, al-though this lipid phosphatase is one of the most important negative regulators of the PI3K pathway. There are reports on PTEN targeting by miRNAs, e.g. miR-21, miR-22, and miR-221/2 [42], but protein loss by mutations, promoter methylation, and LOH may be more common mecha-nisms of PTEN inactivation. However, because PTEN downregulation increases both basal and HRG-induced Akt activity, miRNAs acting on PTEN may not have been enriched by our analysis filtering those miRNAs that spe-cifically increased Akt activation in response to HRG stimulation. Instead, the phosphatases INPP4A/B and INPP5B involved in phosphoinositide metabolism, and PHLPP2, which directly desphosphorylates Akt, were enriched in our miRNA target gene list, raising the possi-bility that these phosphatases are potentially more prone to regulation by miRNAs and are particularly involved in determining the amplitude of the HRG response.
In many cases, the miRNAs identified by our screen dif-ferentially affected phospho-Akt levels, depending on whether cells were stimulated or not. In our experimental set-up, cells were given three days to adapt to transfection, during which transcriptional changes and feedback mech-anisms are likely to impact basal Akt phosphorylation. This differs from the acute stimulation with HRG, for which the expression levels and activity states of the direct upstream regulators of Akt are likely to dominate the re-sponse. For example, miR-155 enhanced basal Akt activity, while suppressing HRG-induced Akt activity. miR-155 is an established oncomiR that is upregulated in various can-cers including those of the breast. Inhibition of endogen-ous miR-155 resulted in cell cycle arrest and the induction of apoptosis, whereas ectopic expression promoted sur-vival, proliferation and chemoresistance of breast cancer cells [43]. These results are consistent with a role for miR-155 as a positive regulator of basal PI3K pathway activa-tion. By contrast, miRNAs whose expression reduced basal Akt activity may be important for the control of cell homeostasis and indeed there was a trend toward
reduced cell numbers upon transfection of these miR-NAs (Additional file 1: Figure S6). However, it should be noted that the alteration of a single pathway is not sufficient to classify a given miRNA as oncogenic or tumor suppressive. For example, in MCF7 cells, members of the miR-520/373 family, which potently suppressed phospho-Akt levels associated with the inhibition of cell proliferation, were reported to promote breast cancer metastasis by targeting CD44 [44]. In ER negative breast cancer cells, however, miR-520c inhibited in vitro cell invasion and in vivo intravasation, and its expression in pa-tient samples was inversely correlated to lymph node me-tastasis [41]. Together, these observations highlight the fact that miRNAs act in a context-dependent and stage-specific manner.
Conclusions
Clinical trials have shown the limited efficacy of single-agent Akt pathway inhibitors, presumably due to the ac-tivation of compensatory signaling feedbacks [45]. Given their promiscuous target selection, miRNAs may effi-ciently block such cellular evasion strategies. Furthermore, cancer cells often harbor activating mutations in key path-way molecules, making them resistant to pharmacological inhibition while sensitivity to miRNA regulation should remain. By targeting the Akt pathway at multiple levels, the miRNAs identified in this study may not only be relevant to HRG signaling as Akt is activated downstream of different cancer-promoting RTKs via conserved mecha-nisms, implying broader clinical applications. Increasing the molecular understanding of miRNA function together with the development of improved delivery systems are prerequisites for the translation of miRNAs to the clinic as anti-cancer therapeutics. The identification and functional characterization of miRNAs targeting the ErbB receptor signaling network and the PI3K pathway in particular are first steps in this direction.
Methods
Plasmid constructs
The pGL3-ErbB3 3′UTR firefly luciferase plasmid com-prising the first ~700 nucleotides of the ErbB3 3′UTR was kindly provided by Christopher C. Benz [15]. Within the ErbB3 3′UTR, seed regions of miR-149 (527–533) and miR-520a-3p (514–520 and 664–670), respectively, were deleted by site-directed mutagenesis using the pGL3-ErbB3 3′UTR firefly luciferase plasmid as a template and the following forward primers: ErbB3-del-3′
UTR-527 forward 5′-CATAATTCAGCACTTAACTATGCA
TCATACTAAACTTCACC-3′, ErbB3-3′UTR-del-514
forward 5′-GATATTGATTACTATCATAATTCAACTA
TGAGCCAGGCATC-3′, and ErbB3-3′UTR-del-664
forward 5′-CATGCCTGTAATCTCTGGGAGGCTGA
5286–5470 (accession no. NM_001982) containing the miR-148b and miR-326 binding sites, respectively, were amplified by PCR using genomic DNA from MCF7 cells as a template and the following primer pairs:
ErbB3-4192 forward 5′-TTTTTCTAGACATTATGCCCGCCT
AAAAACTCT-3′, ErbB3-4383 reverse 5′- TTTTCTA
GAGGGAATAGGGAGAAGACGGTA-3′ and
ErbB3-5286 forward 5′- TTTTCTAGATCCTCCCAATTCCT
GTGCAT-3′, ErbB3-5470 reverse 5′-TTTTCTAGAC
CTTCTGACTACCCCCACCA-3′. The PCR products
were cloned into theXbaI site of the pGL3 vector and, in a second step, the miR-148b (5382–5388) and miR-326 (4292–4298) binding sites were deleted by site-directed mutagenesis using pGL3-ErbB3-4192-4383 and pGL3-ErbB3-5286-5470 as templates and the respective forward primers: ErbB3-del-4292 forward 5′- CCCCAA
GGCTAATGAACGTAACTCCTGC-3′, and
ErbB3-del-5382 forward 5′-GGCACTGTTTCTTGTTTTAATCA
AGTCTAACCCC-3′. Primers were synthesized by MWG,
Ebersberg, Germany. Successful cloning and mutagenesis was verified by sequencing (GATC Biotech AG, Konstanz, Germany). The pRL-TK Renilla Luciferase Control Re-porter Plasmid was from Promega (Madison, WI, USA).
Antibodies and reagents
Antibodies used for immunoblotting were: rabbit anti-pErbB2(Y1221/1222) mAb, rabbit anti-pErbB3(Y1289) mAb, rabbit anti-pAkt(T308) mAb, rabbit anti-pAkt (S473) mAb, rabbit anti-pERK1/2(T202/Y204) pAb, mouse anti-ERK1/2 mAb, mouse anti-Akt(pan) mAb, rabbit anti-PI3K p110α mAb (Cell Signaling, Danvers, MA, USA), mouse anti-ErbB2 mAb, mouse anti-ErbB3 mAb (Thermo Scientific, Fremont, MA, USA), and mouse anti-tubulin mAb (Sigma-Aldrich, St Louis, MO, USA). HRP-labeled secondary anti-mouse and anti-rabbit IgG antibodies were from GE Healthcare (Buckinghamshire, UK) and IRDye-680LT anti-rabbit IgG or IRDye-800CW anti-mouse IgG conjugated secondary antibodies were from LI-COR Biosciences (Lincoln, NE, USA). Heregu-linβ1 (HRG) was from Peprotech, Rocky Hill, NJ, USA.
Cell culture and transfection
MCF7 and HEK293T cells were cultured in RPMI 1640 (Life Technologies, Carlsbad, CA, USA), and SKBR3 cells in DMEM (Life Technologies), supplemented with 10% FCS (PAA Laboratories, Cölbe, Germany). Cells were incubated in a humidified atmosphere of 5% CO2
at 37°C. Cells were transfected with siRNAs and miRNAs in a final concentration of 10 nM using RNAiMax (Life Technologies) according to manufacturer’s instructions. miRNA-148b, miR-149-5p, miRNA-326, miR-520a-3p, miRNA mimic negative control #1, EGFR-, ErbB3- and ErbB4-SMARTpools were synthesized by Thermo
Scien-tific, Carlsbad, CA, USA. siLacZ (5′-GCGGCUGCCGG
AAUUUACC-3’) and siErbB2 (5’-GGACGAAUUCUGC
ACAAUG-3’) were synthesized by MWG.
Luciferase assays
4 × 10⁴ HEK293T cells were plated into 96-well plates. The next day, cells were cotransfected with 10 ng wild-type or mutated ErbB3 pGL3 firefly luciferase plasmid, 10 ng pRL Renilla luciferase plasmid, and 50 nM miRNA using Lipofectamine 2000 (Invitrogen). 24 h after trans-fection, cells were lysed with passive lysis buffer (Pro-mega). The activities of the luciferases were measured by sequential substrate addition as described by Dyer et al. [46] and detection at 562 nm with the multimode reader Infinite® 200 PRO (Tecan). Firefly luciferase activities were normalized to those of Renilla luciferase activities in each sample.
Quantitative PCR
Total RNA was isolated from 5 × 10⁵-1 × 10⁶cells using the mirVANA™miRNA Isolation Kit (Life Technologies) according to the manufacturer’s protocol. Primers for ErbB3, RAP1A and GAPDH were QuantiTect Primer Assays from Qiagen, primers for SOS1 (forward: 5’-C
GAGCCCTTTTCACTCAAGC; reverse: 5’-GCCATGGG
GCAGAGTAACTT). were designed using PRIMER3 [47,48] and synthesized by biomers.net GmbH, Ulm, Germany. ErbB3, SOS1, RAP1A and GAPDH mRNA levels were quantified by qRT-PCR using the QuantiTect SYBR Green RT-PCR Kit (Qiagen, Foster City, CA, USA) according to manufacturer’s protocol. qRT-PCR was per-formed with a Cfx96 device (Biorad, Hercules, CA, USA). Changes in the relative expression level were calculated using the 2-ΔΔCt method (Biorad CFX manager software 2.1.). GAPDH was used as the endogenous control gene.
Cell lysis, SDS-PAGE and Western Blotting
Cells were lysed in RIPA buffer [50 mM Tris (pH 7.5), 150 mM NaCl, 1% Triton-X-100, 0.5% sodium deoxycho-late, 0.1% SDS, 1 mM sodium orthovanadate, 10 mM
so-dium fluoride, and 20 mM β-glycerophosphate plus
miRNA library screening
7,5 × 10⁴ cells/well were seeded into 96-well plates and transfected with the miRNA library (Thermo Fischer Scientific, see Additional file 2: Table S1) comprising 879 miRNA mimics. The RNA was transfected in a final concentration of 10 nM using Lipofectamine RNAiMax according to manufacturer’s instructions (Life Technolo-gies) in two biological replicates. 72 h after transfection the cells were either stimulated with 10 ng/ml HRG for 1 h or left untreated, followed by In-Cell Western analysis. The miRNA library was segmented into 11 × 96-well plates, each plate containing 80 miRNA mimics, 2 negative controls (siLacZ and miR-con) and 3 positive controls (siErbB2, siErbB3 and miR-149-5p).
In Cell Western analysis
Cells were fixed with 4% PFA for 20 min, permeabilized with PBS containing 0.1% Triton X-100 for 5 min and washed twice with PBS containing 0,1% Tween 20. Unspecific binding was blocked with 0.5% blocking reagent (Roche) in PBS containing 0.1% Tween-20. Cells were then incubated with primary antibodies, followed by IRDye-conjugated secondary antibodies. Visualization was carried out with the Odyssey device and images were processed with the Odyssey software version 2.1. Finally, plates were stained with crystal violet to monitor cell density. Crystal violet was dissolved in methanol and measured at 550 nm with the multimode reader Infinite® 200 PRO (Tecan).
Screen data analysis
All statistical and bioinformatic analyses were performed using R statistical computing environment (http://www. R-project.org) [49]. First, raw data of each 96-well plate was corrected for the signal decay of pAkt caused by the successive PFA fixation of the individual columns. This was done by comparing the medians of the first and the last column per plate harboring the same set of controls, which theoretically should have identical median values. Assuming a linear signal decay, a correction value for each column was calculated and added to the corre-sponding column. For the corrected values, the ratio of pAkt/Akt was calculated resulting in the value for Akt activity. Next, the ratios were log2-transformed. HRG-induced Akt activation was calculated by subtracting the pAkt/Akt ratio for basal, unstimulated cells from that of HRG-stimulated cells, yielding the increase in Akt acti-vation upon HRG stimulation (ΔpAkt). Two-sided t-test
was applied to compare ΔpAkt of each miRNA in the
screen against negative controls and resulting p-values were adjusted for multiple comparisons using Benjamini & Hochberg correction [50]. miRNAs with adjusted p-value < 0.05 were considered as significant.
Viability assays
One day after transfection, 2.5 × 10³ cells were plated into 96-well plates. The next day, medium was replaced by medium containing 0.5% FCS ± 5 ng/ml HRG. Five days later, cells were fixed with paraformaldehyde and stained with crystal violet. Crystal violet was dissolved in methanol and measured at 550 nm with the multimode reader Infinite® 200 PRO (Tecan).
Migration assays
Three days after transfection, SKBR3 cells (1 × 10⁵) were seeded in medium containing 0.5% FCS into Transwells (8 μm pore size; Sigma Aldrich, St. Louis, MI, USA) coated with 10μg/ml collagen (Serva, Germany) on the underside and allowed to migrate overnight. The bottom chamber contained medium with 0.5% FCS supple-mented with 25 ng/ml HRG. Cells on the underside of the membranes were fixed, stained with crystal violet, and counted in five independent microscopic fields. Experiments were performed with duplicate filters.
Availability of supporting data
The data sets supporting the results of this article are included within the article and its additional files.
Additional files
Additional file 1: Figure S1.In-Cell-Western establishment. MCF-7 cells were stimulated with different HRG concentrations for different times and analyzed by In-Cell-Western using antibodies specific for (A) Akt(pT308) and Akt, and (B) pErk1/2 and total Erk1/2. Signals were background subtracted and normalized to the unstimulated control.Figure S2.Distribution of
ΔpAkt values for all positive and negative controls.ΔAkt values <1 indicate a reduction, values >2 an increase in Akt activation upon HRG stimulation. Data analysis: one way Anova followed by Bonferroni’s multiple comparison test (***p< 0.001, **p< 0.01).Figure S3.miRNAs and their targets (see Figure 4). The most frequently targeted genes for miRNAs that significantly reduced Akt activity are shown.Figure S4.Regulatory miRNA/target network for negatively acting miRNAs. miRNAs (blue); genes (grey circles); miRNA-target interactions (black lines); positive regulatory effects (green lines). The network includes 19 miRNAs and 14 genes targeted by at least 9 miRNAs. Akt1 and Akt2 were included manually.Figure S5.Regulatory miRNA/target network for positively acting miRNAs. miRNAs (blue); genes (grey circles); miRNA-target interactions (black lines); positive regulatory effects (green lines). The network includes 21 miRNAs and 17 genes targeted by at least 6 miRNAs. Akt1 and Akt2 were included manually.Figure S6. Correlation of miRNA expression with cell density. pAkt/Akt ratios and crystal violet values were correlated for the unstimulated (basal) condition.Figure S7.Predicted binding sites of miR-148b, miR-326 and miR-520a in the ErbB3 mRNA.Figure S8.miRNA inhibition of HRG signaling in SKBR3 cells. Cells were transfected with the indicated miRNAs. (A) Lysates from untreated (0 min) and HRG-stimulated cells were analyzed by immunoblotting with the indicated antibodies Cropped panels are from the same blot. (B) Transwell assays with HRG as a chemotactic stimulus. The mean ± SEM of two (miR-149) or three (miR-520a-3p) independent experiments is shown.
Additional file 2: Table S1.Sequences contained in the human mimic library.Table S2.Raw data for basal and HRG-stimulated cells.Table S3. Lists of computationally predicted miRNA targets.
Competing interests
Authors’contributions
AB established and performed the miRNA screen, analyzed and validated the data. MB performed the bioinformatic analysis of the screen data. MS performed qRT-PCR and luciferase experiments, and supported the revision of the manuscript. SS helped with the cloning and signaling experiments. TB supervised the screen data analysis. MAO conceived the study, analyzed the data and wrote the manuscript with the support of AB, MS, MB and TB. All authors read and approved the final manuscript.
Acknowledgments
We thank Melanie Boerries and Hauke Busch for fruitful discussions and critically reading the manuscript. This work was supported by DFG 571692 and DKH 110701 grants to MAO. MAO is funded by the DFG Heisenberg program.
Author details
1Institute of Cell Biology and Immunology, University of Stuttgart,
Allmandring 31, 70569 Stuttgart, Germany.2Department of Medical Statistics, University Medical Center Göttingen, 37099 Göttingen, Germany.
Received: 12 June 2014 Accepted: 12 January 2015
References
1. Hynes NE, MacDonald G. ErbB receptors and signaling pathways in cancer. Curr Opin Cell Biol. 2009;21(2):177–84.
2. Baselga J, Swain SM. Novel anticancer targets: revisiting ERBB2 and discovering ERBB3. Nat Rev Cancer. 2009;9(7):463–75.
3. Yarden Y, Sliwkowski MX. Untangling the ErbB signalling network. Nat Rev Mol Cell Biol. 2001;2(2):127–37.
4. Olayioye MA, Neve RM, Lane HA, Hynes NE. The ErbB signaling network: receptor heterodimerization in development and cancer. EMBO J. 2000;19(13):3159–67.
5. Garrett TP, McKern NM, Lou M, Elleman TC, Adams TE, Lovrecz GO, et al. The crystal structure of a truncated ErbB2 ectodomain reveals an active conformation, poised to interact with other ErbB receptors. Mol Cell. 2003;11(2):495–505.
6. Amin DN, Campbell MR, Moasser MM. The role of HER3, the unpretentious member of the HER family, in cancer biology and cancer therapeutics. Semin Cell Dev Biol. 2010;21(9):944–50.
7. Fayard E, Xue G, Parcellier A, Bozulic L, Hemmings BA. Protein kinase B (PKB/Akt), a key mediator of the PI3K signaling pathway. Curr Top Microbiol Immunol. 2010;346:31–56.
8. Ambros V. The functions of animal microRNAs. Nature. 2004;431(7006):350–5. 9. Bartel DP. MicroRNAs: target recognition and regulatory functions. Cell.
2009;136(2):215–33.
10. Selbach M, Schwanhausser B, Thierfelder N, Fang Z, Khanin R, Rajewsky N. Widespread changes in protein synthesis induced by microRNAs. Nature. 2008;455(7209):58–63.
11. Iorio MV, Croce CM. MicroRNA dysregulation in cancer: diagnostics, monitoring and therapeutics. A comprehensive review. EMBO Mol Med. 2012;4(3):143–59.
12. Farazi TA, Hoell JI, Morozov P, Tuschl T. MicroRNAs in human cancer. Adv Exp Med Biol. 2013;774:1–20.
13. Barker A, Giles KM, Epis MR, Zhang PM, Kalinowski F, Leedman PJ. Regulation of ErbB receptor signalling in cancer cells by microRNA. Curr Opin Pharmacol. 2010;10(6):655–61.
14. Webster RJ, Giles KM, Price KJ, Zhang PM, Mattick JS, Leedman PJ. Regulation of epidermal growth factor receptor signaling in human cancer cells by microRNA-7. J Biol Chem. 2009;284(9):5731–41.
15. Scott GK, Goga A, Bhaumik D, Berger CE, Sullivan CS, Benz CC. Coordinate suppression of ERBB2 and ERBB3 by enforced expression of micro-RNA miR-125a or miR-125b. J Biol Chem. 2007;282(2):1479–86.
16. Kawano S, Ikeda W, Kishimoto M, Ogita H, Takai Y. Silencing of ErbB3/ErbB2 signaling by immunoglobulin-like Necl-2. J Biol Chem.
2009;284(35):23793–805.
17. Minami A, Shimono Y, Mizutani K, Nobutani K, Momose K, Azuma T, et al. Reduction of the ST6 beta-galactosamide alpha-2,6-sialyltransferase 1 (ST6GAL1)-catalyzed sialylation of nectin-like molecule 2/cell adhesion molecule 1 and enhancement of ErbB2/ErbB3 signaling by microRNA-199a. J Biol Chem. 2013;288(17):11845–53.
18. Gong C, Yao Y, Wang Y, Liu B, Wu W, Chen J, et al. Up-regulation of miR-21 mediates resistance to trastuzumab therapy for breast cancer. J Biol Chem. 2011;286(21):19127–37.
19. Bischoff A, Huck B, Keller B, Strotbek M, Schmid S, Boerries M, et al. miR149 functions as a tumor suppressor by controlling breast epithelial cell migration and invasion. Cancer Res. 2014;74(18):5256–65.
20. Croft D, O’Kelly G, Wu G, Haw R, Gillespie M, Matthews L, et al. Reactome: a database of reactions, pathways and biological processes. Nucleic Acids Res. 2011;39(Database issue):D691–7.
21. Kramer F, Bayerlova M, Klemm F, Bleckmann A, Beissbarth T. rBiopaxParser–an R package to parse, modify and visualize BioPAX data. Bioinformatics. 2013;29(4):520–2.
22. Griffiths-Jones S, Saini HK, van Dongen S, Enright AJ. miRBase: tools for microRNA genomics. Nucleic Acids Res. 2008;36(Database issue):D154–8. 23. Wang X. miRDB: a microRNA target prediction and functional annotation
database with a wiki interface. RNA. 2008;14(6):1012–7.
24. Betel D, Wilson M, Gabow A, Marks DS, Sander C. The microRNA.org resource: targets and expression. Nucleic Acids Res. 2008;36(Database issue):D149–53. 25. Franceschini A, Szklarczyk D, Frankild S, Kuhn M, Simonovic M, Roth A, et al.
STRING v9.1: protein-protein interaction networks, with increased coverage and integration. Nucleic Acids Res. 2013;41(Database issue):D808–15. 26. Niepel M, Hafner M, Pace EA, Chung M, Chai DH, Zhou L, et al. Analysis of
growth factor signaling in genetically diverse breast cancer lines. BMC Biol. 2014;12:20.
27. Breuleux M. Role of heregulin in human cancer. Cell Mol Life Sci. 2007;64(18):2358–77.
28. Atlas E, Cardillo M, Mehmi I, Zahedkargaran H, Tang C, Lupu R. Heregulin is sufficient for the promotion of tumorigenicity and metastasis of breast cancer cells in vivo. Mol Cancer Res. 2003;1(3):165–75.
29. Lee-Hoeflich ST, Crocker L, Yao E, Pham T, Munroe X, Hoeflich KP, et al. A central role for HER3 in HER2-amplified breast cancer: implications for targeted therapy. Cancer Res. 2008;68(14):5878–87.
30. Holbro T, Beerli RR, Maurer F, Koziczak M, Barbas 3rd CF, Hynes NE. The ErbB2/ErbB3 heterodimer functions as an oncogenic unit: ErbB2 requires ErbB3 to drive breast tumor cell proliferation. Proc Natl Acad Sci U S A. 2003;100(15):8933–8.
31. Sergina NV, Rausch M, Wang D, Blair J, Hann B, Shokat KM, et al. Escape from HER-family tyrosine kinase inhibitor therapy by the kinase-inactive HER3. Nature. 2007;445(7126):437–41.
32. Zhou BB, Peyton M, He B, Liu C, Girard L, Caudler E, et al. Targeting ADAM-mediated ligand cleavage to inhibit HER3 and EGFR pathways in non-small cell lung cancer. Cancer Cell. 2006;10(1):39–50.
33. Liang Z, Wu H, Xia J, Li Y, Zhang Y, Huang K, et al. Involvement of miR-326 in chemotherapy resistance of breast cancer through modulating expression of multidrug resistance-associated protein 1. Biochem Pharmacol. 2010;79(6):817–24.
34. Iorio MV, Casalini P, Piovan C, Di Leva G, Merlo A, Triulzi T, et al. microRNA-205 regulates HER3 in human breast cancer. Cancer Res. 2009;69(6):2195–200. 35. Uhlmann S, Mannsperger H, Zhang JD, Horvat EA, Schmidt C, Kublbeck M,
et al. Global microRNA level regulation of EGFR-driven cell-cycle protein net-work in breast cancer. Mol Syst Biol. 2012;8:570.
36. Duffy MJ, McKiernan E, O’Donovan N, McGowan PM. Role of ADAMs in cancer formation and progression. Clin Cancer Res. 2009;15(4):1140–4. 37. Cimino D, De Pitta C, Orso F, Zampini M, Casara S, Penna E, et al. miR148b
is a major coordinator of breast cancer progression in a relapse-associated microRNA signature by targeting ITGA5, ROCK1, PIK3CA, NRAS, and CSF1. FASEB J. 2013;27(3):1223–35.
38. Song YX, Yue ZY, Wang ZN, Xu YY, Luo Y, Xu HM, et al. MicroRNA-148b is frequently down-regulated in gastric cancer and acts as a tumor suppressor by inhibiting cell proliferation. Mol Cancer. 2011;10:1.
39. Leivonen SK, Sahlberg KK, Makela R, Due EU, Kallioniemi O, Borresen-Dale AL, et al. High-throughput screens identify microRNAs essential for HER2 positive breast cancer cell growth. Mol Oncol. 2014;8(1):93–104. 40. Frische EW, Zwartkruis FJ. Rap1, a mercenary among the Ras-like GTPases.
Dev Biol. 2010;340(1):1–9.
41. Keklikoglou I, Koerner C, Schmidt C, Zhang JD, Heckmann D, Shavinskaya A, et al. MicroRNA-520/373 family functions as a tumor suppressor in estrogen receptor negative breast cancer by targeting NF-kappaB and TGF-beta signaling pathways. Oncogene. 2012;31(37):4150–63.
43. Mattiske S, Suetani RJ, Neilsen PM, Callen DF. The oncogenic role of miR-155 in breast cancer. Cancer Epidemiol Biomarkers Prev. 2012;21(8):1236–43. 44. Huang Q, Gumireddy K, Schrier M, le Sage C, Nagel R, Nair S, et al. The
microRNAs miR-373 and miR-520c promote tumour invasion and metastasis. Nat Cell Biol. 2008;10(2):202–10.
45. Engelman JA. Targeting PI3K signalling in cancer: opportunities, challenges and limitations. Nat Rev Cancer. 2009;9(8):550–62.
46. Dyer BW, Ferrer FA, Klinedinst DK, Rodriguez R. A noncommercial dual luciferase enzyme assay system for reporter gene analysis. Anal Biochem. 2000;282(1):158–61.
47. Koressaar T, Remm M. Enhancements and modifications of primer design program Primer3. Bioinformatics. 2007;23(10):1289–91.
48. Untergasser A, Cutcutache I, Koressaar T, Ye J, Faircloth BC, Remm M, et al. Primer3–new capabilities and interfaces. Nucleic Acids Res. 2012;40(15):e115. 49. Team RC. R: A language and environment for statistical computing. Vienna,
Austria: R Foundation for Statistical Computing; 2012. 3-900051-07-0. 50. Benjamini Y, Hochberg Y. Controlling the false discovery rate - a practical
and powerful approach to multiple testing. J Roy Stat Soc B Met. 1995;57 (1):289–300.
Submit your next manuscript to BioMed Central and take full advantage of:
• Convenient online submission
• Thorough peer review
• No space constraints or color figure charges
• Immediate publication on acceptance
• Inclusion in PubMed, CAS, Scopus and Google Scholar
• Research which is freely available for redistribution