RESEARCH
Linking genotype and phenotype
in an economically viable propionic acid
biosynthesis process
Carlos H. Luna‑Flores
1, Chris C. Stowers
3, Brad M. Cox
3, Lars K. Nielsen
1,2and Esteban Marcellin
1,2*Abstract
Background: Propionic acid (PA) is used as a food preservative and increasingly, as a precursor for the synthesis of monomers. PA is produced mainly through hydrocarboxylation of ethylene, also known as the ‘oxo‑process’; however, Propionibacterium species are promising biological PA producers natively producing PA as their main fermentation product. However, for fermentation to be competitive, a PA yield of at least 0.6 g/g is required.
Results: A new strain able to reach the required yield was obtained using genome shuffling. To gain insight into the changes leading to the improved phenotype, the genome of the new strain was sequenced, and metabolomics and transcriptomics data were obtained. In combination, the data revealed three key mutations: (i) a mutation in the pro‑ moter region of a sugar transporter which enables an increase in the uptake rate of sucrose; (ii) a mutation in a polar amino acid transporter which improves consumption of amino acids and acid tolerance; and (iii) a mutation in a gene annotated as a cytochrome C biogenesis gene, which is likely responsible for the coupling of the Wood–Werkman cycle to ATP production were responsible for the phenotype. The bioprocess was further enhanced with a feeding strategy that achieved 70 g/L of product. The proposed bioprocess is expected to outperform the economics of the current ‘oxo‑process’ by 2020.
Conclusions: In this study, using genome shuffling, we obtained a strain capable of producing PA exceeding the commercial needs. The multiomics comparison between the novel strain and the wild type revealed overexpres‑ sion of amino acid pathways, changes in sucrose transporters and an increased activity in the methylglyoxal and the glucuronate interconversion pathways. The analysis also suggests that a mutation in the cytochrome C biogenesis gene, coupled with ATP production through the Wood–Werkman cycle, may be responsible for the increased PA production.
Keywords: Propionic acid, Propionibacterium, Genome shuffling, Genomics, Metabolomics, Transcriptomics
© The Author(s) 2018. This article is distributed under the terms of the Creative Commons Attribution 4.0 International License (http://creat iveco mmons .org/licen ses/by/4.0/), which permits unrestricted use, distribution, and reproduction in any medium, provided you give appropriate credit to the original author(s) and the source, provide a link to the Creative Commons license, and indicate if changes were made. The Creative Commons Public Domain Dedication waiver (http://creat iveco mmons .org/ publi cdoma in/zero/1.0/) applies to the data made available in this article, unless otherwise stated.
Background
Traditionally derived from fossil fuels, propionic acid (PA) is used in the food industry as a preservative. Due to its three-carbon backbone, PA has found increased use for the synthesis of monomers and polymers. As a result, the market for PA has steeply grown 5.1% per annum to over 350,000 tonnes/year over the past decade. This increased demand results in the need for new PA
infrastructure and more sustainable production routes [1]. Bacterial fermentation addresses many environmen-tal concerns and offers a sustainable alternative for its
production. Propionibacteria naturally produce PA as
their main fermentation product using the Wood–Werk-man cycle [2, 3]. Recent economic and ecological assess-ment called for a yield of 0.6 g/g for an economically viable scalable process [1, 4].
PA yield determines economic viability as the feed-stock and the downstream purification process contrib-utes largely to the production cost of PA biosynthesis [1]. Given limitations in the availability of tools for rational
Open Access
*Correspondence: [email protected]
1 Australian Institute for Bioengineering and Nanotechnology (AIBN), The University of Queensland, Brisbane, QLD 4072, Australia
strain design, random mutagenesis and/or adaptive evo-lution have been the best strategies to improve the yield
of PA in propionibacterium. We have previously used
genome shuffling (GS) to obtain a recombinant strain capable of producing PA at a yield of 0.55 g/g which was close to the target yield of 0.6 g/g [5–7]. Developed in the early 2000s, GS is a rapid phenotypic improvement technique based on protoplast fusion [8, 9]. GS relies on multiple combinatorial recombination events in
well-conserved regions of the genomes [5] of the parental
strains leading to the desired phenotype. The technique has recently been reviewed in detail by [10]. Success heavily depends on finding appropriate screening meth-ods to select for the superior phenotype.
In Propionibacterium, PA biosynthesis is closely linked to energetics. The Wood–Werkman cycle is involved in generating ATP, and balancing redox [11]. As a key bio-synthetic pathway of energy metabolism, we were able to correlate PA production with faster growth rate. At the same time, faster growth rate is generally influence by the more efficient energetics. Cells regulate their metabo-lism through intracellular concentration of energy-linked metabolites. For example, imbalanced AMP, ADP, ATP, cAMP and c-di-AMP trigger mutations in the central
carbon metabolism [12]. Such example shows that in
response to a metabolic imbalance, cells respond by upregulating alternative pathways. One example of such a pathway is the methylglyoxal pathway which is used to regulate the concentration of imbalanced metabolites [13]. For example, in E. coli, induction of the methylgly-oxal pathway has been observed as a response for glu-cose-6-phosphate deregulation [14–16]. Methylglyoxal is produced from dihydroxyacetone phosphate and can be induced by high concentrations of the latter. Reports sug-gest that the methylglyoxal pathway relieves cells from stress by elevating levels of sugar phosphates [17].
The last decade has also seen rapid advances in high-throughput analytics for strain characterization [18], opening new avenues for understand genotypic changes leading to improved phenotypes. Here, we used a system-atic approach to understand the genomic changes leading to a commercially viable process for PA production. The new strain obtained by genome shuffling was obtained from a combination of various strains of
Propionibacte-ria [5]. Genomics, metabolomics and transcriptomics
were then used to understand the mutations leading to the improved phenotype. A systematic molecular charac-terization of the phenotype revealed three key mutations. The analysis was complemented with the design of a non-structured growth-model [19, 20]. The model was used to design a feeding strategy resulting in 70 g/L of PA, ena-bling further reduction of downstream purification costs. The process was economically assessed using a revised
economic model to predict if the current biological pro-cess will be feasible at a 170 kta (thousand tons per year) scale.
Methods Strains
To access genomic diversity, genome shuffling (GS) was
performed using P. acidipropionici F3E8 (previously
obtained using GS and the wild-type strains P. acidipro-pionici ATCC 55737 and P. acidipropionici ATCC 4875 [5]), P. acidipropionici ATCC 4875, P. acidipropionici
ATCC 4965, P. intermedium ATCC 14072 and P. jensenii
ATCC 9617. Wild-type strains were selected from a col-lection of 17 strains previously characterized on sucrose [7]. All strains were kept at − 80 °C using glycerol (20%) as cryoprotectant.
Media
Except when otherwise specified, the PAM medium used contained yeast extract (10 g/L), trypticase soy (5 g/L), K2HPO4 (0.05 g/L), MnSO4 (0.05 g/L), and sucrose
(40 g/L). Agar (15 g/L) was added to PAM plates. 80 g/L instead of 40 g/L was used in instrumented ferment-ers for batch cultures. The feeding solution of fed-batch cultures consisted in PAM media fivefold concentrated and a sugar concentration of 350 g/L. Sucrose was always autoclaved separately. The chemically defined medium (CDM) contained: sucrose (20,000 mg/L), FeSO4·7H2O (10 mg/L), Fe(NO3)2·9H2O (1 mg/L),
K2HPO4 (100 mg/L), KH2PO4 (500 mg/L), MgSO4·7H2O
(500 mg/L), MnSO4 (10 mg/L), CaCl2·6H2O (10 mg/L),
NaH2PO4·H20 (1597.5 mg/L), CoCl2·6H2O (10 mg/L),
Na2HPO4 (3675 mg/L), biotin (0.2 mg/L), riboflavin
(2 mg/L), thiamine hydrochloride (1 mg/L), vitamin B12 (0.2 mg/L), and pantothenic acid (2 mg/L) and 12 amino acids. The 12 amino acids used were arginine (200 mg/L), asparagine (2000 mg/L), cysteine (200 mg/L), glutamine (200 mg/L), histidine (200 mg/L), leucine (200 mg/L), methionine (200 mg/L), phenylalanine (200 mg/L), proline (200 mg/L), serine (200 mg/L), tryptophan (200 mg/L) and tyrosine (200 mg/L).
pH gradient plates
Protoplast formation, fusion, and regeneration
GS was performed as described in our previous study [5]. Protoplast formation buffer (PFB) was made from (g/L): sodium succinate (40.5), sucrose (42.75), and MgCl2 (1.9).
PFB was dissolved in one litre of Tris–HCl 0.05 mol/L at pH 7.1. Regeneration buffer (RB) was made from (g/L): yeast extract (10), trypticase soy (5), KH2PO4 (1.5),
K2HPO4 (2.5), and BSA (5). The media were adjusted to
pH 7. For the protoplast preparation, cells were grown for 24 h in PAM media supplemented with 40 g/L of glucose and 1% of glycine. Cells were then conditioned in PAM media containing 1% of glycine and 120 g/L of glucose for an extra 24 h. After at least ten generations, cells were washed twice using PBS and fixed to an A600 of 0.2 in a lysozyme solution containing 15 mg/mL (600,000 U/mL) in PFB. Cell walls were digested in a 125 mL flask for two h at 120 rpm and 40 °C. Protoplasts were detected in a light microscope using the 100× oil immersion objective and counted using a haemocytometer. When appropri-ate, protoplasts were regenerated in RB (pH 7 for 48 h at 32 °C). For the protoplast fusion, to motivate recom-bination, protoplasts were treated with UV light (36 W at 253.7 nm to a distance of 30 cm) for 0.5 min or were treated with heat at 60 °C for 2 h. Cells were mixed, cen-trifuged and re-suspended in 500 µL of PFB. Then, 500 µL of PEG 6000 (80%) with 20 mmol/L CaCl2 was added.
Fusion conditions were pH 7.1, time 30 min, and tem-perature 32 °C. After fusion, 5 mL of PFB was added and centrifuged at 3500 rpm for 5 min. Protoplasts were washed twice with 5 mL of PFB and re-suspended in 1 mL of RB.
GS and strain selection
Strain diversity was created by shuffling the wild-type strains P. acidipropionici ATCC 4875, P. acidipropionici
ATCC 4965, P. intermedium ATCC 14072, and P. jensenii
ATCC 9617. Separately, the strain P. acidipropionici 4875 was shuffled with the other three wild-type Propionibac-terium strains. Cells were selected from the acidic side of pH/PA gradient plates. In total, three rounds of genome shuffling were performed with each set of strains. Next, another three rounds of GS were performed with the two libraries of strains, the parental strains P. acidipropio-nici ATCC 4875, P. acidipropionici ATCC 4965, P. inter-medium ATCC 14072, P. jensenii ATCC 9617, and the mutant P. acidipropionici F3E8. Finally, the new recom-binants were isolated by serial dilutions in PAM media agar plates. Plates were incubated in anaerobic jars con-taining AnaeroGen sachets. Oxoid strip anaerobic indi-cators were used to confirm anaerobiosis. Individual recombinants were randomly selected and screened in a 96-well plate containing 100 µL of PAM media at pH 5
and 25 g/L of PA. Growth was monitored using a micro-plate reader (FLUOStar Omega, BMG Labtech, Morning-ton, Victoria, Australia) adapted to maintain anaerobic conditions through a continuous injection of nitrogen. The selection criteria were based on an acid tolerance improvement which was determined by an acidic ratio comparison between the new strains and the wild type— ratios were calculated by dividing the specific growth rate under acidic conditions over specific growth rate under non-acidic conditions. The best performing strains (Additional file 1: Table S1) were scaled up to 250 mL serum bottles with a working volume of 100 mL. Serum bottles were incubated using an orbital shaker incuba-tor (Multitron, Infors-HT, Bottmingen, Switzerland) at an agitation rate of 100 rpm (2.5 cm orbit) and a working temperature at 32 °C for 96 h.
Bioreactor fermentations
Fermentations were performed using 2-L Applikon fer-menters with a working volume of 1 L for batch cultures. Fermenters were equipped with probes and controllers for pH, dissolved oxygen, temperature, and agitation. The agitation rate was controlled with two Rushton impel-lers at 300 rpm. The pH was controlled at 6.5 using 10 M NaOH. The temperature of the culture was maintained at 32 °C using an electric jacket. Before inoculation, the fermenters were sparged with N2 for at least 15 min. A
constant head space N2 flow was kept for the entire
fer-mentation at a flow rate of 0.3 L/min. Cultures were activated under sterile conditions in a 1.5 mL Eppendorf tubes containing 1 mL of PAM media inoculated with 0.8% (v/v) of a glycerol stock. Inoculums were grown for 24 h at 32 °C. Cultures were transferred into a 15 mL Fal-con tube Fal-containing 14 mL of PAM media and allowed to grow for 24 h. 5% (v/v) of this culture was used to inoculate 250 mL serum bottles containing 100 mL of PAM media and allowed to grow for an additional 24 h. Cells from the serum bottles growing in mid-exponen-tial phase were used to inoculate fermenters at an inimid-exponen-tial A600 of 0.3. Fed-batch cultures were performed using the same culture conditions at a working volume of 0.7 L.
Model development for fed‑batch design
The construction of the batch and fed-batch models was adapted from [19]. The model was first developed as a batch culture and extrapolated to a fed-batch system. The parameters of the batch model were obtained from the fermentation in PAM medium using 80 g/L of initial sucrose concentration. The following assumptions were made:
3. PA and acetic acid (AA) are the only inhibitory metabolites.
4. The pH is known and controlled throughout the fer-mentation at pH = 6.5.
Batch model
The differential mass balance Eqs. (1)–(8) describe the dynamic of propionic acid production in batch fermenta-tion as follows:
Equation (1) represents the growth rate and Eq. (8) its specific rate (µ). The latter equation was adapted from the Leudking and Piret expression. Equation (2) repre-sents the consumption rate of sucrose and Eq. (7) rep-resents its specific rate which considers inhibition by PA and AA. PA, pyruvate (PYR), AA, and succinic acid (SA) production rates are represented by Eqs. (3), (4), (5), and (6), respectively; they consider growth associated
(K) and non-growth associated production parameters
(β). The Eqs. (5) and (6) also describe the consumption of pyruvate generated by Eq. (4) to produce AA, and SA, respectively.
(1)
dX
dt =uX (biomass)
(2)
dS
dt = −qsX (sucrose)
(3)
dPA dt =
K1u+βpa
X (propionic acid)
(4)
dPYR
dt =
K2u+βpyr−K3
PYR PYR+Kpyr
X
pyruvic acid
(5)
dAA
dt =
K4u+βaa+K5 PYR
PYR+Kpyr
X (acetic acid)
(6) dSA
dt =
K6u+βsa+K7
PYR PYR+Kpyr
X (succinic acid)
(7) qs=rsmax
S
Ks+S
kipa kipa+PA
kiaa kiaa+AA
(specific substrate consumption)
(8) u=(qsYxs)−(msYxs)
specific growth rate
Fed‑batch model
The batch model was extrapolated to a fed-batch cul-ture to design the feeding profile. High PA production and sugar accumulation below 40 g/L were the criteria to design parameters for the fed-batch feeding strategy.
The fed-batch model was represented with Eqs. (9)–
(16). To obtain these equations, a differential equation to represent volume (V) and calculate the factor dilu-tion (D) were added to the Eqs. (1)–(6).
Reliability of the model
The coefficient of determination (R2) was used to
deter-mine the reliability of the model. The R2 was calculated
as follows:
(9)
dx
dt =uX−DX (biomass)
(10) dS
dt = −qsX+D(So−S) (sucrose)
(11)
dPA dt =
K1u+βpa
X−DPA (propionic acid)
(12)
dPYR
dt =
K2u+βpyr−K3 PYR
PYR+Kpyr
X
−DPYR
pyruvic acid
(13) dAA
dt =
K4u+βaa+K5 PYR PYR+Kpyr
X
−DAA (acetic acid)
(14) dSA
dt =
K6u+βsa+K7
PYR PYR+Kpyr
X
−DSA (succinic acid)
(15) dV
dt =F (flow rate)
(16)
D=FV (factor dilution)
R2= 1
m m
j=1
1− SSE
SST
SSE=
n
i=1
Parameters estimation
Excluding the Ks value, the package SBPDgui of the
Sys-tem Biology Toolbox 2 (SBTOOLBOX2) was used to determine the parameters of the model [21]. The Ks value
of Eq. 7 was determined experimentally using data from serum bottle fermentations in PAM medium at different concentrations of sucrose.
Calculation of fermentation parameters
Specific growth rate (µ) was calculated at the mid-expo-nential phase. Specific growth rate calculations in 96-well plates were performed using the program GrowthRates [22]. For consistency, volumetric productivity (Pv) was
calculated for the same time interval (ranging from 15 to 30 h). Yield (Yps) was calculated using the total PA
pro-duced over the consumed substrate. PA:AA and PA:SA ratios were calculated using total organic acid produc-tion. The PA:AA and PA:SA ratios are indication of effi-ciency, in which the higher the ratios the lower is the production of the by-products AA and SA, respectively. The specific consumption rate of sucrose (qs) and the
specific production rate of PA (qp) were computed at
mid-exponential phase multiplying specific growth rate by the linear correlations of sugar or PA with biomass.
Intracellular pH measurement (pHi)
Intracellular pH (pHi) was measured using the method
adapted from [23]. Fluorescence of 2′,7′
-bis-(2-carboxyethyl)-5(and 6)-carboxyfluorescein acetoxyme-thyl ester (BCECF AM) was used to measure pHi. BCECF AM is a pH-sensitive fluorescein derivative probe with a dual-excitation ratio. Briefly, cells (2 mL with a A600 of 2) were centrifuged (12,000 rpm, 1 min) and washed with 50 mM HEPES-K buffer (pH 8). The pellet was re-suspended in 2 mL of the same buffer and incubated with 1 μL of 1 μM BCECF AM for 20 min at 32 °C. After, cells were washed with 50 mM potassium phosphate buffer (pH 7). The pellet was re-suspended in the same buffer and 50% of the suspension was filtered. Fluorescence intensities were performed in a fluorescence spectropho-tometer with an excitation spectrum of 490 nm (pH sen-sitive) and 440 nm (pH-insensen-sitive). The emission was at 535 nm. The ratio of the emission intensity at 490 and 440 of both the suspension (S) and filtrate (F) was determined
SST= n
i=1
(yi− ¯y)2
¯ y= 1
n n
i=1
yi
as follows: R= (S490−S440)/(F490−F440). This ratio and a
calibration curve were used to calculate the pHi.
The calibration curve was determined for each strain as follows. Valinomycin and nigericin (Sigma) were added to each strain (A600 of 2) to a final concentration of 50 µM to maintain equilibration of pHi with extracellular pH (pHex). The cultures were then incubated at 32 °C for 20 min. Cells (2 mL with an A600 of 2) were centrifuged, washed and re-suspended in 2 mL of buffer at pH 4, 5, 6, 7, or 8 (50 mM citrate buffer, pH 4 and 5; 50 mM phos-phate buffer, pH 6, 7 and 8). After, 1 µL of 1 µM BCECF AM was added and incubated for 20 min at 32 °C. After the incubation, cells were washed and re-suspended using the respective buffer. Finally, 50% of the suspen-sion was filtered, and the fluorescence determination and ratio calculation were performed as mentioned above.
Analytics
The absorbance of the culture was measured at 600 nm using a Biochrom Libra S12 UV/Vis spectrophotometer. Organic acids, carbohydrates, and alcohol were quanti-fied by ion-exclusion chromatography as described else-where [24].
DNA sequencing, de novo assembly, annotation, and comparison
Genomic DNA was extracted using PureLink Genomic DNA Mini kit (Invitrogen Cat. No. K1820-01) and quan-tified using Nanodrop 1000 (Thermo Scientific) and Qubit dsDNA BR assay kit (Life Technologies Cat. No. Q32850). The quality of the DNA was determined by running a 1% agarose gel with DNA gel stain SYBR safe (Life Technologies Cat. No. S33102). The gel was visual-ized with a ChemiDoc MP system (Bio-Rad). The PacBio sequencing platform was used to obtain the complete genome of the new recombinant strain. The PacBio library preparation was performed using the proto-col for 20 Kb selected with the BluePippin system. The sequencing chemistry was the release P6-C4 by PacBio and loaded by magnetic beads. The genome assembly was performed with the SMRT portal. This portal was also used to align the reads and call the variants of the sequenced genome. Finally, the RAST and SEED viewer servers were used to annotate and visualize the assem-bled genome, respectively [25, 26]. Genome-to-genome distance calculator was used to determine similarity
between two whole genome sequences [27]. Mauve was
used to align multiple genome sequences and trace back genomic mutations [28]. Blast was used to extract
spe-cific genomic regions [29]. The genome was submitted
Intracellular metabolites extraction
Cells sampled at mid-exponential phase were used for intracellular metabolomics analyses as described in [30–33]. Metabolites extraction was performed with 50% acetonitrile (ACN). Briefly, 1–20 ODs (1 OD = 1 mL of a culture with an OD of 1) were harvested and centrifuged at 20,172g for 2 min at room temperature. The superna-tant was then discarded, and the pellet was resuspended in 50% ACN. This solution was vortexed for 10 s every 2 min for three times and centrifuged for 3 min at 4 °C at 20,172g. After, the supernatant was placed into a tube and frozen at − 80 °C before being freeze dried. Finally, the powder was resuspended in 0.5 mL of MilliQ water. Intracellular metabolites of the central carbon metabo-lism were analysed by LC–MS and intracellular amino acids by HPLC (method described above). Metabolite concentrations were standardized using dry cell weight values. The factor to convert A600 to dry cell weight (g/L) was 0.29 for P. acidipropionici ATCC 55737 and 0.25 for
P. acidipropionici WGS7.
Statistical analyses of intracellular metabolomics
Metabolomics data were normalized and analysed for statistical significance using the R Package “metabo-lomics” [34].
RNA extraction, sequencing, and analyses
Cells sampled at mid-exponential phase were used for RNA extraction as described in [35]. Briefly, 50 ODs (1 OD = 1 mL of a culture with an OD of 1) were harvested and centrifuged at 4000g for 10 min at room temperature. The supernatant was removed, and 5 mL of RNA later reagent was added to the pellet. After 8–24 h of incuba-tion at 4 °C, the RNA later was removed by centrifugaincuba-tion and the pellet stored at − 80 °C for further use. RNeasy® Mini Kit (Qiagen) was used to extract the RNA and the RNA Clean and Concentrator-25 Kit (Zymo) to clean it. Next, the RNA was enriched depleting the ribosomal RNA with the Ribo-Zero Magnetic Kit (Illumina). The samples were cleaned and concentrated with the RNA Clean and Concentrator-5 Kit (Zymo). The quality of the RNA was evaluated by a Bioanalyzer. Finally, the samples were sequenced using the Illumina platform 100 bp Pair End. Tophat, Cufflinks, and CuffDiff were used to align the RNA-seq reads against the reference genome P. acidi-propionici ATCC 55737 [36], normalize and annotate the transcripts, and evaluate the differential expression, respectively [37]. The cutoff for significant differentially expressed genes was twofold change and q < 0.05. The raw transcriptomic data and complete differential expression list (also found in Additional file 2) were deposited in the Gene Expression Omnibus data repository under the accession number GSE86950.
Results and discussion
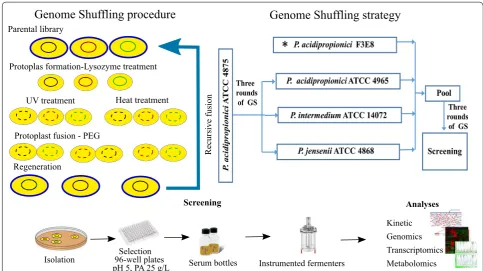
Propionibacterium fermentation is inherently inhibited by acid accumulation that ultimately results in growth arrest [38]. Previously, immobilized cells and extractive fermentation systems have been used to improve pro-duction with limited success [6, 39–42]. Due to scalabil-ity problems using immobilized bed reactors, the best alternative is to develop an improved biocatalyst able to tolerate acidic conditions. Such phenotypes can be obtained using GS. We recently obtained a strain capa-ble of producing PA with a yield of 0.55 g/g of glucose using GS [5]. As part of that study, ten strains obtained through GS were sequenced. The analysis showed a cor-relation between the improved phenotype and acid tol-erance. Therefore, to further enhance acid tolerance, we used GS and a PA/pH gradient strategy for screening for higher producers. Firstly, we fused P. acidipropionici
ATCC 4875 with P. acidipropionici ATCC 4965, P. inter-medium ATCC 14072, and P. jensenii ATCC 9617. The strains obtained were then fused again with our
previ-ously obtained mutant strain P. acidipropionici F3E8
(Fig. 1) [5].
Strains were then characterized using 96-well plates containing 25 g/L of PA and a pH of 5. The screening resulted in 13 candidates that were grown in serum bot-tles (Additional file 1: Table S1). Six out of the thirteen strains had a higher PA yield relative to F3E8. All six strains grew to a higher cell density. The top-three pro-ducing strains were moved to instrumented ferment-ers, and the best strain was selected (hereafter named WGS7). The strain was characterized using a multiomics approach which has been shown to help elucidating links between phenotype and genotype.
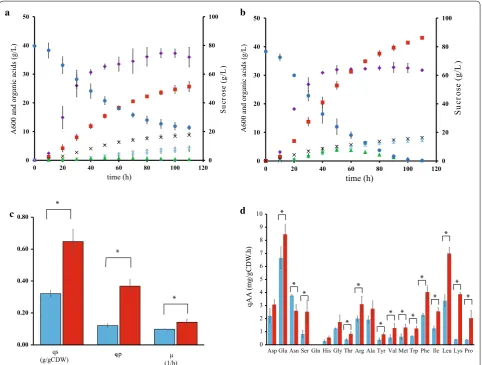
As shown in Table 1 and in Fig. 2, WGS7 had an
improvement of 37%, 85%, 43%, and 80% in the PA yield, PA:AA ratio, growth rate, and volumetric productiv-ity, respectively. The PA:AA improvement was the main contributor for the reduction in cost of the PA
down-stream purification in WGS7 [1]. The PA:SA ratio was
unchanged (p > 0.05). We also observed an
improve-ment in the intracellular pH gradient (ΔpH =
inter-nal pH − extracellular pH). The strain WGS7 had a
ΔpH = 1.27 compared to the wild type which had a
ΔpH = 0.43 (Table 1). Improvements in ΔpH have been
reported to improve acid tolerance in other
The comparison between the experimental data and the simulation for fed-batch culture had a R2 of 0.96 (Fig. 3b),
suggesting a high accuracy of the model to predict the
production of PA in WGS7. The R2 for the batch
cul-ture at high initial sugar concentration (130 g/L) was 0.90 (Fig. 3a). This value suggests issues in the model to accurately predict PA at high sugar concentrations. In the fed-batch culture, WGS7 had a 58% increase in PA pro-duction compared to its optimal PA propro-duction in batch culture (Figs. 2b, 3b, and Additional file 3: Table S6). The WGS7 fed-batch culture, producing 70 g/L of PA, enables for the first time, an economically viable bioprocess using
Propionibacterium spp.
Comparative genomics
To evaluate similarities between the strains used for GS, we used the genome-to-genome distance calculator
[27]. As expected, high genomic similarities were found between the P. acidipropionici strains with a similitude
of 86.86% ± 3.58%, which corresponded to a genomic
distance of 0.016 ± 0.004. Comparatively, the similar-ity between P. intermedium ATCC 14072 and P. jensenii
ATCC 9617 was 90.70%, which corresponds to a genomic distance of 0.010. On the other hand, the similarity between the P. acidipropionici strains and the other Pro-pionibacterium spp. was only 26.83% ± 1.21%, which cor-responded to a genomic distance of 0.163 ± 0.006.
The best strain obtained using GS, WGS7, was sequenced using PacBio RS II and assembled using the SMRT Portal. The 3.16 Mb genome was annotated using
RAST [25], which found 3333 CDS and 65 RNAs. Using
the SMRT portal, the closest relative found was P. acidi-propionici ATCC 55737 (hereafter denoted ATCC55737). As such, ATCC55737 was used for comparison hereafter. Parental library
Protoplas formation-Lysozyme treatment
UV treatment Heat treatment
Protoplast fusion - PEG
Regeneration
Screening
Isolation 96-well platesSelection Serum bottles Instrumented fermenters pH 5, PA 25 g/L
noi
suf
e
vis
ru
ce
R
Genome Shuffling procedure
Genome Shuffling strategy
Kinetic Genomics Transcriptomics Metabolomics
Analyses
Fig. 1 The general procedure to obtain and analyse WGS7. Left: genome shuffling procedure. Right: genome shuffling strategy. Bottom: screening procedure and analyses. PEG: polyethylene glycol. (Asterisk) P. acidipropionici strain previously obtained in [5]
Table 1 Parameters for P. acidipropionici ATCC 55737 and P. acidipropionici WGS7 grown in 2-L fermenters
∆pH: pHi − pHext (pHi: internal pH; pHext: external pH)
a Calculated during the range of time: 15–30 h
+p value < 0.05
Strain +Yps (g/g) PA:SA (g/g) +PA:AA (g/g) a+P
v (g/L h) +∆pH +Final PA (g/L)
P. acidipropionici ATCC 55737 0.45 ± 0.03 6.28 ± 0.94 2.95 ± 0.35 0.530 ± 0.21 0.43 ± 0.04 26.28 ± 1.88
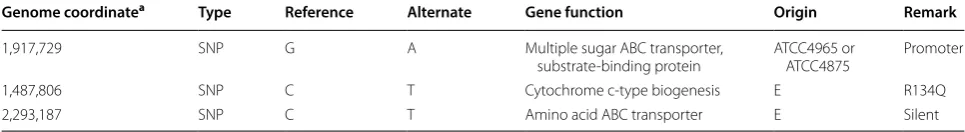
The genomic comparison found 17 SNPs and seven
INDELs (Additional file 4: Figure S2 and Additional
file 5: Table S3). The genomic regions with mutation in WGS7 were aligned with the other strains used for GS. The comparison suggests that two mutations in WGS7 came from the wild-type strains used for GS. The
muta-tion G1917729A was also found in P. acidipropionici
ATCC4875 and P. acidipropionici ATCC4965, and the
mutation A3335969G was found in all wild-type strains used for GS (Additional file 6: Figures S4, S5). The other mutations, found in WGS7, could not be linked to any of the other strains and, therefore, their origin remains elusive. It is possible that the other mutations are com-ing from adaptive laboratory evolution in response to the
acid challenge, which is a common technique routinely used in industry and academia for strain improvement [38].
Linking metabolomics
To better understand the links between phenotype and genotype, a systems-level characterization, previously shown to be a useful tool to characterize links between genotype and phenotype [23, 39, 40], was performed. Extracellular metabolites were measured across the fer-mentation time course (Fig. 2). The growth rate, sucrose, amino acids uptake rates and the PA production rate were calculated from the exponential growth phase. WGS7 had a 96% higher sucrose uptake rate and a 216%
b
0 20 40 60 80 100
0 10 20 30 40 50
0 20 40 60 80 100 120 a
0 20 40 60 80 100
0 10 20 30 40 50
0 20 40 60 80 100 120
0 1 2 3 4 5 6 7 8 9 10
Asp Glu Asn Ser Gln His Gly Thr Arg Ala Tyr Val Met Trp Phe Ile Leu Lys Pro 0.00
0.20 0.40 0.60 0.80
qp µ
(1/h)
Suc
ro
se
(g
/L)
d c
)h.
W
D
Cg/g
m(
A
Aq
time (h)
time (h)
Su
cr
ose
(g
/L
)
A600 and organic acids (g/L) A600 and organic acids (g/L)
qs (g/gCDW)
*
*
*
* *
* * *
*
* *
* * *
*
*
*
higher specific PA production rate (Fig. 2c) compared to ATCC55737. All the sugar was depleted in WGS7 within 100 h, whereas ATCC55737 only consumed 69% of the total sugar provided. A mutation, G1917729A, was found in the promoter region of an ABC sugar transporter
(Table 2). Mutation G1917729A in WGS7 seems to come
from either P. acidipropionici ATCC4875 or P. acidipro-pionici ATCC4965 (Additional file 6: Figure S4). This gene was found overexpressed (log2 2.2, q < 0.05) in the
transcriptomics data (Fig. 4). In agreement with the data, the sucrose uptake rate was increased in WGS7 (Fig. 2c). Upregulation of sugar transporters is commonly used to enhance production in metabolic engineering. Many studies have previously overexpressed sugar transporters to enhance production. For example, transporters have been overexpressed in E. coli to improve sugar consump-tion and enhance producconsump-tion of several metabolites [43, 44].
Sixty-four intracellular metabolites, extracted in mid-exponential phase, were analysed by LC–MS or HPLC.
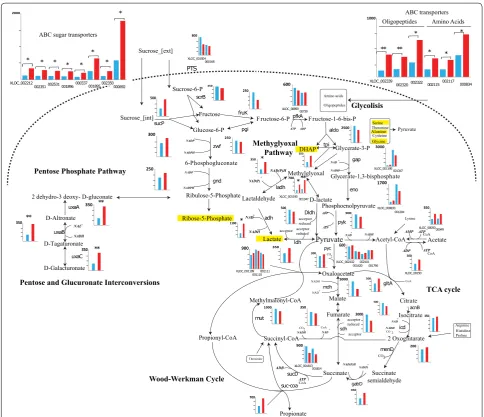
Six intracellular metabolite concentrations were found to be statistically significant (p < 0.05) using the R Pack-age “metabolomics” between the strains compared. From these significant intracellular metabolites, the concen-tration for serine (Ser) and glycine (Gly) was decreased. The concentrations for alanine (Ala), dihydroxyacetone phosphate (DHAP), ribulose-5-phosphate (R5P) and lac-tate (Lac) were increased (Fig. 4; Additional file 7: Figure S1 and Table S2).
The genomic analysis found the mutation C2293187T in an ABC polar amino acid transporter (Table 2). Polar amino acids include arginine, lysine, aspartate, glu-tamine, asparagine, glutamate, serine, threonine, tyros-ine, cystetyros-ine, methiontyros-ine, and tryptophan. All those amino acids, except for aspartate and asparagine, were consumed faster in WGS7 than in the wild type (Fig. 2d). Several other investigations have suggested that amino acids metabolism can be closely linked to acid
toler-ance mechanisms [23]. Here, we observed an
improve-ment in intracellular pH in WGS7 compared to the wild
Fig. 3 Fermentation profile of 2‑L bioreactors with P. acidipropionici WGS7. a Batch culture with 130 g/L of sucrose. b Fed‑batch culture with a feeding solution of 5× the PAM media and a constant feeding rate of 0.0066 L/h from time 40 h (start) to 64 h (end). For both figures: continuous line indicates model simulation and markers indicate experimental data. Absorbance: blue; propionic acid: light green; sucrose: red; succinic acid: light blue; acetic acid: orange; pyruvate: purple; lactate: green. Experimental absorbance: blue circle; experimental propionic acid: light green lozenge; experimental sucrose: red square; experimental succinic acid: light blue asterisk; experimental acetic acid: orange plus sign; experimental pyruvate: black multiplication sign. oaa: organic acids; experimental lactic acid: light green circle. No simulation data are shown for lactic acid
Table 2 Mutations selected in this study to understand high PA production in WGS7
SNP single nucleotide polymorphism, E elusive
a Genome coordinate in P. acidipropionici ATCC 55737. ATCC4965 P. acidipropionici ATCC 4875; ATCC4875 P. acidipropionici ATCC 4965. Silent: no change in amino acid
Genome coordinatea Type Reference Alternate Gene function Origin Remark
1,917,729 SNP G A Multiple sugar ABC transporter,
substrate‑binding protein ATCC4965 or ATCC4875 Promoter
1,487,806 SNP C T Cytochrome c‑type biogenesis E R134Q
type. In agreement with that observation, arginine, glu-tamate, lysine, and serine were consumed faster in the
complex medium in the WGS7 strain (Fig. 2d). To test
their involvement in acid tolerance, each amino acid was added to the CDM separately in both strains. The addi-tion of arginine increased 13% the final PA titre in WGS7 compared to only 3% in the wild type (Additional file 8: Figure S3). Arginine is metabolized through the arginine
deiminase (ADI) pathway in P. acidipropionici. Other
investigators have reported that overexpression of the arginine deiminase pathway increased PA production
by tenfold in P. jensenii [45]. However, RNA-seq data showed that the arginine/ornithine antiporter gene was downregulated in WGS7 and that the pathway is not differentially transcribed (Additional file 2). Downregu-lation suggests that the ADI pathway is unlikely to be involved in acid tolerance in the new strain and that the polar amino acid transporter is likely to be transporting a different amino acid. Lysine consumption rate in WGS7 was eightfold higher than in the wild-type strain. Lysine supplementation increased 41% the PA production in WGS7 compared to 7% in the wild type. Similarly, serine
350 1700 3000 1100 500 350 250 350 3000 700 3000 900 500 700 sucP 250 800 500 200 350 300 Sucrose_[ext] Sucrose_[int] Fructose Glucose-6-P Fructose-6-P Fructose-1-6-bis-P Pyruvate Acetyl-CoA Oxaloacetate Malate Fumarate Succinyl-CoA Propionyl-CoA Propionate Arginine Histidine Proline Citrate 2 Oxoglutarate Threoinine Methyglyoxal Pathway Ribulose-5-Phosphate 6-Phosphogluconate NADP NADPH + NADP NADPH + Wood-Werkman Cycle TCA cycle Glycolisis NAD NADH + P T A ADP
ADP ATP 250 gnd 300 zwf pgi fruK 600 XLOC_00890 00739 pfkA aldo2500 tpi Glycerate-1,3-bisphosphate XLOC_001190001347 gap NAD NADH + eno XLOC_000833 001204 900 pyk 350 Lactaldehyde ldh ladh NAD NADH Methylglyoxal adh NAD(P)H NAD(P)+ + 350 XLOC_0005000049 ATP AMP
NAD+ NADH
XLOC_002102 001620002101001796
600 Acetate ATP ADP 300 CoA CoA CoA XLOC_00150 gltA Isocitrate acnB icd NAD+ NADH CO 2 Succinate semialdehyde 350 gabD NAD(P)H NAD(P)+ NAD NADH menD CO2 Sucrose-6-P PTS 450 scrB D-lactate XLOC_001190001347 Dldh XLOC_001504 000168 + CO2 CoA acceptor reduced acceptor ATP ADP sucD CoA pyc mdh XLOC_001813 001814 300 acceptor reduced suc-coa 900 XLOC_001109 001110001111 Methylmalonyl-CoA 1000 mut Pyruvate
Pentose Phosphate Pathway
1000
1
ABC transporters Oligopeptides Amino Acids
XLOC_002339
002320 002322 002115002117 000834
Amino acids Oligopeptides CO2 sdh D-Altronate D-Tagaturonate 2 dehydro-3 deoxy- D-gluconate
D-Galacturonate NADH NAD+ 350 uxaC uxaB uxaA 350
Pentose and Glucuronate Interconversions +
350 002351 002531 001896000337001895002350000692
ABC sugar transporters * ** ** * * * * * * * * * * * * * *** ** ** ** acceptor reduced acceptor Alanine Cysteine Serine Threonine Glycine Lysine DHAP Phosphoenolpyruvate Glycerate-3-P Ribose-5-Phosphate Lactate Succinate Threonine Alanine Lysine 2000 XLOC_002212
supplementation increased the PA titre 36% in WGS7 compared to 12% in the wild type. Alanine addition did not improve PA production in WGS7. Such results sug-gest a clear involvement of lysine and serine on PA production in WGS7. It is possible, while highly specu-lative, that the ABC polar amino acid transporter may be involved in lysine and serine transport. Lysine decar-boxylation is a well reported acid tolerance mechanism [41–43], which has clearly improved in WGS7 relative to the control strain. In contrast, the involvement of serine in the improved phenotype remains elusive and further investigation to elucidate its involvement is needed.
Comparative transcriptomics
RNA-sequencing was used to compare the transcrip-tional profile of the strains. Our analyses identified 2406 transcribed genes, of which 76 were significantly differ-ent (q < 0.05). Thirteen genes were downregulated and 63 were upregulated. Based on the RNA-sequencing data, a metabolic pathway illustrating the changes in the metabolism is presented in Fig. 4. The figure includes transcripts measurements for the central carbon metabo-lism genes, for sugar transport, amino acid transport, the methylglyoxal pathway, the pentose phosphate pathway and the glucuronate interconversion pathway which are the main pathways showing changes in transcription.
Interestingly, WGS7 showed changes in transcrip-tion for eight ABC sugar transporters, three ABC amino acid transporters and three ABC oligopeptides transporters (Fig. 4 and Additional file 2 and Addi-tional file 5: Table S3). The nitric oxide reductase gene (XLOC_000683) was also found to be differentially transcribed (log2 1.30, q < 0.05). Genes belonging to the
methylglyoxal pathway ladh, adh, XLOC_002338, and
XLOC_002219 were also significantly transcribed in WGS7 (Fig. 4 and Additional file 9: Table S4). Three genes involved in the pentose and glucuronate interconversion were also significantly upregulated including altronate dehydratase (uxaA), altronate oxidoreductase (uxaB), and unronate isomerase (uxaC). The arginine/ornithine antiporter gene was downregulated in WGS7 (log2 1.35, q < 0.05). The flavin reductase gene (XLOC_001914) and the nitric oxide reductase gene (XLOC_000683) were also found significantly upregulated (log2 1.31, q < 0.05
and log2 1.30, q < 0.05, respectively). Our analysis found
global changes at the transcriptional level, which clearly contributed to the improved phenotype. However, the link between the genomic changes and the transcriptom-ics changes remains unclear. Nonetheless, as illustrated in Fig. 4, the transcriptional changes can be linked to the improved phenotype by contributing to better nutri-ent transport and by creating detoxifying pathways for improved metabolism.
Energy metabolism
As mentioned earlier, WGS7 displayed a clear growth improvement relative to the control strain. Improve-ment in growth rate is normally linked to better energet-ics [44, 45]. The mutation C1487806T was found in the
Cytochrome C biogenesis gene (Table 2). Cytochrome
C has been reported to be abundant under anaerobic culture conditions in E. coli [46] and has been associ-ated with anaerobic electron transport through nitrate reductase activity [3, 47] in the early 80 s. We found sig-nificant upregulation of the nitric oxide reductase gene (XLOC_000683); however, its involvement is unclear. We speculate that this mutation may play a role in intra-cellular pH control or stress response as there is a link between nitrate degradation and ammonia; the source of NO is, however, elusive given the anaerobic conditions. A report suggests that the lactate–pyruvate reaction requires an electron acceptor [3]. Other authors have suggested that cytochrome C can act as a natural electron transporter in the lactate–pyruvate reaction [48, 49]. To test this hypothesis, we performed serum bottle fermen-tations on CDM with 50 mM of exogenous lactate. The exogenous addition of lactate increased PA production by 125% in the WGS7 strain while only 66% in the wild type.
An electron transport system in P. acidipropionici is also responsible for the reduction of fumarate in the Wood-Werkman Cycle [3]. Flavin, as flavin adenine dinu-cleotide (FAD), has been suggested to play a role in the fumarate reductase enzyme [50]. Transcriptomics analy-ses showed upregulation of the flavin reductase gene (XLOC_001914). This overexpression suggests that the fumarate–succinate is contributing to the increase in PA production because it is associated with ATP generation [50]. To evaluate our hypothesis, we supplemented CDM cultures with 10 mM of fumarate. The addition of fuma-rate increased PA production by twofold. The fact that PA production in the wild-type was not improved by the exogenous addition of fumarate strengthens our hypoth-esis of a probable improvement in the electron transport chain in the fumarate–succinate reaction (Additional file 8: Figure S3).
uptake rate in WGS7 is likely to have triggered the meth-ylglyoxal pathway (Figs. 2c and 4), a transient low-energy bypass of the lower Embden–Meyerhof–Parnas pathway during abundant carbon source concentrations [13]. Oth-ers have suggested that the abundance of intracellular fructose 1,6-diphosphate, glycerate-3-phosphate, or dihy-droxyacetone phosphate can activate the methylglyoxal
pathway [13]. In agreement with that, WGS7 showed an
increased concentration of the dihydroxyacetone phos-phate metabolite (Fig. 4; Additional file 7: Figure S1). Using the methylglyoxal pathway, cells have a mechanism to control the rate of energy generation relative to the overall catabolic rate.
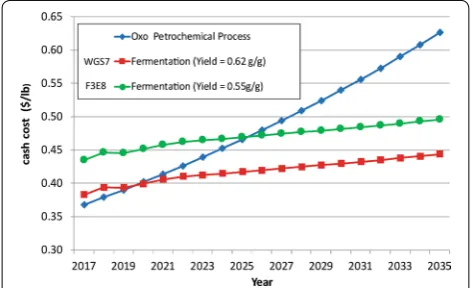
Economic evaluation of WGS7
Prior work has shown that fermentation yield has a sub-stantial impact on the overall economics of biological production of PA [1]. Similarly, Liu et al. [2] have sug-gested that PA concentration and productivity is critical to achieve a commercially viable bioprocess. The process economics model described in [1] was updated to reflect a yield improvement from 0.55 to 0.62 g/g as obtained by WGS7. Data for the Techno-economic analysis were obtained from the data available at Dow AgroSciences and the model used is described in [1]. The model pre-dicts cost of PA production based on the current prices.
As shown in Fig. 5, the yield improvement was more
than a 15% cash cost reduction in 2017 and significantly improved the cost-competitiveness being 39% below the current market value of PA, suggesting commercially viable margin. The net cash costs for PA from the WGS7 process were modelled to be ~ $0.38/lb. Most impor-tantly, the yield improvement with WGS7 reduces the time at which the fermentation process becomes eco-nomically competitive with the “oxo” process from the year 2025 to the year 2020.
Conclusions
Propionibacteria are attractive biocatalysts for the biological production of C3 chemicals. Using GS, we obtained a strain capable of competitively producing PA at 170 kta scale. The fermentation yield obtained resulted in a 15% reduction in cash cost for bio-derived PA which significantly improves the cost-competitiveness with the oxo-processes. Multiomics comparison revealed genomic mutations possibly responsible for the improved phe-notype. Notably, as indicated by RNA-sequencing and metabolomics, an increase in the sucrose uptake rate and an increased in amino acid uptake rate were linked to the new phenotype.
Additional files
Additional file 1: Table S1. Parameters of the fermentations in serum bottles for some strains used in this study.
Additional file 2. Complete list of differentially expressed genes in transcriptomics.
Additional file 3. Supplementary information for kinetic modelling. Table S5. Kinetic model parameters. Table S6. Parameter of the 2‑L fer‑ mentation with P. acidipropionici WGS7 in a Batch or Fed‑Batch culture. Additional file 4: Figure S2. Variants detected in the new genome P. acidipropionici WGS7 taking as a reference genome P. acidipropionici ATCC 55737.
Additional file 5: Table S3. Variants and copy number variation found in the new strain P. acidipropionici WGS7 using as reference strain P. acidipro-pionici ATCC 55737.
Additional file 6. Multiple genome alignments of mutations in WGS7 coming from a parental strain. Figure S4. Multiple genome alignment of the genomic regions 50 bp before and 50 bp after the mutation G1917729A was found in WGS7. ATCC55737 P. acidipropionici ATCC 55737; WGS7 P. acidipropionici WGS7; ATCC4875 P. acidipropionici ATCC 4875; ATCC4965 P. acidipropionici ATCC 4965. Position 51 indicates the mutation G1917729A in WGS7 and similarity with the other wild‑type strains. This genomic region was not found in P. jensenii ATCC 9617 and P. intermedium ATCC 14072. Figure S5. Multiple genome alignment of the genomic region 50 bp before and 50 bp after the mutation A3335969G was found in WGS7. ATCC55737 P. acidipropionici ATCC 55737; WGS7 P. acidipropionici WGS7; ATCC4875 P. acidipropionici ATCC 4875; ATCC4965 P. acidipropionici ATCC 4965. P. jensenii ATCC 9617; P. intermedium ATCC 14072. Position 51 indicates the mutation A3335969G in WGS7 and similarity with the other wild‑type strains.
Additional file 7: Figure S1. Correlation of intracellular metabolites between the new strain P. acidipropionici WGS7 and the wild‑type strain P. acidipropionici ATCC 55737. Table S2. P‑values obtained from metabo‑ lomics comparisons.
Additional file 8: Figure S3. Effects of exogenous addition of 50 mM of lactate (LAC), 10 mM of fumarate (FUM), 10 mM of arginine (Arg), 10 mM of lysine (Lys), 10 Mm of serine (Ser), or 10 mM of proline (Pro) in P. acidi-propionici ATCC 55737 (light blue bars) and P. acidipropionici WGS7 (red bars). Fermentations were performed by duplicate serum bottle fermenta‑ tions containing CDM media.
Additional file 9: Table S4. Legend of the main pathways associated to the PA synthesis.
Abbreviations
PA: propionic acid; AA: acetic acid; SA: succinic acid; GS: genome shuffling; CDM: chemical defined medium; P. acidipropionici: Propionibacterium acidipro-pionici; PA:AA: ratio propionic acid to acetic acid; PA:SA: ratio propionic acid to succinic acid; NGS: next‑generation sequencing; PAM: Propionibacterium acidipropionici culture media; µ: specific growth rate; Pv: volumetric productiv‑ ity; Yps: propionic acid over glucose yield; CDS: coding sequences; qs: specific consumption rate of sucrose; qp: specific production rate of PA; qAA: specific amino acid consumption.
Authors’ contributions
CLF, EM, and LKN participated in the design of the experiments. CLF performed the experiments. CLF and EM analysed the data and wrote the manuscript. CS and BC developed the techno‑economic analyses. All authors read and approved the final manuscript.
Author details
1 Australian Institute for Bioengineering and Nanotechnology (AIBN), The University of Queensland, Brisbane, QLD 4072, Australia. 2 Queensland Node of Metabolomics Australia, The University of Queensland, Brisbane, QLD 4072, Australia. 3 BioEngineering and Bioprocessing R&D, Dow AgroSciences LLC, 9330 Zionsville Road, Indianapolis, IN 46268, USA.
Acknowledgements
The authors acknowledge support from Metabolomics Australia (MA) at The University of Queensland, an NCRIS initiative under Bioplatforms Australia Pty Ltd. We acknowledge Tim McCubbin and Axayacatl Gonzalez Garcia for fruitful discussions. Manuel Plan and Mark Hudson from Metabolomics Australia offered their support throughout all the project.
Competing interests
The authors declare that they have no competing interests. Dow has com‑ mercial interest in the published strain.
Availability of data and materials
The dataset supporting the conclusions of this article are included within the article and its additional files. RNA‑seq data can be found in the Gene Expres‑ sion Omnibus webpage with accession number GSE86950.
Consent for publication Not applicable.
Ethics approval and consent to participate Not applicable.
Funding
EM acknowledges support from the Queensland Government for his Fel‑ lowship. This study was supported by the University of Queensland and the Australian Research Council through a linkage Grant (LP120100517) with Dow. CLF was supported through a CONACYT scholarship from the Mexican Council for Science and Technology (CONACyT).
Publisher’s Note
Springer Nature remains neutral with regard to jurisdictional claims in pub‑ lished maps and institutional affiliations.
Received: 5 April 2017 Accepted: 3 August 2018
References
1. Rodriguez BA, Stowers CC, Pham V, Cox BM. The production of propionic acid, propanol and propylene via sugar fermentation: an industrial per‑ spective on the progress, technical challenges and future outlook. Green Chem. 2014;16:1066–76.
2. Liu L, Zhu Y, Li J, Wang M, Lee P, Du G, et al. Microbial production of propi‑ onic acid from Propionibacteria: current state, challenges and perspec‑ tives. Crit Rev Biotechnol. 2012;32:374–81.
3. Parizzi LP, Grassi MCB, Llerena LA, Carazzolle MF, Queiroz VL, Lunardi I, et al. The genome sequence of Propionibacterium acidipropionici provides insights into its biotechnological and industrial potential. BMC Genomics. 2012. https ://doi.org/10.1186/1471‑2164‑13‑562.
4. Tufvesson P, Ekman A, Sardari RRR, Engdahl K, Tufvesson L. Economic and environmental assessment of propionic acid production by fer‑ mentation using different renewable raw materials. Bioresour Technol. 2013;149:556–64.
5. Luna‑Flores CH, Palfreyman RW, Krömer JO, Nielsen LK, Marcellin E. Improved production of propionic acid using genome shuffling. Biotech‑ nol J. 2016. https ://doi.org/10.1128/genom ea.00248 ‑16.
6. Guan N, Liu L, Zhuge X, Xu Q, Li J, Du G, et al. Genome‑shuffling improves acid tolerance of Propionibacterium acidipropionici. In: Tylor JC, editor. Advances in chemistry research. Nova Science Publishers, Inc.: New York; 2012. p. 143–52.
7. Stowers CC, Cox BM, Rodriguez BA. Development of an industrializable fermentation process for propionic acid production. J Ind Microbiol Biotechnol. 2014;41:837–52.
8. Scheinbach S. Protoplast fusion as a means of producing new industrial yeast strains. Biotechnol Adv. 1983;1:289–300.
9. Zhang YX, Perry K, Vinci VA, Powell K, Stemmer WPC, del Cardayré SB. Genome shuffling leads to rapid phenotypic improvement in bacteria. Nature. 2002;415:644–6.
10. Magocha TA, Zabed H, Yang M, Yun J, Zhang H, Qi X. Improvement of industrially important microbial strains by genome shuffling: cur‑ rent status and future prospects. Bioresour Technol. 2018. https ://doi. org/10.1016/j.biort ech.2018.02.118.
11. Gonzalez‑Garcia R, McCubbin T, Navone L, Stowers C, Nielsen L, Marcellin E. Microbial propionic acid production. Fermentation. 2017;3:21. https :// doi.org/10.3390/ferme ntati on302 0021.
12. Zhu Y, Pham TH, Nhiep THN, Vu NMT, Marcellin E, Chakrabortti A, et al. Cyclic‑di‑AMP synthesis by the diadenylate cyclase CdaA is modulated by the peptidoglycan biosynthesis enzyme GlmM in Lactococcus lactis. Mol Microbiol. 2016;99:1015–27.
13. Weber J, Kayser A, Rinas U. Metabolic flux analysis of Escherichia coli in glucose‑limited continuous culture. II. Dynamic response to famine and feast, activation of the methylglyoxal pathway and oscillatory behaviour. Microbiology. 2005;151:707–16.
14. Ackerman RS, Cozzarelli NR, Epstein W. Accumulation of toxic concen‑ trations of methylglyoxal by wild‑type Escherichia coli K‑12. J Bacteriol. 1974;119:357–62.
15. Receptor C, Puskas R, Gazdar C, Peterkofsky A. Methylglyoxal‑mediated growth inhibition in an Escherichia coli protein mutant. Arch Biochem Biophys. 1983;223:503–13.
16. Kadner RJ, Murphy GP, Stephens CM. Two mechanisms for growth inhibi‑ tion by elevated transport of sugar phosphates in Escherichia coli. J Gen Microbiol. 1992;138:2007–14.
17. Cooper RA, Anderson A. The formation and catabolism of methyglyoxal during glycolisis in Escherichia coli. FEBS Lett. 1970;11:273–6.
18. Marcellin E, Nielsen LK. Advances in analytical tools for high throughput strain engineering. Curr Opin Biotechnol. 2018;54:33–40.
19. Goswami V, Srivastava AK. Fed‑batch propionic acid production by Propi-onibacterium acidipropionici. Biochem Eng J. 2000;4:121–8.
20. Luna‑Flores CH, Ramírez‑Cordova JJ, Pelayo‑Ortiz C, Femat R, Herrera‑ López EJ. Batch and fed‑batch modeling of carotenoids production by Xanthophyllomyces dendrorhous using Yucca filifera date juice as substrate. Biochem Eng J. 2010;53:131–6.
21. Schmidt H, Jirstrand M. Systems Biology Toolbox for MATLAB: a com‑ putational platform for research in systems biology. Bioinformatics. 2006;22:514–5.
22. Hall BG, Acar H, Nandipati A, Barlow M. Growth rates made easy. Mol Biol Evol. 2014;31:232–8.
23. Guan N, Liu L, Shin H‑D, Chen RR, Zhang J, Li J, et al. Systems‑level under‑ standing of how Propionibacterium acidipropionici respond to propionic acid stress at the microenvironment levels: mechanism and application. J Biotechnol. 2013;167:56–63.
•fast, convenient online submission •
thorough peer review by experienced researchers in your field • rapid publication on acceptance
• support for research data, including large and complex data types •
gold Open Access which fosters wider collaboration and increased citations maximum visibility for your research: over 100M website views per year •
At BMC, research is always in progress.
Learn more biomedcentral.com/submissions
Ready to submit your research? Choose BMC and benefit from: 25. Aziz RK, Bartels D, Best AA, DeJongh M, Disz T, Edwards RA, et al. The RAST
server: rapid annotations using subsystems technology. BMC Genomics. 2008;9:75.
26. Devoid S, Overbeek R, DeJongh M, Vonstein V, Best AA, Henry C. Auto‑ mated genome annotation and metabolic model reconstruction in the SEED and Model SEED. Methods Mol Biol. 2013;985:17–45.
27. Auch AF, Klenk HP, Göker M. Standard operating procedure for calculating genome‑to‑genome distances based on high‑scoring segment pairs. Stand Genomic Sci. 2010;2:142–8.
28. Darling ACE, Mau B, Blattner FR, Perna NT. Mauve: multiple alignment of conserved genomic sequence with rearrangements. Genome Res. 2004;14:1394–403.
29. Tatusova TA, Madden TL. BLAST 2 sequences, a new tool for comparing protein and nucleotide sequences. FEMS Microbiol Lett. 1999;174:247–50. 30. Licona‑Cassani C, Steen JA, Zaragoza NE, Moonen G, Moutafis G, Hodson
MP, et al. Tetanus toxin production is triggered by the transition from amino acid consumption to peptides. Anaerobe. 2016. https ://doi. org/10.1016/j.anaer obe.2016.07.006.
31. Dietmair S, Hodson MP, Quek LE, Timmins NE, Chrysanthopoulos P, Jacob SS, et al. Metabolite profiling of CHO cells with different growth charac‑ teristics. Biotechnol Bioeng. 2012;109:1404–14.
32. Licona‑Cassani C, Marcellin E, Quek LE, Jacob S, Nielsen LK. Reconstruc‑ tion of the Saccharopolyspora erythraea genome‑scale model and its use for enhancing erythromycin production. Antonie Van Leeuwenhoek. 2012;102:493–502.
33. Marcellin E, Nielsen LK, Abeydeera P, Krömer JO. Quantitative analysis of intracellular sugar phosphates and sugar nucleotides in encapsulated streptococci using HPAEC‑PAD. Biotechnol J. 2009;4:58–63.
34. De Livera AM, Dias DA, De Souza D, Rupasinghe T, Pyke J, Tull D, et al. Normalizing and integrating metabolomics data. Anal Chem. 2012;84:10768–76.
35. Marcellin E, Mercer TR, Licona‑Cassani C, Palfreyman RW, Dinger ME, Steen JA, et al. Saccharopolyspora erythraea’s genome is organised in high‑order transcriptional regions mediated by targeted degra‑ dation at the metabolic switch. BMC Genomics. 2013. https ://doi. org/10.1186/1471‑2164‑14‑15.
36. Luna‑Flores CH, Nielsen LK, Marcellin E. Genome sequence of Propioni-bacterium acidipropionici ATCC 55737. Genome Announc. 2016. https :// doi.org/10.1128/genom ea.00248 ‑16.
37. Trapnell C, Roberts A, Goff L, Pertea G, Kim D, Kelley DR, et al. Differential gene and transcript expression analysis of RNA‑seq experiments with TopHat and Cufflinks. Nat Protoc. 2012;7:562–78.
38. Dragosits M, Mattanovich D. Adaptive laboratory evolution—principles and applications for biotechnology. Microb Cell Fact. 2013;12:64. https :// doi.org/10.1186/1475‑2859‑12‑64.
39. Biot‑Pelletier D, Martin VJJ. Evolutionary engineering by genome shuf‑ fling. Appl Microbiol Biotechnol. 2014;98:3877–87.
40. Zheng DQ, Chen J, Zhang K, Gao KH, Li O, Wang PM, et al. Genomic structural variations contribute to trait improvement during whole‑ genome shuffling of yeast. Appl Microbiol Biotechnol. 2013. https ://doi. org/10.1007/s0025 3‑013‑5423‑7.
41. Park Y‑K, Bearson B, Bang SH, Bang IS, Foster JW. Internal pH crisis, lysine decarboxylase and the acid tolerance response of Salmonella typhimu-rium. Mol Microbiol. 1996;20:605–11.
42. Merrell DS, Camilli A. Acid tolerance of gastrointestinal pathogens. Curr Opin Microbiol. 2002;5:51–5.
43. Merrell DS, Camilli A. The cadA gene of Vibrio cholerae is induced during infection and plays a role in acid tolerance. Mol Microbiol. 1999;34:836–49.
44. Utrilla J, Licona‑Cassani C, Marcellin E, Gosset G, Nielsen LK, Mar‑ tinez A. Engineering and adaptive evolution of Escherichia coli for d‑lactate fermentation reveals GatC as a xylose transporter. Metab Eng. 2012;14:469–76.
45. Gosset G. Improvement of Escherichia coli production strains by modifica‑ tion of the phosphoenolpyruvate:sugar phosphotransferase system. Microb Cell Fact. 2005. https ://doi.org/10.1186/1475‑2859‑4‑14. 46. Peggs D, Boyce S, Luquin MR, Sambrook MA, Biology S. Repression and
derepression of cytochrome c biosynthesis in Escherichia coli. Biochim Biophys Acta. 1963;70:170–2.
47. Liu M‑C, Peck HD Jr., Abou‑Jaoude A, Chippaux M, LeGall J. A reappraisal of the role of the low potential c‑type cytochrome (cytochrome c‑552) in nadh‑dependent nitrite reduction and its relationship with a co‑purified nadh oxidase in Escherichia coli k‑12. FEMS Microbiol Lett. 1981;53:333–7. 48. Ogata M, Arihara K, Yagi T. D‑lactate dehydrogenase of Desulfovibrio
vulgaris. J Biochem. 1981;89:1423–31.
49. Yoshimura T, Matsushima A, Aki K, Kakiuchi K. Formation of a com‑ plex between yeast l‑lactate dehydrogenase (cytochrome b2) and cytochrome c. Biochim Biophys Acta. 1977;492:331–9.
50. Ingledew WJ, Poole RK. The respiratory chains of Escherichia coli. Microbiol Rev. 1984;48:222–71.