Issues
ISSN: 2146-4138
available at http: www.econjournals.com
International Journal of Economics and Financial Issues, 2018, 8(2), 298-303.
Impact of Capital Structure on Performance of Commercial
Banks in Nigeria
E. Chuke Nwude
1*, Kenneth Chikezie Anyalechi
21Department of Banking and Finance, Faculty of Business Administration, University of Nigeria, Nsukka, Enugu Campus.
Nigeria, 2Department of Banking and Finance, Faculty of Business Administration, University of Nigeria, Nsukka, Enugu Campus, Enugu State, Nigeria. *Email: chuke.nwude@unn.edu.ng
ABSTRACT
The study evaluated the influence of financing mix on the performance of commercial banks, and the causal link between debt-equity ratio. Data collated were analyzed using correlation analysis, pooled OLS regression analysis, fixed effect panel analysis, random effect panel analysis, granger causality analysis, as well as post estimation test such as restricted f-test of heterogeneity and Hausman test. The findings show that while debt finance exert negative and significant impact on return on asset, the debt-equity ratio has positive and significant influence on return on equity. There was neither
unidirectional nor bidirectional relationship between capital structure and performance of commercial banks in Nigeria. Keywords: Capital Structure, Commercial Banks, Nigeria
JEL Classifications: G21, G3, G32
1. INTRODUCTION
As pointed out by Pandey (2001) capital structure is a significant managerial decision because it influences the shareholder’s return, risk and the market value of the firms’ share. In his assertion
he also pointed out that in making capital structure decisions
corporate managers are expected to seek answer to question like, how does the proposed financing mix affects the shareholders’ risk, return and value? Performance of a firm on the other hand, has to do with how effectively and efficiently it is able to achieve the set goals which may be financial or operational. The financial performance of a firm relates to its motive to maximize profit both to shareholders and on assets (Kester, 1986) while the operational performance concerns with growth and expansions in relations to sales and market value (Hofer and Sandberg, 1987). Aftab et al. (2012)assert that a firm’s performance can be measured in terms of its profitability and market performance. Typically, profitability is
measured in terms of return on the capital invested in the business or return on the revenues generated during a given period. On the other hand, market performance is measured in terms of market indicators such as share price and dividend yield ratio. Barbosa and
Louri (2005) posit that the assessment of financial performance is
based on the return on investment, residual income, earnings per share, dividend yield, price/earnings ratio, growth in sales, market capitalization, among others.
Nigerian financial sector had experienced myriad of reforms in
the last two decades owing to the general state of the sector which
calls for exigent institutional restructuring. In the past decades the
observed trend of performance of commercial banks in Nigeria has not been encouraging as can be seen from series of abnormalities
and signs of stagnation in the banking sector in the 1990s which as a result the Apex bank (Central bank of Nigeria) had to revoke
licenses of 31 banks between 1994 and 1998 for reasons including
inadequate capitalization, insider dealings and debt overhang (Sev et al., 2014).
However the lingering problem of inability of Nigerian commercial
banks management to decide on the appropriate finance mix that
can gear the desired performance has hither-to called for great deal of attention and debate among scholars. Albeit most of the studies on the subject of capital structure in Nigeria concentrated majorly on investigating the determinants of capital structure,
performance of Nigerian commercial banks employed technique
of multiple regression analysis and/or pooled OLS regression analysis. Previous empirical studies have always ignored such heterogeneous factors like corporate governance, decision making
process, culture, etc., that may exist amongst commercial banks in Nigeria. It is against this backdrop that this study is aimed at filling the gap in the field of capital structure as it relates to performance of commercial banks by incorporating both fixed effect and random effect model to account for their cross sectional uniqueness.
The broad objective of the study is to investigate the impact of capital structure on performance of commercial banks in Nigeria.
The specific objectives are to determine the influence of (1) equity financing, (2) debt financing on performance of commercial banks, and (3) to investigate the causal link between debt-equity ratio and
performance of commercial banks. The apriori assumptions are
that neither equity nor debt financing has positive and significant influence on commercial banks’ performance. Also there is no causal relationship between debt-equity ratio and performance
of commercial banks.
2.
LITERATUTE REVIEW 2.1. Conceptual FrameworkCapital structure in financial term means the way a firm finances their assets through the combination of equity, debt, or hybrid securities (Saad, 2010). Determinants of capital structure include firm’s size, asset structure, profitability, growth prospects, tax rates, industrial classification as agreed by Titman and Wessels (1988), Harris and Raviv (1991), Bauer (2004), (Marsh, 1982), Myers (1977),MacKie-Mason (1990), Pesando and Shum (1999) and Graham’ (1999), Hsia (1981),Huang and Song (2002), Kale et al. (1991), Harris and Raviv (1991). (Marsh, 1982) and Myers (1977) submit that firms with high future growth opportunities should use more equity in their financing because a higher leveraged company is likely to pass up more profitable
investment opportunities. Titman and Wessels (1988), Harris and Raviv (1991) state that the degree to which assets of a firm are tangible should result to greater liquidation value for the firm .
Kale et al. (1991) submit that the risk of bankruptcy is said to be among others, a major determinant of firm’s capital structure. Firm’s volatility is taken as a probability of its bankruptcy (Bauer, 2004) and therefore a proxy for firm’s risk. Bauer (2004) states that from the agency cost theory view point, firms with a more profit should have higher leverage for income they shield from taxes. It holds the view that more profit firms should make use of
more debts purposely to serve as a disciplinary measure for the
managers. A company having a, higher tax is to use more of debt
and therefore to employ more of leverage because of more income
it shields from taxes. There are many empirical studies conducted that explored the impact of taxes on the firm’s financing policies
mostly on, the industrialized countries with most focusing on the
policy of tax such as MacKie-Mason (1990), Pesando and Shum (1999) and Graham’ (1999). Mackie-Mason (1990) as stated by Mackie-Mason (1990) concludes that changes-in the marginal tax rate for any firm should affect its choices between equity and debt. The industry to which a firm belongs is said to be significantly
related to its, debt ratio. Some classes of industry are reported to
have low leverage such as drugs, instruments, electronics, and food
industries while paper, textile mill, products, steel, airlines, and cement industries have large leverage (Harris and Raviv, 1991).
The concept of performance is a controversial issue in the finance
strategy of most corporate organizations due to its multidimensional
meanings (Tian and Zeitun 2007). Performance measure could be in form of financial or operational performances such as maximizing profit on assets, profit maximization, and maximizing shareholders’ benefits. These are at the core of the firm’s effectiveness (Kester, 1986). Operational performance such as growth in sales and growth in market share etc., provide a broad definition of performance
as they focus on the factors that ultimately lead tofinancial performance (Hofer and Sandberg, 1987). From the foregoing, capital structure is largely represented by debt, equity and debt-equity ratio while organizational performance is largely evidenced by the firm’s profitability (return on the capital invested).
2.2. Theoretical Framework
Modigliani and Miller (1958) propounded a theory which states that the market value of a firm is determined by its earning power
and the risk of its underlying assets is independent of the way it
chooses to finance its investment or distribute dividends. In clear term the theory posited that a firm’s total market value is independent of its capital structure. The M and M proposition is based on the assumptions that financial markets are perfect where individuals and firms are price-takers, frictionless, no transaction costs, all agents are rational, all agents have the same information, a firm’s cash flows do not depend on its financial policy (or bankruptcy costs) and no taxes. Albeit in the real world, there are taxes, transaction costs,
and bankruptcy costs, differences in borrowing costs, information asymmetries and effects of debt on earnings. Therefore to understand
how the M and M proposition works after factoring in corporate taxes, many scholars had queried the M-M proposition.
The trade-off theory assumes that there are benefits to leverage
within a capital structure up until the optimal capital structure
is reached. The theory recognizes the tax benefit from interest payments - that is because interest paid on debt is tax deductible, while issuing bonds effectively reduces a company’s tax liability.
The theory emphasized that as the proportion of debt in the
company’s capital structure increases, its return on equity to shareholders increases in a linear fashion. The existence of
higher debt levels makes investing in the company more risky,
so shareholders demand a higher risk premium on the company’s
stock. The theory refers to the idea that a company chooses
how much debt finance and how much equity finance to use by balancing the costs and benefits. It identifies the benefit of financing with debt, the tax benefit of debt, as well as a cost of financing with debt, financial distress including bankruptcy costs
of debt. The static trade off theory of capital structure predicts that
firms will choose their mix of debt and equity financing to balance the cost and benefits of debt. It should however be realized that a
company cannot continuously minimize its overall cost of capital by employing debt. Therefore it would not be advantageous to
employ debt further, so there is a combination of debt and equity which minimizes the firm’s average cost of capital and maximizes
Pecking order theory was first suggested by Donaldson (1961) and was modified by Myers and Majluf (1984). It states that companies prioritize their sources of financing according to the cost of financing, preferring to raise equity as a financing means of last resort. Pecking order model postulated that the cost of financing
increases with asymmetric information. This theory maintains that
businesses adhere to a hierarchy of financing sources and prefer internal financing when available, and debt is preferred over equity if external financing is required (equity would mean issuing shares which meant “bringing external ownership” into the company).
Agency costs theory illustrates that firm’s capital structure is
determined by agency costs, which includes the costs for both debt
and equity issue. The costs related to equity issue may include: (1) The monitoring expenses of the principal (the equity holders); (2) the bonding expenses of the agent (the manager); (3) reduced welfare for principal due to the divergence of agent’s decisions from those which maximize the welfare of the principal. Besides, debt issue increases the owner-manager’s incentive to invest in
high-risk projects that yield high returns to the owner-manager but increase the likelihood of failure that the debt holders have to share if it is realized. If debt-holders anticipate this a higher
premium will be required, which in turns increase the costs of
debt. Then, the agency costs of debt include the opportunity costs caused by the impact of debt on the investment decisions
of the firm; the monitoring and bond expenditures by both the bondholders and the owner-manager; and the costs associated with bankruptcy and reorganization (Hunsaker, 1999). Since both equity and debt incur agency costs, the optimal debt-equity
ratio involves a trade-off between the two types of cost. Agency
costs arise due to the conflicts of interest between firm’s owners and managers. Jensen and Meckling (1976) introduce two types of conflicts: Conflicts between shareholders and managers; and conflicts between shareholders and bondholders.
2.3. Empirical Review
Chechet and Olayiwola (2014) investigated capital structure and profitability of Nigerian quoted firms using the agency cost theory perspective, with Panel data on a sample of 70 out of the 245 listed firms on the NSE for a period of 10 years 2000-2009. Two independent variables debt ratio (DR) and equity (EQT) were used as surrogates for capital structure while profitability was used as dependent variable. Using fixed-effects, random and Hausman Chi-square estimations the result showed that DR is negatively related with profitability while EQT positively relate to profitability. Based on the findings and conclusions they recommended that for firms’ experiencing agency conflicts and wishing to raise fund for operations or expansions, higher debt ratio should be given priority but the right combination of equity
and debt must be observed.
Oke and Afolabi (2011) discovered positive relationship between firms’ performance and equity financing and debt-equity ratio but negative relationship between performance and debt financing when they investigated capital structure and performance of 5 quoted firms between 1999-2007 using debt financing, equity financing, and debt-equity ratio as surrogates of capital structure, and profitability index as measure of firms’ performance using
panel data regression model. They attributed the result of the study to high cost of borrowing in the country.
3. METHODOLOGY
A sample of 10 out of 23 banks was purposively selected based
on their performance in the stock market. Panel data was sourced
from the financial statement of these 10 selected commercial banks over the 14 year- period, spanning from 2000 to 2013. Two static models were employed in the study in which debt financing, equity financing, and debt-equity ratio stand as measures of capital structure, while return on asset and return on equity were used as
corresponding measures of organizational performance. Dynamic model employed in the study captured capital structure with
debt-equity ratio while organization performance was captured by return on asset. Techniques used in the study included the pooled OLS estimator, fixed effect estimator and random effect estimator analysis. The model was estimated at 5% significant level.
3.1. Model Specification
With reference to the empirical researches cited above, this study specifies two models which helps to capture the influence of capital structure (debt finance [DF], equity finance [EF] and debt-equity ratio) of the selected commercial banks on their performance (return on asset [ROA] and return on equity [ROE]). The granger causality model followed the specification presented in Gujarati and Porter (2009) using the ROA as performance measures and debt-equity ratio as capital structure proxy to test the causality relationship
between capital structure and performance of commercial banks
in Nigeria. These two models are specified in linear from:
ROAit = α0+α1DFit+α2EFit+α3DERit +U1 (1)
ROEit = β0+β1DFit+β2EFit+β3DERit+U2 (2)
1 1
1 1
k k
t i i t j t
j
ROA =
∑
= ρROA− +∑
=θ DER− (3)DERt i DER ROA
k
i t j j t
k
=
∑
=1γ −1+∑
=1 −1ä (4)
Where ROA= return on asset, ROE=return on equity, DF=debt finance, EF=equity finance, DER=debt equity ratio, U=stochastic error term, α0,1,2,3 β0,1,2,3 ñi =1,2,3,…n èj = 1,2,3…n ãi = 1,2,3….n äj = 1,2,3….n are all parameter estimates of the corresponding models.
3.2. Variables Description
Return on assets (ROA) which measures efficiency of the business
in using its assets to generate net income is obtained from the ratio of annual net income to average total assets of a business during a
Debt-to-equity (D/E) ratio is a leverage ratio which measures the degree to which the assets of the business are financed by the debts and the shareholders’ equity of a business is the ratio of total liabilities of a business to its shareholders’ equity.
3.3. Estimation Technique
In an attempt to know the most reliable estimation between the
fixed effect estimation and the random effect estimation, Hausman
test was conducted to test if there is a substantial difference
between the estimates of the fixed effect estimator and that of the
random effect estimator. The null hypothesis underlying the test
is that fixed effect estimates do not differ substantially from the
random effect estimates.
4. DATA PRESENTATION AND ANALYSIS
Fixed effect parameter estimates (time specific) for Model 1 and Model 2 are presented in the Tables 1 and 2.
4.1. Hausman Test
In an attempt to know the most reliable estimation between the
fixed effect estimation and the random effect estimation, Hausman
test was conducted to test if there is a substantial difference
between the estimates of the fixed effect estimator and that of the
random effect estimator. The null hypothesis underlying the test
is that fixed effect estimates do not differ substantially from the
random effect estimates. Notably the test statistics developed by
Hausman has an asymptotic Chi-square distribution as presented
in Table 3.
Table 3 reveals a Chi-square value of 340.23 and 211.05 for Models 1 and 2 alongside probability values of 0.0000 and 0.0048. Thus the Hausman test for the two models report
enough evidence to reject the null hypothesis of no substantial
difference between the fixed effect and random effect estimates,
in favor of the alternative hypothesis that there is a substantial
difference between fixed effect and random effect estimates.
Thus, rejection of the null hypothesis implies that error
component model (random effect estimator) is not appropriate
because the random effects are probably correlated with one or more regressors. Hence the most reliable (most consistent
and efficient) estimator for the study is the fixed effect (one-way effect) estimation presented in Tables 1 and 2 for Models
1 and 2 respectively.
4.2. Interpretation of Results
ROAit = α0+α1DFit+α2EFit+α3DERit+U1 (1)
ROA = 0.09–2.30–2.55–0.00 S.E = (0.02) (1.26) (4.03) (0.00) T-test = (4.99) (–1.82) (–0.63) (–1.06)
ROEit = β0+β1DFit+β2EFit+β3DERit+U2 (2)
ROE = 0.32–9.80–8.46+0.03 S.E = (0.01) (1.26) (4.03) (0.00) T-test = (0.56) (3.72) (1.19) (0.002)
4.3. Discussion of the Findings
The analysis on the impact of capital structure on organizational performance of commercial banks is presented in the Tables 1 and 2. The results obtained from the models indicate that the overall
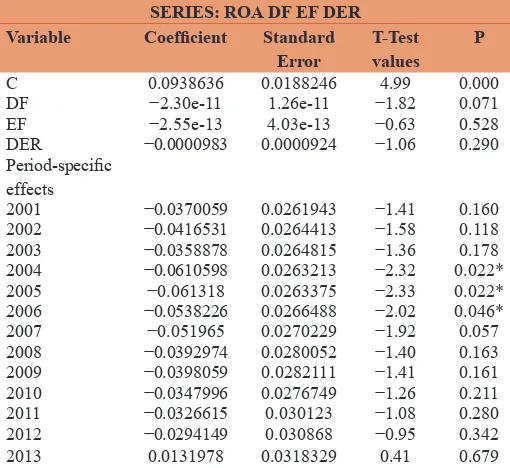
Table 1: Fixed effect parameter estimates (time specific)
Model 1
SERIES: ROA DF EF DER Variable Coefficient Standard
Error T-Test values P C 0.0938636 0.0188246 4.99 0.000
DF −2.30e-11 1.26e-11 −1.82 0.071
EF −2.55e-13 4.03e-13 −0.63 0.528 DER −0.0000983 0.0000924 −1.06 0.290 Period-specific
effects
2001 −0.0370059 0.0261943 −1.41 0.160 2002 −0.0416531 0.0264413 −1.58 0.118 2003 −0.0358878 0.0264815 −1.36 0.178 2004 −0.0610598 0.0263213 −2.32 0.022* 2005 −0.061318 0.0263375 −2.33 0.022* 2006 −0.0538226 0.0266488 −2.02 0.046* 2007 −0.051965 0.0270229 −1.92 0.057 2008 −0.0392974 0.0280052 −1.40 0.163 2009 −0.0398059 0.0282111 −1.41 0.161 2010 −0.0347996 0.0276749 −1.26 0.211 2011 −0.0326615 0.030123 −1.08 0.280 2012 −0.0294149 0.030868 −0.95 0.342 2013 0.0131978 0.0318329 0.41 0.679
Source: Author’s Computation, (2015). R2=0.1481 , F-statistics=1.34, P (F-stat)=0.1862
Table 2: Fixed effect parameter estimates (time specific)
Model 2
SERIES: ROE DF EF DER Variable Coefficient Standard
error ValuesT-Test P C 0.3248618 0.5548247 0.59 0.559
DF −9.80e-10 3.72e-10 −2.64 0.009
EF −8.46e-12 1.19e-11 −0.71 0.477 DER 0.0278484 0.0027233 10.23 0.000 Period-specific
effects
2001 0.0164333 0.7720367 0.02 0.983 2002 −0.427449 0.7793148 −0.55 0.584 2003 −0.1165172 0.7805017 −0.15 0.882 2004 −0.0986387 0.7757792 −0.13 0.899 2005 −0.1344802 0.7762549 −0.17 0.863 2006 −0.230018 0.7854315 −0.29 0.770 2007 −0.1465287 0.7964572 −0.18 0.854 2008 0.7603332 0.8254102 0.92 0.359 2009 0.8207109 0.8314785 0.99 0.326 2010 1.558748 0.8156739 1.91 0.058 2011 0.5359879 0.8878273 0.60 0.547 2012 1.890024 0.9097867 2.08 0.040*
2013 2.418163 0.9382251 2.58 0.011*
R2=0.5047, F-statistics=7.83, P (F-stat)=0.0000
Table 3: Hausman test
Models Chi-square stat Probability
Model 1 340.23 0.0000 Model 2 211.05 0.0048
coefficient of determination (R) shows that the 0.14 for ROA and 0.50 for ROE meaning that 14% and 50% change in the dependent variables (ROA) and (ROE) respectively are caused by the independent variables (DF, EF and DER), which implies that all the included variables can only explain about 14% of the systematic variation in return on asset in Model 1 and 50% variation in return on equity in model.
The result of the first estimated model revealed that debt
financing negatively and significantly influence return on asset of commercial banks in Nigeria (β = −2.27e-11, P = 0.008 ˂0.05), Equity finance exert positive and non-significant influence on return on asset (β = 1.76e13, P = 0.713 ˃0.05) while debt-equity ratio had negative and non-significant influence on return on asset (β = −0.0001804, P = 0.109 ˃0.05). The second estimated model revealed that the impact of debt financing on return on equity is positive and non-significant (β = 1.26e-11, P = 0.960 ˃0.05), equity finance had negative and non-significant impact on return on equity (β = −7.25e-12, P = 0.613 ˃0.05) while debt-equity ratio exert positive and significant influence on return on equity (β = 0.0227248, P = 0.000 ˂0.05). The observed significant impact of debt and debt-equity ratio on organizational performance is in
consonance with the discoveries of researchers including Aftab
et al. (2012), Oke and Afolabi (2011), Velnampy and Niresh (2012) but contradicts the discoveries of Siddiqui and Shoaib (2011), Pratomo and Ismail (2007), Berger and di Patti (2002).
5. SUMMARY OF FINDINGS, CONCLUSION
AND RECOMMENDATION
This paper evaluated the impact of capital structure on
organizational performance using 10 selected commercial banks in Nigeria between 2000 and 2013. The study reveals that debt financing negatively and significantly influence return on asset of commercial banks in Nigeria, Equity finance exert positive and non-significant influence on return on asset, while debt-equity ratio had negative and non-significant influence on return on
asset. The second estimated model revealed that the impact of
debt financing on return on equity is positive and non-significant, equity finance had negative and non-significant impact on return on equity, while debt-equity ratio exert positive and significant influence on return on equity. Stakeholder of commercial banks
should ensure that the optimum capital structure is entrenched to
balance between financial risk and business risk of their operation. To do so debt-equity ratio could be varied at intervals, in other to be able to juxtapose between the capital structures available to
the organization.
Premise on the findings, the study concludes that the impact of
capital structure on organizational performance of commercial
banks in Nigeria largely depends on the level of debt financing
but up to the optimum capital structure. Increase in the capital
structure through use of higher equity-debt ratio has the tendency
to impede the performance of the commercial measured in terms
of return on equity. Secondly, this research has contributed to the
enrichment of literature on funding decision in banks especially for
investors who snub further external financing on fixed rate capital.
Based on the findings and conclusion drawn, the study therefore
recommends that management of commercial banks should ensure that the right optimum capital structure is always engaged
by varying the debt-equity ratio at intervals, in order to enhance the performance of the banks in terms of the ROA and ROE.
Shareholders should be carried along in the process that calls for
extra funding.
REFERENCES
Aftab, M., Ehsan, R., Naseer, S., Awan, T. (2012), The effect of corporate
strategy and capital structure on performance of banking sector of
Pakistan. Global Journal of Management and Business Research, 12(17), 1-13.
Barbosa, N., Louri, H. (2005), Corporate performance: Does ownership matter? a comparison of foreign- and domestic-owned firms in greece and portugal. Review of Industrial Organization, 27(1), 73-102. Bauer, P. (2004), Determinants of capital structure: Empirical evidence
from Czech. Journal of Economics and Finance, 54, 1-21.
Berger, A.N., di Patti, E.B. (2002), Capital Structure and Firm
Performance: A New Approach to Testing Agency Theory and an
Application to the Banking İndustry. Federal Reserve System. Chechet, I., Olayiwola, A.B. (2014), Capital structure and profitability of
Nigeria quoted firms. the agency cost theory perspective. American International Journal of Social Science, 3(1), 139-158.
Donaldson, G. (1961), Corporate Debt Capacity: A Study of Corporate
Debt Policy and The Determinants of Corporate Debt Capacity.
Boston: Harvard University Press Paper No 6012.
Graham, J.R. (1999), Herding among investment newsletters: Theory and evidence. The Journal of Finance, 54(1), 237-268.
Gujarati, D.N., Porter, D.C. (2009), Basic Econometrics. 5th ed. New York: McGraw Hill Inc.
Hsia, C. (1981), Optimal debt of a firm: An option pricing approach. The Journal of Financial Research, 4(3), 221-231.
Harris, M., Raviv, A. (1991), The theory of capital structure. Journal of
Finance, 46, 297-355.
Hatfield, E., Cacioppo, J.T., Rapson, R.L. (1994), Emotional Contagion.
Cambridge, England: Cambridge University Press.
Hofer, S., Sandberg, B. (1987), Capital Structure paradigm. Journal of science Academy, 8(1),15-19.
Huang, S.G.H., Song, F.M. (2002), The Determinants of Capital Structure:
Evidence from China. A Paper delivered at Economics and Finance
Workshop Held at the University of Hong Kong, at the Conference on China and World in the 21st Century Held at Hong Kong Baptist
University, and at the 14th Association for Chinese Economic Studies
(ACES) Annual Conference Held at the University of Sydney. Hunsaker, J. (1999), The role of debt and bankruptcy statutes in facilitating
tacit collusion. Managerial and Decision Economics, 20, 9-24. Jensen, M.C., Meckling, W.H. (1976), Theory of the firm: Managerial
behavior, agency costs and ownership structure. Journal of Financial
Economics, 3(4), 305-360.
Kale, P., Singh, H., Perlmutter, H. (2000), Learning and protection of
proprietary assets in strategic alliances: Building relational capital.
Strategic Management Journal, 21, 217-237.
Kester, C.W. (1986), Capital and ownership structure: A comparison of
United States and Japanese manufacturing corporations. Finance
Manager, 15, 5-16.
Mackie-Mason, J.K. (1990), Do taxes affect corporate financing decisions? The Journal of Finance, 45(5), 1471-1493.
Marsh, P.(1982), The choice between equity and debt: An empirical study.
Journal of Finance, 37, 121-144.
finance and the theory of investment. The American Economic Review, 48(3), 261-297.
Myers, S.C. (1977), Determinants of corporate borrowing. Journal of Financial Economics, 5, 147-175.
Myers, S.C., Majluf, N.S. (1984), Corporate financing and investment decisions when firms have information that investors do not have. Journal of Financial Economics, 13(2), 187-221.
Oke, O.O., Afolabi, B. (2011), Capital structure and industrial performance in Nigeria (1999-2007). İnternational Business and Management, 2(1), 100-106.
Pandey, M. (2001), Capital Structure and the Firm Characteristics: Evidence from an Emerging Market, Working Paper. Ahmedabad: Indian Institute of Management.
Pesando, J.E., Shum, P.M. (1999), The returns to Picasso’s prints and to traditional financial assets, 1977 to 1996 Journal of Cultural Economics, 23(3), 181-190.
Pratomo, W.A., Ismail, A.G. (2007), Islamic Bank Performance and
Capital Structure. Available from: https://www.researchgate.net/ publication/24114734.
Saad, N.M. (2010), Corporate governance compliance and the effect to
capital structure. International Journal of Economics and Financial,
2(1), 105-114.
Sev, J.T., Utor, V., Kwanum, I. (2014), Achieving Organizational Goals Through Successful Strategic Change İmplementation in Business Organizations: A Survey of Selected Banking firms in Nigeria, West Africa. Vol. 4. International Conference on Business and Economic Development (ICBED), New York-USA: The Business and Management Review.
Siddiqui, M.A., Shoaib, A. (2011), Measuring performance through capital
structure: Evidence from banking sector of Pakistan. African Journal
of Business Management, 5(5), 1871-1879. Available from: http:// www.academicjournals.org/AJBM.
Tian, C.G., Zeitun, R. (2007), Capital structure and corporate performance:
Evidence from Jordan. Accounting, Business and Finance Journal,
1, 40-53.
Titman, S., Wessels, R. (1988), The determinants of capital structure
choice. Journal of Finance, 43, 1-19.