Effects of robot for teaching geometry to
fourth graders
Sughee Kima, Chulhyun Leeb
Corresponding author: [email protected]
aCreative informatics & computing institute, University of Korea, Seoul, Korea bGyeongin National University of Education, Anyang, Korea
Abstract
The results of the TIMSS 2007 (International Association for the Evaluation of Educational Achievement, 2008) show that in comparison with their academic achievement in mathematics, South Korean students’ interest and efficacy in and self-concept in relation to the discipline rank relatively low. In the effort to help address this issue, this study investigated the effects of the implementation of robots in an elementary-level Korean math class, examining student cognitive and affective domains before, immediately after, and three months after treatment. The participants in this study were 121 fourth graders (11 to 12 years old) who randomly selected from four classes, and then randomly assigned to either the “Robot” group (58 children) or the “Ruler & Protractor” group (63 children). The findings from this study were that concerning student achievement in the cognitive domain, no statistically significant result was found. As for the affective domain, after treatment, the Robot group’s levels of interest and curiosity toward mathematics and participation in their mathematics class were statistically higher than those of the Ruler & Protractor group. This remained true at the delayed posttest. A correlation analysis between achievements in cognitive domain, results of the observation test during class, and results of the self-assessment test in affective domain showed that in the case of the Ruler & Protractor group, their instruction in mathematics class only contributed to cognitive domain. However, in the case of the Robot group, treatment contributed to both cognitive and affective domains. In conclusion, robots have potential to replace traditional ruler and protractor use in geometry education from the perspective of their effects on cognitive and affective domains.
Keywords: Educational Robot, Teaching Geometry, Elementary school, STEM education
International Journal of Innovation in Science and Mathematics Education, 24(2), 52-70, 2016.
Introduction
The results of the TIMSS (Trends in International Mathematics and Science Study; International Association for the Evaluation of Educational Achievement, 2008) show that while South Korean students ranked second of 50 countries in mathematical achievement, their interest, self-concept, and efficacy in relation to mathematics were 43rd. According to the statistics (National Youth Policy Institute of Korea, 2007), the main drivers of the high achievement of Korean students are the desire to meet university admission requirements, teaching by rote, and parental concern about their children’s grades.
The emphasis on mathematics and science education for K-12 students is not limited to Korea; in the United States, the America Competes Act of 2007, passed to foster innovation in mathematics and science education, authorizing the investment of $37 billion in improving student performance on standardized tests in math and science. Similarly, the governments of the United Kingdom, Finland, Israel, and Japan, among other countries, are continuing efforts in reform of math and science education to help maintain national competitiveness.
research skills, creative thinking, decision making, problem solving, communication and team working skills, all of them being essential skills necessary in the workplace of the 21st century (Eguchi, 2010; Benitti, 2012).
According to Skemp (1979), learners do not understand higher-level mathematical concepts than those they already possess by learning their definitions alone. The only way for learners to understand high-level concepts is for them to experience an appropriate set of examples and non-examples. He explains that the concepts of mathematics, for their formation, require a number of experiences, or examples, that have something in common and those experiences include consideration of noise, which is conspicuous attributes of the examples that are not essential.
For example, the teacher should center learner attention on examples and non-examples and should encourage interest and curiosity (so as not to generate monotony and boredom). Additionally, learning acquired through examples and non-examples is retained longer and transfers more easily to other domains (Skemp, 1986). For enhanced concept formation, examples and non-examples should be readily comprehensible to students and should excite their curiosity. In addition, learning materials used should be well planned, fresh, and challenging. According to Skemp, students can form a concrete notion by being simultaneously presented with examples and non-examples and by finding their own examples through their understanding of the systemic nature of mathematics and of the concepts under study.
Thus, the purpose of this study is to investigate the effects of using a robot to implement Skemp’s teaching strategy on fourth-grade students’ understanding of quadrangles and polygons. More specifically, the research questions that guided the study were as follows: (1) What is the effect of teaching using robots together with Skemp’s learning theory on fourth-grade student achievement in and acquisition and retention of understanding of quadrangles and polygons compared to that of teaching with a traditional ruler and protractor? (2) What is the effect of using robots with Skemp’s learning theory on fourth-grade student attitudes to mathematics compared to teaching with the ruler and protractor, and how long does this effect last? (3) What is the effect of using robots with Skemp’s learning theory on fourth-grade student performance in math class compared to that under the ruler and protractor condition? (4) What is the relationship between achievements in and understanding of quadrangles and polygons on the one hand and attitudes toward math using robots with Skemp’s learning theory in fourth-grade students compared to that through the ruler and protractor?
Theoretical Framework
This chapter describes the theoretical framework for this study. The first part of this chapter explain geometry education for fourth-grade level students. Second part of this chapter describe Digital Tools for Geometry education. Third part of this chapter explain integrative approach for mathematics education. Last part of this chapter describe the research of education with robots.
Geometry Education
diagonals are congruent and perpendicular, and they bisect each other.” The properties of the shape have become more important than its appearance. Children can discuss the properties of the basic figures and recognize them by these properties but generally will not allow categories to overlap, because they understand each property in isolation from the others. For example, they will still insist that “a square is not a rectangle.”
Many studies report that student performance in geometry is severely lacking and that students have numerous misconceptions regarding even the most basic concepts of geometry (e.g., Battista, 2007; Clement & Battista, 1989, 1992). Examples might include “a square is not a square if its base is not horizontal” or “the length of two straight lines is not equal if their endpoints are not parallel.” Numerous studies present evidence that the existence of “prototypical examples” as concept images is one of the main reasons for these misconceptions. For instance, Wilson (1983) reports that the student choice of examples was based more on common prototypes than their own definitions of concepts.
Other studies (e.g., Hershkowitz, 1989; Hoffer, 1983; Prevost, 1985) also has been showed that in large percent of cases judgment of student based on common prototype. Hoffer (1983) found that students often could not identify a right-angled trapezoid as a trapezoid, since it did not look like a prototypical trapezoid. Meanwhile, Prevost (1985) reported that most seventh- and eighth-grade junior high school students were unable to identify any feature in common among rectangles, squares, and trapezoids, even though all the students could parrot the definitions they had learned at school. Furthermore, Hershkowitz (1989) found that students do not consider squares to be quadrilaterals because they have four equal sides while other quadrilaterals do not.
Digital Tools for Geometry education
To address these difficulties in geometry education, software environments such as MicroWorlds (Noss & Hoyles, 1996; Clements, 2001; Sinclair, 2015) and Dynamic Geometry System (Arcavi & Haddas, 2000; Mariotti, 2013; Kynigos, 2015) have been considered. Many scholars have studied the effects of MicroWorlds and DGS or precursor concepts on learning (Healy & Hoyles, 2001; Mariotti, 2001; Laborde, 2001; Moyer-Packenham, 2013). The MicroWorlds environment, based on a programming language that allows students to construct and reconstruct the environment’s elements, came into wide use in schools from the 1980s (Hoyles & Noss, 1996).
feedback, and debug functions for conflict situations such as psychological connections between symbolic code and graphical output. In addition, teachers should organize student activities along the lines of group discussion and the sharing of each student’s thinking, small group activities, etc. (Abelson & diSessa, 1980; Edwards, 1995; Noss & Hoyles, 1996; Wilensky, 1993). However, some scholars have expressed reservations about the use of MicroWorlds in math education. Hoyles & Noss warn that there are clear limitations to text-based interaction, not least the fact that textual literacy is a prerequisite. Considering teachers should provide group discussion and the sharing of each student’s thinking, small group activities when using Microworld, this research is distinguished since teacher do not have to provide those activities when using robot.
Besides MicroWorlds, the DGS has become an increasingly common classroom tool to support the teaching and learning of plane geometry. DGS provides a setting in which students can construct and experiment with geometrical objects and relationships. The key to DGS is an interface that allows direct manipulation of geometrical figures, usually by dragging their components with the mouse.
However, over time, studies of student use of with DGS have begun to raise issues of constraints and student difficulty with interpretation and construction. To address these problems, some studies have shown that an appropriate guide to learning activities and a guiding role by the teacher are needed to attain learning goals (Jones, 2001; Healy & Hoyles, 2001; Mariotti, 2001; Laborde, 2001).
As reviewed above, an approach to geometry education at school based on digital technologies such as MicroWorlds and DSG requires that these digital technologies be accompanied by a well-designed teaching and learning strategy and appropriate guidance to students. However, few of these studies have considered the effect of these tools on the affective as opposed to the cognitive domain of mathematics education.
According to Bloom (1956), the cognitive domain involves knowledge and the development of intellectual skills. The affective domain includes the manner in which we deal with things emotionally, such as feelings, values, appreciation, enthusiasms, motivations, and attitudes. This suggests that studies on how best to foster growth in the affective domain of mathematics education using new media as a learning tool are needed.
STEM (Science, Technology, Engineering, and Mathematics) education
As mentioned above, a worldwide movement to reform mathematics education has emerged in many nations, predominantly the US, where the National Science Foundation (NSF) adopts the concept of STEM education. Sanders (2009) gives the fundamental rationale for integrative STEM education: “The basic point is that the ideas and practice of science, mathematics, and technology are so closely intertwined that we do not see how education in any one of them can be undertaken well in isolation from the others.” This implies that an integrative strategy for mathematics education is required.
Robotics for education
As can be seen, STEM education seeks solutions to the existing problems of mathematics education not in the cognitive domain but in the affective domain, with the implication that priority should be given to this domain in real-life math education.
There is no doubt that many children and adults find robots fascinating, being familiar to students in their everyday lives, since they have spread into the home (Johnson, 2003). It has long been recognized that experiential, hands-on education provides superior motivation to learn new material, by giving real-world meaning to abstract knowledge (Stohr-Hunt,1996; Johnson, 1997) . Robotics has been known to be a superb tool for hands-on learning, of not only robotics itself but also general topics in STEM (Mataric, 2004).
Moreover, robots offer the opportunity for creative expression and problem solving as part of a constructionist learning approach (Resnick, 2000; Mauch, 2001; Bers, 2002). Rogers states that the sometimes tedious subject matter in mathematics can be more compellingly presented using the novelty and kinesthetic nature of the robot. Nevertheless, Williams, Ma, Prejean, Lai, and Ford (2007) affirm that there is limited empirical evidence to prove the impact of robotics in the K–12 curriculum.
By Bobis (2011), Variety in Teaching resources promote motivation and engagement at mathematics class. Such resources include multimedia, computer software, concrete manuplatives, model, simulations and experiment apparatus, calculators, and data loggers, newspapers, excursions, and outdoor activates. So robots can stimulate student’s motivation and engagement at mathematic class.
Benitti (2011) reports that most previous applications of robotics technology in education have focused on supporting the teaching of subjects that are closely related to the robotics field, such as robot programming, robot construction, and mechatronics.
This suggests that studies on robots as education tools to stimulate student interest and motivation to learn are still needed in other fields. Thus, some studies have suggested that using robot enhance motivation and interest of mathematics. Oritiz (2015) shows that when learning ration and proportion with LEGO Robot, Robot group’s level of motivation and interest toward mathematics were statistically higher than those of control group.
To resolve existing problems, specifically the lack of interest in and motivation to excel in mathematics and the reluctance of many students in Korea to enter schools of natural sciences or engineering (Korea Education Development Institute, 2009), we studied robots as education tools in mathematics using a teaching-learning strategy to foster reflexive abstraction. Given the problems mentioned, we decided to investigate whether the cognitive and affective abilities of students developed differently with as opposed to without the use of robots.
Method
Research design
mathematics between two groups: the Robot group and the Ruler & Protractor group. The two groups took 10 geometry lessons from the same teachers.
The only difference was that the Robot group used robots to develop their examples and non-examples while the Ruler & Protractor group used the traditional ruler and protractor. The independent variable is the learning tool; dependent variables are learning achievement (cognitive domain), learning performance during class, and student self-assessment (affective domain).
Participants
The participants in this study were 119 fourth graders (11 to 12 years old) attending a public elementary school in an urban district in South Korea. The students were randomly selected from four classes and then randomly assigned to either the Robot group (58 children) or the Ruler & Protractor group (63 children). Both groups participated in 10 geometry lessons. At the start of the study, the number of participating students in the Robot group was only one less than that in the Ruler Protractor group (Robot: 62, Ruler & Protractor: 63).
However, during the course of the study (four months), absenteeism resulted in a disparity in numbers between the two groups. Four different teachers with between 8 and 25 years of experience taught mathematics to the four classes.
Instrument
we develop the two kinds of test which are achievement test and The natural observation test. An achievement test was developed to measure student achievement in understanding quadrangles and polygons based on the teaching guidebooks specified for mathematics teachers by the South Korean curriculum. The test involved 20 items, including eight problems involving the drawing of quadrangles and polygons and 12 explaining the concepts of quadrangles and polygons.
The test was prepared by the researchers and checked by four mathematics teachers at the school, as well as the expert who wrote the government designated mathematics textbook. The test was designed to measure the following student objectives: (1) understanding the definition of a perpendicular line and a parallel line, and drawing and constructing perpendicular and parallel lines; (2) explaining the distance between parallel lines and drawing the distance by definition between parallel lines; (3) understanding the definition of a polygon and drawing polygons; (4) distinguishing among polygons; and (5) understanding the relationships of inclusion between polygons. Ten of the items related to objectives (1) and (2), while the remaining 10 tested (3), (4), and (5). Appendix C show sample items used in the achievement test.
The natural observation test used was designed to measure student levels of participation, immersion and performance during class. Forced-choice checklists were used to assess performance during class before the beginning of the treatment. The evaluation was performed on two domains: learning attitude and learning outcome. Leaning attitude was scored by the student’s level of class participation: a very active attitude was scored as 4, an active attitude as 3, a normal attitude as 2, and a poor attitude as 1. Learning outcome was scored by student’s degree of attainment of learning objectives at that point: excellent as 4, good as 3, normal as 2, and bad as 1. The test was administered to each group by the same two teachers that had observed them.
The treatment took place over 10 hours of class for each group. Cronbach’s alphas for Teacher A’s observations ranged from 0.901 to 0.907 for the Robot and Ruler & Protractor groups respectively, and for Teacher B, from 0.881 to 0.902. To evaluate interobserver reliability, we calculated Pearson correlation coefficients for learning attitude and performance during class. Those values were 0.735 and 0.659.
Assessment of the affective domain in mathematics education is intended to measure student attention to, interest in, motivation toward, and self-confidence in mathematics. A positive attitude and improvement-fostering values play important roles in learning mathematics and vitalizing learning activity, with the ultimate goal of helping students achieve outstanding performance (Korean National Curriculum Guidebook [MOE, 2010]).
According to Kenney and Siver (1983), the affective domain of mathematics consists of interest and curiosity, self-confidence, anxiety, awareness of usefulness, creative mathematical thinking, and participation in mathematics class. In our study, based on Kenney and Siver (1983) and the Korean national mathematics curriculum, we developed the self-assessment test (affective domain) (See Appendix D). This test involved 28 items with seven subdomains, using a Likert-type scale. Each item has a 1 to 5 response scale. A post-test of affective domain results yielded a Cronbach’s alpha coefficient of 0.858.
Procedures
Both the Robot group and the Ruler & Protractor group were given 10 hours treatment each and underwent pre-, post-, and delayed post-tests of the cognitive and affective domains. Moreover, during class, teacher-observers evaluate the students’ levels of performance and participation in class. Through the delayed post-test, we investigated whether the effects of the robot treatment persisted.
A natural observation during class was performed for 40 hours in each group by the same teacher-observers, who had no previous connection with this study. The observation teachers did not assist the students but merely observed and evaluated them. Both groups were taught by the same teacher, who was one of the authors. The experiment lasted three weeks and was carried out simultaneously in both groups.
create examples and non-examples) and learn the key concepts of geometry from the examples and non-examples.
Treatments for the Ruler & Protractor group and for the Robot group Treatment for the Ruler & Protractor group
The South Korean government modified its official elementary math curriculum in 2009. The revised curriculum focuses on helping students grasp mathematical concepts on the basis of their observation and manipulation of real life. The official math education guidebook for teachers instructs them to let students use rulers and protractors to learn the concepts of geometry.
Appendix E shows a scene where students in the present study’s Ruler & Protractor group do an activity developing examples and non-examples. In each geometry lesson, first, teachers let students find real-life examples related to the concepts of geometry. For examples, the teacher may let students present an object that features parallel lines to the class. As many students as possible should be allowed to contribute by finding examples of these concepts.
Next, figure definitions should be presented and read aloud together. Students presenting their individual opinions should be allowed to observe and verbally identify the properties of the figures. In this activity, students investigated the properties of the figures using rulers and protractors handed out before class. Students conducted their activity individually, solving problems in the textbook, matching figure with their definitions and properties.
In the next stage, students paired off to do an activity using Skemp’s examples and non-examples. Each student spent 10 minutes drawing figures with a ruler and protractor and let his or her peers take turns finding and noting examples and non-examples. Next, each student reported the number of examples and non-examples he or she had found, and the teacher verified the student’s correctness, letting the student know whether they were learning concepts correctly.
Treatment for the Robot group
The Robot group was taught in the same classroom as the Ruler & Protractor group. In all, 18 robots were prepared by the researchers for the experiment; 16 were used in class and two held in reserve. The robots were assembled as shown in Appendix F, in various shapes. Students let the robots be equipped with pens for drawing. The students drew figures on their desks, which were covered with transparent vinyl. The robots were designed to also imitate the function of a ruler. Students of the robot group were expected to construct figures by drawing their outlines, and so the robots were designed to draw lines in various ways.
The researchers developed a program for the robots to function as shown in Appendix G. The robots had various shapes and carried holders in which students could place pens. Before the experiment, the Robot group was divided into two classes and each student was given a robot, a set of pens, a pen eraser, and a ruler and protractor. The session proceeded in substantially the same way between these two classes and between the Robot and Ruler & Protractor groups. First, teachers let students think of examples from their real lives related to the concepts of geometry being taught; then, they presented the definitions of the various shapes under study.
the figure in the textbook by pairing off and doing Skemp’s examples and non-examples activity with the aid of a robot. One student drew figures using the robot, and the other student verified whether they were examples or non-examples using the ruler and protractor; then, the students switched roles.
As in the ruler and protractor group, students were given 10 minutes for this activity, after that activity, the students reported the number of examples and non-examples they had found, and the teacher verified their accuracy. Skemp’s examples and non-examples activity using the robots is shown in Appendix H. When a student had trouble with his or her robot, the researchers replaced it.
Results
Result of the achievement test in cognitive domain Pretest
The pretest result showed that the Robot group’s average score was 34.3 compared to 37.5 for the Ruler & Protractor group. One-way analysis of variance (ANOVA) showed that the scores of the two groups were not significant different statistically, F(1,119)=0.454, p=0.502 (see Table 1), which indicates that the level of mathematical knowledge of the two groups of students was approximately the same as before the experiment.
Table 1: ANOVA of pretest score for Robot and Ruler & Protractor groups
N M SD df F Sig.
Robot 58 34.3103 27.03877
119 .454 0.502
Ruler & Protractor 63 37.5397 25.68219
p<0.05
Posttest
The posttest results showed that the Robot group’s average score was 59.6 and that of the Ruler & Protractor group, 57.3. Although the Robot group’s average was higher, one-way ANOVA showed no statistically significant difference, F(1, 119) =0.270, p=0.604(see Table 2). This shows that teaching enhances learning achievement in geometry, across both these methods.
Table 2: ANOVA of posttest scores for Robot and Ruler & Protractor groups
N M SD df F Sig.
Robot 58 59.5609 24.41032
119 .270 0.604
Ruler & Protractor 63 57.3016 23.55203
p<0.05
Delayed Test
Table 3: Mixed ANOVA analysis for pre-, post-, and delayed posttest
Source Type III Sum of Squares df Mean Square F Sig. η2 Time 48851.059 2 24425.53 132.4802 0.0000* 0.5268 Time*Group 588.80026 2 294.4001 1.5967 0.2047 0.0132 Error (Time) 43880.345 238 184.3712
Group 12.704312 1 12.70431 0.0096 0.9220 0.0008
Error 157254.51 119 1321.466
p<0.05
Self-assessment test for the affective domain Pretest
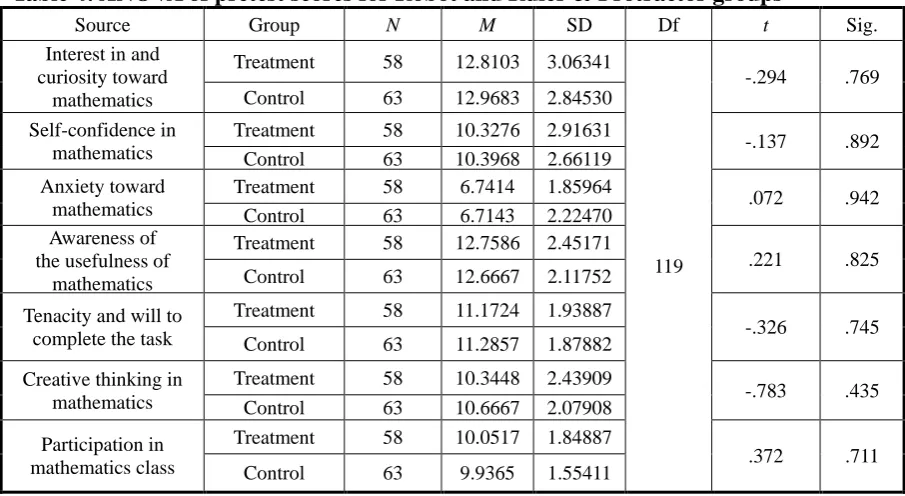
Pretest results show that the two groups’ average scores were approximately the same before the experiment, and one-way ANOVA shows no significant difference statistically, F(1,119)=0.454, p=0.502 (see Table 4), which indicates that the affective level of the two groups of students in relation to math was approximately the same before the experiment
Table 4: ANOVA of pretest scores for Robot and Ruler & Protractor groups
Source Group N M SD Df t Sig.
Interest in and curiosity toward
mathematics
Treatment 58 12.8103 3.06341
119
-.294 .769 Control 63 12.9683 2.84530
Self-confidence in mathematics
Treatment 58 10.3276 2.91631
-.137 .892 Control 63 10.3968 2.66119
Anxiety toward mathematics
Treatment 58 6.7414 1.85964
.072 .942 Control 63 6.7143 2.22470
Awareness of the usefulness of
mathematics
Treatment 58 12.7586 2.45171
.221 .825 Control 63 12.6667 2.11752
Tenacity and will to complete the task
Treatment 58 11.1724 1.93887
-.326 .745 Control 63 11.2857 1.87882
Creative thinking in mathematics
Treatment 58 10.3448 2.43909
-.783 .435 Control 63 10.6667 2.07908
Participation in mathematics class
Treatment 58 10.0517 1.84887
.372 .711 Control 63 9.9365 1.55411
p<0.05
Posttest
Since the pretest scores of the two groups were not entirely equivalent, this study used posttest score as a dependent variable to avoid any interference by pretest scores with the effects of the experiment. A one-way analysis of covariance (ANCOVA) was conducted using the posttest scores as an independent variable and the pretest scores as a covariate. This accounted for the actual difference among posttest scores and excluded interference from the pretest scores.
Table 5: Posttest ANCOVA for Robot and Ruler & Protractor groups
Source Type III Sum
of Squares df
Mean
Square F Sig. Interest in and curiosity toward mathematics 402.485 1 402.485 78.932 0
Group 55.546 1 55.546 10.893 0.001*
Error 601.698 118 5.099
Self-confidence in mathematics 420.05 1 420.05 115.164 0
Group 4.137 1 4.137 1.134 0.289
Error 430.393 118 3.647
Anxiety toward mathematics 289.015 1 289.015 81.692 0
Group 2.643 1 2.643 0.747 0.389
Error 417.467 118 3.538
Awareness of the usefulness of mathematics 176.351 1 176.351 35.867 0
Group 8.605 1 8.605 1.75 0.188
Error 580.181 118 4.917
Tenacity and will to complete task
for task 166.013 1 166.013 51.759 0
Group 1.96 1 1.96 0.611 0.436
Error 378.477 118 3.207
Creative thinking in mathematics 320.81 1 320.81 108.184 0
Group 2.975 1 2.975 1.003 0.319
Error 349.919 118 2.965
Participation in mathematics class 45.852 1 70.776 15.507 0
Group 38.672 1 23.747 13.079 0.000*
Error 348.916 118 2.746
*
p<0.05
These results correspond with those of the qualitative student interviews. In the Robot group, the observers reported that students were immersed in the learning activity, whereas in the Ruler & Protractor group’s they were bored.
Delayed posttest
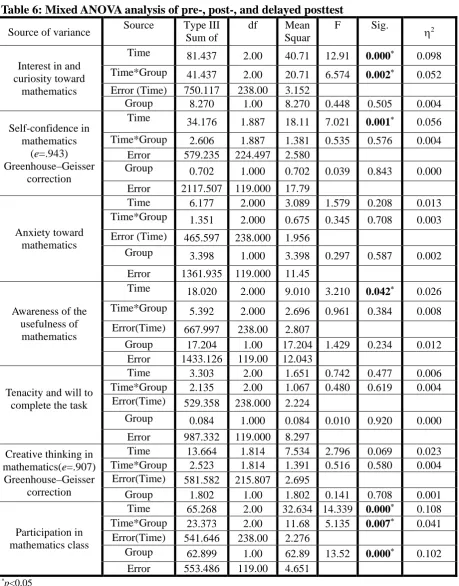
The same tests were also given as delayed posttests to both groups, three months after completion of the treatment, to measure retention of affective change. As seen in Table 6, mixed ANOVA showed a significant interaction between time of testing and group with regard to interest in and curiosity toward mathematics and to participation in mathematics class; but regarding the former, there is no significant effect between groups.
Interest in and curiosity toward mathematics in the Robot group had increased against that in the Ruler & Protractor group at posttest. This corresponds with the posttest ANCOVA results. However, at delayed posttest, interest and curiosity in the Robot group showed a larger drop than that in the Ruler & Protractor group, which showed only a slight change.
and group. This indicated that the Robot group maintained their level of participation even without the robots.
Table 6: Mixed ANOVA analysis of pre-, post-, and delayed posttest
Source of variance Source Type III Sum of df SquarMean F Sig. η2
Interest in and curiosity toward
mathematics
Time 81.437 2.00 40.71 12.91 0.000* 0.098
Time*Group 41.437 2.00 20.71 6.574 0.002* 0.052
Error (Time) 750.117 238.00 3.152
Group 8.270 1.00 8.270 0.448 0.505 0.004
Self-confidence in mathematics
(e=.943) Greenhouse–Geisser
correction
Time 34.176 1.887 18.11 7.021 0.001* 0.056
Time*Group 2.606 1.887 1.381 0.535 0.576 0.004 Error 579.235 224.497 2.580
Group 0.702 1.000 0.702 0.039 0.843 0.000
Error 2117.507 119.000 17.79
Anxiety toward mathematics
Time 6.177 2.000 3.089 1.579 0.208 0.013 Time*Group 1.351 2.000 0.675 0.345 0.708 0.003
Error (Time) 465.597 238.000 1.956
Group 3.398 1.000 3.398 0.297 0.587 0.002
Error 1361.935 119.000 11.45
Awareness of the usefulness of
mathematics
Time 18.020 2.000 9.010 3.210 0.042* 0.026
Time*Group 5.392 2.000 2.696 0.961 0.384 0.008
Error(Time) 667.997 238.00 2.807
Group 17.204 1.00 17.204 1.429 0.234 0.012 Error 1433.126 119.00 12.043
Tenacity and will to complete the task
Time 3.303 2.00 1.651 0.742 0.477 0.006 Time*Group 2.135 2.00 1.067 0.480 0.619 0.004
Error(Time) 529.358 238.000 2.224
Group 0.084 1.000 0.084 0.010 0.920 0.000
Error 987.332 119.000 8.297
Creative thinking in mathematics(e=.907) Greenhouse–Geisser
correction
Time 13.664 1.814 7.534 2.796 0.069 0.023 Time*Group 2.523 1.814 1.391 0.516 0.580 0.004
Error(Time) 581.582 215.807 2.695
Group 1.802 1.00 1.802 0.141 0.708 0.001
Participation in mathematics class
Time 65.268 2.00 32.634 14.339 0.000* 0.108
Time*Group 23.373 2.00 11.68 5.135 0.007* 0.041
Error(Time) 541.646 238.00 2.276
Group 62.899 1.00 62.89 13.52 0.000* 0.102
Error 553.486 119.00 4.651
*p<0.05
Natural observation during the class
non-examples by definition. At Stage 2, students identified examples and non-examples among their figures. Each teacher separately graded all the students using prepared forced-choice checklists. The final score of each student was arrived at by averaging the two teachers’ marks.
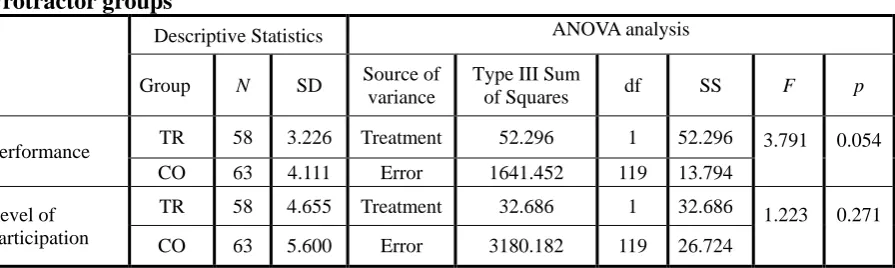
Table 7 shows the result of one-way ANOVA of observation scores, revealing a slightly different result than described above. The written test for the cognitive domain in mathematics showed that mean scores in the Robot group in the pre- and post-tests were higher than in the Ruler & Protractor group. However, mean performance scores in the Ruler & Protractor group under natural observation during the class were higher than those of the Robot group.
This indicates that the observation teachers gave higher marks for the right shape drawn with a ruler and protractor than with a robot. However, the ANOVA result shows no significant statistical difference between groups, F(1,119)=3.791, p=0.054. Meanwhile, observation for level of participation yielded a higher mean score for the Ruler & Protractor group than for the Robot group.
However, one-way ANOVA showed no significant difference, F(1,119)=1.223, p=0.271. This result was different from that of the self-assessment test in the affective domain. This indicated that although the observation teachers evaluated the Ruler & Protractor group students highly, the students did not rate highly in self-assessed participation themselves.
Table 7: ANOVA analysis of mean scores based on observation for Robot and Ruler & Protractor groups
Descriptive Statistics ANOVA analysis Group N SD Source of
variance
Type III Sum
of Squares df SS F p Performance TR 58 3.226 Treatment 52.296 1 52.296 3.791 0.054
CO 63 4.111 Error 1641.452 119 13.794 Level of
participation
TR 58 4.655 Treatment 32.686 1 32.686 1.223 0.271 CO 63 5.600 Error 3180.182 119 26.724
Correlation analysis between achievement and observation tests during class and self-assessment test
The result of the correlation analysis between the achievement test for the cognitive domain, the self-assessment test for the affective domain, and the observation test is shown in Tables 8 and 9. For the affective domain, we included only some evaluation elements, specifically interest in and curiosity toward mathematics and participation in mathematics class, since these showed the most important differences (see Table 6).
As shown in Table 8, correlation analysis of the Ruler & Protractor group revealed significant interactions between achievement scores in the cognitive domain and observation test scores, but no significant interaction between cognitive domain scores and self-assessment test scores in the affective domain.
mathematics class in terms of the aspects retained here. Math class did not contribute to their interest in or curiosity toward mathematics or their participation in class but only to the growth of their math-related cognitive domain.
Table 8: Results of correlation analysis of Ruler & Protractor group
Pretest score for interest and curiosity
Pretest score for participation in mathematics class
Pre-test Scores
Pearson -0.141 0.177
Sig. 0.269 0.166
N 63 63
Performance based on observation
Participation based on observation
Posttest score of interest and curiosity
Posttest score of participation in mathematics class
Post-test
Pearson .693** .462** 0.226 0.153
Sig. 0 0 0.075 0.23
N 63 63 63 63
**Correlation is significant at the 0.01 level (two-tailed).
In the case of the Ruler & Protractor group as well, correlation analysis between the achievement pretest and pretest scores for interest in and curiosity toward mathematics and participation in class showed no significant interaction (see Table 8).
However, as shown table 9, contrary to the Ruler & Protractor group, the correlation analysis for the Robot group revealed a significant interaction between these variables, indicating that the use of robots affected both student scores on the written test and student attitudes toward mathematics. In other words, it contributed to both the cognitive and affective domains.
Table 9: Result of correlation analysis of Robot group
Pretest score for interest and
curiosity
Pretest score for participation in mathematics class
Pre-test
Pearson 0.203 0.312
Sig. 0.126 0.017
N 58 58
Achievement based
on observation
Attitude based on observation
Posttest score for interest and
curiosity
Posttest score for participation in mathematics class
Post-test
Pearson .595** .569** .345** .424**
Sig. 0 0 0.008 0.001
N 58 58 58 58
**Correlation is significant at the 0.01 level (two-tailed).
Qualitative analysis of student learning and interviews with teacher-observers
analyzed them. Student to be interviewed were chosen by a stratified sampling method with four strata: above average, average, below average, and minimal based on pretest scores.
We can draw several conclusions from the interviews with the Robot group students and teacher-observers. With regard to the students, first, these responses correspond with the results of the statistical analysis of the affirmative domain showing that interest in and curiosity toward mathematics and participation in math class are enhanced by robot use. Second, we see that drawing figures with the robots encourages the production of more examples than does the use of ruler and protractor.
Conclusion
The main purpose of this study was to investigate the effect of the use of robots with Skemp’s “examples and no examples” strategy in teaching geometry to Korean fourth-graders. The results can be summarized as follows. First, though the Robot group’s average score in terms of change in the cognitive domain was higher than that of the Ruler & Protractor group, there was no significant difference statistically. Second, the results of observations during class showed that performance did not significantly differ between the groups. Third, the self-assessment test in the affective domain shows that the Robot group’s level of interest in and curiosity toward math and their level of participation in math class were higher than those of the Ruler & Protractor group.
A delayed post-test three months after completion of the treatment showed that Robot group’s level of participation was still higher than that of the Ruler & Protractor group, while levels of interest and curiosity were not significantly different between the groups. This indicates that though the robots were gone, the habit of participating in class persisted.
Next, we conducted correlation analyses between achievements in the cognitive domain, observation test results, and self-assessment in the affective domain. In the case of the Ruler & Protractor group, there were no significant interactions between cognitive and affective domain scores either at pretest or at post-test. In the case of the Robot group, at pretest there was no significant interactions between achievement scores in the cognitive domain and self-assessment scores in the affective domain.
However, at post-test, the results of the correlation analysis between achievement in the cognitive domain and post-test scores for interest in and curiosity toward math and for participation in math class revealed significant interaction. This result indicates that geometry instruction using a ruler and protractor improves students’ abilities in the cognitive domain but not their interest, self-concept and efficacy in mathematics. Regarding the use of robots, in contrast, we can draw the conclusion that it improves ability in these affective realms as well as the cognitive domain.
The results of PISA (Programme for International Student Assessment; Organisation of Economic Co-operation and Development(OECD), 2003) indicate that although Korean students have reached a comparatively high level of achievement in mathematics, they have low motivation and a negative attitude to mathematics. This study could provide a solution to the problem of overcoming this gap. The robots used in this study had an effect on interest in and curiosity toward mathematics and on participation in mathematics class. This suggests that further application of robots as a learning tool can produce productive results in this realm.
Discussion
Some scholars (Jones, 2001; Healy & Hoyles, 2001; Mariotti, 2001; Laborde, 2001) who have examined the use of MicroWorlds and DSG as new media for teaching geometry have expressed reservations regarding whether the effects of these media originate from the media themselves or from the learning strategies used with them. Subsequent to this work, therefore some scholars have studied the effect of learning tools like those considered here combined with teaching strategies, without differentiating between medium and strategy (Hollebrands, 2007; Erbas & Yenmez 2011). The present research also falls into this category.
Interviews with students and teachers indicate that Skemp’s strategy stimulated students to produce more examples and non-examples. Therefore, we draw the conclusion that the use of drawing robots is appropriate to Skemp’s strategy, since it also encourages students to be less afraid to make mistakes in drawing because the mistakes were being made not by them per se but by the robots. These errors were also useful in another way, as for example when the students intended to draw rhombuses but instead drew rectangles or parallelograms due to imperfect control of their robots. This helped them understand the relationships between these figures. Wilson(1983) explains that students have misconceptions about figures due to the existence of “prototypical examples” of the figures.
From the interviews with students and teachers, we have seen that while Ruler & Protractor group students imitated the examples in the textbook, Robot group students developed various examples of their own. This indicates that the robots helped students move beyond reliance on “prototypical examples.” In a related point, as Hoyles & Noss point out, if students are to use MicroWorlds or DSG in math class, they need to know how to use the software; this requirement places an added burden on them. In contrast, the robots used in this study are simple to operate. It does not mean that Robot group’s task is easier than the Ruler & Protractor group’s task. By the student’s interview, robot draw a line autonomously, but it did not draw a figure autonomously. Student tried several times to draw a figure. Laborde & Loborde (1995) distinguish between “drawings” created without concern for the underlying geometrical relationships and “figures” constructed with an understanding of geometrical primitives and the relationships between them. Therefore, the visual output of DSG, for instance, does not represent an instance of a geometrical figure but instead a class of drawings. However, with the robots, students constructed figures using geometrical primitives and relationships to find examples and non-examples of specific figures.
and motivation, helps students maintain a positive attitude, fosters success in learning mathematics, and arouses passion toward and immersion in math learning, leading to a virtuous cycle of self-regulated learning. In the present study, we introduced robots to a mathematics class in order to see whether they enhance student achievement in the cognitive domain as well as the affective areas of interest in and motivation to succeed in mathematics. Our positive findings in this regard support Sanders’ assertion and show that STEM education with robots can arouse passion in students and create an immersive learning experience. Benitti (2011) presents a review of published literature on educational robotics, showing that as of February 2010, (1) only 10 articles had presented the quantitative evaluation of educational robots needed to ascertain their effectiveness; (2) most experiments involving educational robotics were not integrated into classroom activities, occurring instead as after-school or summer programs; and (3) no previous articles had looked at students around the fourth-grade level. These facts clearly demonstrate the significance of the present study, which covers these previously understudied areas.
However, two main limitations exist to this study. One is its short duration (three weeks). Although, to decrease the Hawthorne effect, we offered a program to experience robot for the Ruler & Protractor group, and conducted a delayed post-test three months after completion of the treatment to investigate the persistence of effects, additional longitudinal research will give a more accurate picture of how students react and what gains they might experience from learning geometry in settings like the one presented here. As a second limitation, participants of the two groups took a regular mathematics exam two month after treatment. It seemed to have an effect on student retention level in the cognitive domain. If it had not been for the exam, this study would produce different results on student retention level in the cognitive domain at delayed post-test. Until now, several studies shows potential of robot as a learning tool. Still robot’s potential is unrealized. Most robots are expensive, difficult to manage, require time-consuming process to put together. Therefore, robots are used after school education program. On the contrary previous research, Robot of this research are used in regular class. In this respect, this study has convincingly shown that educational robots have potential as a learning tool in geometry, especially to stimulate student interest in and motivation toward learning. We hope that this study will provide useful guidance for practitioners and researchers in the field of education.
References
Abelson, H. & diSessa, A. (1980). Turtle geometry, Cambridge, MA: MIT Press.
Arcavi A. & Hadas N. (2000). Computer mediated learning: An example of an approach. International Journal of Computers for Mathematical Learning, 5 (1), 25-45.
Battista, M. T. (2007). The development of geometric and spatial thinking. In F. Lester (Ed.), Second handbook of research on mathematics teaching and learning (pp. 843–908). Reston, VA: National Council of Teachers of Mathematics.
Benitti, F.B.V. (2011). Exploring the educational potential of robotics in schools: A systematic review.
Computers & Education, 58(3), 978-988.
Bers, M., Ponte, I., Juelich, C., Viera, A. & Schenker, J. (2002). Teachers as designers: Integrating robotics in early childhood education. Information Technology in Childhood Education Annual, 14, 123-145. Bloom B. S. (1956). Taxonomy of Educational Objectives, Handbook I: The Cognitive Domain. New York:
David McKay Co Inc.
Bobis, J., Anderson, J., Martin, A., Way, J. (2011). A Model for Mathematics Instruction to Enhance Student Motivation and Engagement. In Daniel J. Brahier (Eds.), Motivation and Disposition: Pathways to Learning Mathematics - 73rd Yearbook, (pp. 31-42). Reston, US: National Council of Teachers of Mathematics Brown, R, Brown, J., Reardon, K., & Merrill, C. (2011). Understanding STEM: Current Perceptions.
Clements, D. H., & Battista, M. T. (1989). Learning of geometric concepts in a Logo environment. Journal for Research in Mathematics Education, 20, 450–467.
Clements, D. H., & Battista, M. T. (1992). Geometry and spatial reasoning. In D. A. Grouws (Ed.), Handbook of research on mathematics teaching and learning (pp. 420–464). New York: Macmillan.
Clements, D. H., Battista, M. T. and Sarama, J. (2001). Logo and Geometry. Journal for Research in
Mathematics Education, Monograph Number 10. Reston, VA: National Council for Teachers of Mathematics. Edwards, L. D. (1995). Microworlds as representation. In diSessa, A., Hoyles, C., Noss, R. & Edwards, L.
(Eds.), Computers and exploratory learning. Berlin: Springer.
Erbas, A. K., & Yenmez, A. A. (2011). The effect of inquiry-based explorations in a dynamic geometry
environment on sixth grade students’ achievements in polygons. Computers & Education, 57(4), 2462-2475. Eguchi, A. (2010). What is educational robotics? Theories behind it and practical implementation. In D. Gibson
& B. Dodge (eds.), Proceedings of Society for Information Technology & Teacher Education International Conference 2010 (pp. 4006-4014). Chesapeake, VA: AACE.
Freudenthal, H. (1973). Mathematics as an educational task, Dordrecht: Reidel.
Hershkowitz, R. (1989). Visualization in geometry: two sides of the coin. Focus on Learning Problems in Mathematics, 11(1 & 2), 61–75.
Healy, L. and Hoyles, C. (2001). Software tools for geometrical problem solving: Potentials and pitfalls.
International Journal of Computers for Mathematical Learning, 6, 3.
Hoffer, A. (1983). Van Hiele based research. In R. Lesh, & M. Landau (Eds.), Acquisition of mathematics concepts and processes (pp. 205–227). New York: Academic Press.
Hollebrands, K. (2007). The role of a dynamic software program for geometry in the strategies high school mathematics students employ. Journal for Research in Mathematics Education, 38, 164–192.
Hoyles, C. and Noss, R. (2003). What can digital technologies take from and bring to research in mathematics education? In A.J. Bishop, M.A. Clements, C. Keitel, Second International Handbook of Mathematics (Vol. 1, pp. 323 – 349). Dordrecht, the Netherlands: Kluwer Academic.
International Association for the Evaluation of Educational Achievement (IEA). (2008). TIMSS 2007 International Mathematics Report. Amsterdam: IEA.
Johnson, D. M., Wardlow, G. W., & Franklin, T. D. (1997). Hands-on activities versus worksheets in reinforcing physical science principles: Effects on student achievement and attitude. Journal of Agricultural
Education, 38(3), 9-17.
Jones, K. (2001). Providing a foundation for deductive reasoning: students' interpretations when using dynamic geometry software and their evolving mathematical explanations. Educational Studies in Mathematics. Special issue on Proof in Dynamic Geometry Environments. 44(1-2), 55-85.
Johnson, J. (2003). Children, robotics, and education. In Proceedings of the 7th International Symposium on Artificial Life and Robotics (AROB-7), 491-496.
Kenney, P., & Silver, E. (1993). Student self-assessment in mathematics. In N. Webb (Ed.), National Council of Teachers of Mathematics 1993 Yearbook: Assessment in the mathematics Classroom (pp. 229-238). Reston, VA: National Council of Teachers of Mathematics.
Korea Education Development Institute, (2007), Statistics of entrance into university of natural science and engineering, Retrieved October 12, 2012, from
http://edpolicy.kedi.re.kr/EpnicForum/Epnic/EpnicForum02Viw.php?PageNum=9&S_Key=&S_Menu=&Ac _Code=D0010203&Ac_Num0=6224
Kynigos, C. (2015). Constructionism: Theory of Learning or Theory of Design? In Selected Regular Lectures from the 12th International Congress on Mathematical Education (pp. 417-438). Springer International Publishing.
Laborde, C. & Capponi, B. (1994), Cabri-géomètre constituant d’un mileu pour l’apprentissage de la notion de figure géomètrique, Recherches en didactiques des mathematiques, 14(1.2), 165-210.
Laborde, C. & Laborde, J.-M. (1995). What about a learning environment where Euclidean concepts are manipulated with a mouse? In A. A. diSessa, C. Hoyles, & R. Noss (Eds.), Computers and exploratory learning, Berlin: Springer- Verlag. Pages.
Laborde, C. (2001). Integration of technology in the design of geometry tasks with cabri-geometry. International Journal of Computers for Mathematical Learning, 6, 3.
Lesh, R. & Kelly, A. (1996). A constructivist model for redesigning AI tutors in mathematics. In J. M. Laborde (Ed.), Intelligent Learning Environments: The case of geometry (NATO ASI Series F, vol. 117). Berlin: Springer. 133 –156.
Mataric, M. J. (2004, March). Robotics education for all ages. In Proc. AAAI Spring Symposium on Accessible, Hands-on AI and Robotics Education.
Mariotti, M. A. (2013). Introducing students to geometric theorems: how the teacher can exploit the semiotic potential of a DGS. ZDM, 45(3), 441-452.
Mauch, E. (2001). Using technology innovations to improve the problem-solving skills of middle school students: Educators’ experiences with the Lego Mindstorms robotic invention system. The Clearing House, 74(4), 211-13.
Moyer-Packenham, P. S., & Westenskow, A. (2013). Effects of virtual manipulatives on student achievement and mathematics learning. International Journal of Virtual and Personal Learning Environments (IJVPLE), 4(3), 35-50.
South Korean Ministry of Education and Human Resources Development (MOE), (2013), National Educational Statistical Year Book, Seoul: Ministry of Education and Human Resources Development.
MOE. (2013). Survey of private education expenses for Mathematics and English. Seoul: MOE.
South Korean Ministry of Education and Human Resources Development (MOE), (2003), National Educational Statistical Year Book, Seoul: Ministry of Education and Human Resources Development.
MOE, (2009). Modified curriculum specification. Seoul: MOE.
Mullis, I.V.S., Martin, M.O., & Foy, P. (with Olson, J.F., Preuschoff, C., Erberber, E., Arora, A., & Galia, J.). (2008). TIMSS 2007 International Mathematics Report: Findings from IEA’s Trends in International Mathematics and Science Study at the Fourth and Eighth Grades. Chestnut Hill, MA: TIMSS & PIRLS International Study Center, Boston College.
National Youth Policy Institue. (2009). Survey of Academic Work of Korean High School Students. Seoul: National Youth Institute Publishers.
Noss, R. & Hoyles, C. (1996). Windows on mathematical meanings, Dordrecht, Netherlands: Kluwer Academic Publishers.
OECD. (2004). Learning for Tomorrow’s World: First Results from PISA 2003. Paris: OECD
Ortiz, A. M. (2015). Examining Students’ Proportional Reasoning Strategy Levels as Evidence of the Impact of an Integrated LEGO Robotics and Mathematics Learning Experience.
Piaget, J. (1970). Genetic epistemology. New York: W. W. Norton and Company.
Prevost, F. J. (1985). Geometry in the junior high school. Mathematics Teacher, 78(6), 411–418.
Resnick, M., Berg, R., & Eisenberg, M. (2000). Beyond black boxes: Bringing transparency and aesthetics back to scientific investigation. Journal of the Learning Sciences, 9(1), 7-30
Sanders, M. (2009). STEM, STEM education, STEMmania. The Technology Teacher, 68(4). 20-26.
Sinclair, N., & Bruce, C. D. (2015). New opportunities in geometry education at the primary school. ZDM, 47(3), 319-329.
Skemp, R, R. (1979) Intelligence, Learning and action, Chichster, New York:Wiley.
Skemp,R,R. (1986) The psychology of learning mathematics (2nd ed.), Harmon worth, New York: Penguine Books.
Stohr-Hunt, P. M. (1996). An analysis of frequency of hands-on experience and science achievement. Journal of research in Science Teaching, 33(1), 101-109.
Van Hiele, P.M. (1986). Structure and Insight: a theory of mathematics education (pp.111-112). New York: Academic Press.
Wilensky, U. J. (1993). Connected mathematics-Building concrete relationship with mathematical knowledge, Thesis of doctor of philosophy at the Massachusetts Institute of Technology.
Williams, D., Ma, Y., Prejean, L., Lai, G., & Ford, M. (2007). Acquisition of physics content knowledge and scientific inquiry skills in a robotics summer camp. Journal of Research on Technology in Education, 40(2), 201-216.