RESEARCH
Internal validity and reliability
of experience-based household food insecurity
scales in Indian settings
Vani Sethi
1*, Chandana Maitra
2, Rasmi Avula
3, Sayeed Unisa
4and Surbhi Bhalla
5Abstract
Background: Experience-based household food insecurity (HFI) scales are not included in large-scale Indian sur-veys. There is limited evidence on which experience-based HFI scale or questions within a scale are most relevant for India. Between 01 June and 31 August 2015, we reviewed 19 published and unpublished studies, conducted in India between January 2000 and June 2015, which used experience-based HFI scales. As part of this exercise, internal validity and reliability of the scale used in these studies was examined, field experiences of 31 researchers who used experience-based HFI scales in India were gathered and psychometric tests were conducted where raw data were available.
Results: Out of the 19 studies reviewed, HFI prevalence varied depending on the type of experience-based HFI scale used. Internal reliability across scales ranged between 0.75 and 0.94; however certain items (‘balanced meal’, ‘preferred food’, ‘worried food would run out’) had poor in-fit and out-fit statistics. To improve this, the following is suggested, based on review and experience of researchers: (1) cognitive testing of quality of diet items; (2) avoiding child-refer-enced items; (3) rigorous training of enumerators; (4) addition of ‘how often’ to avoid overestimation of food-insecure conditions; (5) splitting the cut and skip meal item and (6) using a standardized set of questions for aiding comparison of construct validity across scales.
Conclusions: An evidence-based policy dialogue is needed in India for contextualizing and harmonizing the experi-ence-based HFI scales across multiple surveys to aid comparability over time, and support policy decision making. Keywords: Food security, Hunger, Validity, Reliability
© The Author(s) 2017. This article is distributed under the terms of the Creative Commons Attribution 4.0 International License
(http://creativecommons.org/licenses/by/4.0/), which permits unrestricted use, distribution, and reproduction in any medium,
provided you give appropriate credit to the original author(s) and the source, provide a link to the Creative Commons license, and indicate if changes were made. The Creative Commons Public Domain Dedication waiver (http://creativecommons.org/
publicdomain/zero/1.0/) applies to the data made available in this article, unless otherwise stated.
Background
Nearly 40% of Indian children under 5 years of age (~47 million) are chronically undernourished, with over half (51%) of children in the poorest wealth quintiles being affected [1]. Household food insecurity (HFI) is a key determinant of chronic undernutrition in Indian chil-dren, particularly for those living in income-insecure households. HFI is defined as the inability of a house-hold to acquire or consume adequate quantity or quality of food. As severity of HFI increases, steps taken by the household to cope with it become more intense, starting
from adjusting the food budget to adults reducing their food intake and experiencing hunger, and finally the chil-dren experiencing reduced food intake and hunger [2].
Measurement of HFI experiences is not routinely included in large-scale demographic Indian surveys. The National Sample Survey Organization (NSSO) survey includes only one question on household daily access to food, which is inadequate to comprehensively capture the intensity of HFI [3]. The National Family Health Survey (NFHS) measures diet diversity, but not HFI.
Globally, there are four composite validated question-naires available for measuring HFI experiences of house-holds as reported by respondents. The first is the 18-item scale developed by Hamilton et al. [4], which served as
Open Access
*Correspondence: [email protected]
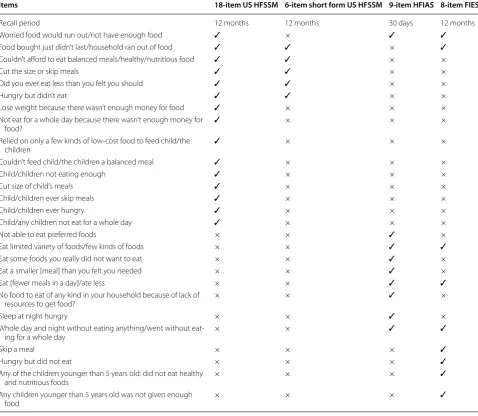
a model for subsequent experience-based HFI scales. It captured four types of HFI experiences: (1) uncertainty and worry about food; (2) inadequate food quality; (3) insufficient food quantity for adults; and (4) insufficient food quantity for children. It supported differentiation of four categories of HFI across diverse settings: high food security, marginal food insecurity, low food insecurity and very low food insecurity. The 18-item scale was fol-lowed by a 6-item sub-set developed by Blumberg et al. [5] that differentiated three categories of HFI experiences faced by adults—high or marginal food security, low food security and very low food security, but did not measure the most severe range of adult food insecurity, in which children’s food intake is likely to be reduced. In 2000, the Food and Nutrition Technical Assistance (FANTA) project adapted the 18-item scale to developing country contexts and came up with the 9-item Household Food Insecurity Access Scale (HFIAS) (hereafter called the 9-item scale). The 9-item scale captured four categories of HFI experiences: food secure, mildly food insecure, moderately food insecure and severely food insecure [6]. The fourth and latest addition is the 8-item Food Insecu-rity Experience Scale (FIES) (henceforth called the 8-item scale) to measure individual food insecurity (FI) devel-oped by the Food and Agriculture Organization of the United Nations (FAO) and tested for use globally through Gallup surveys. The 8-item FIES can identify four catego-ries of individual FI, but can be modified to measure HFI as well. While FIES recommends each country to arrive at FI categorization meaningful to its context, it does provide a raw score-based categorization for researchers who find it beneficial. These are high food security (raw score 0), marginal FI (raw score 1–3), moderate FI (raw score 4–6) and severe FI (raw score 7–8) [7]. Items (i.e. questions) included in the above-mentioned HFI scales are detailed in Table 1.
The Rasch model helps detect internal validity and internal reliability of the experience-based measures of HFI [8]. The Rasch model has its roots in psychometry and Item Response Theory, wherein the construct of interest is ‘experience-based HFI’ and the items repre-senting the underlying phenomenon are arranged along a continuum of ‘severity’ [9]. The internal validity is estab-lished through face validity, fit statistics, item residual correlation and differential item functioning (DIF). Face validity compares a concept as understood by the tar-get audience with the operational definition of the con-cept [10]. Item fit statistics help verify whether each item comprising the scale is associated equally strongly with successive stages of HFI [9] and in-fits between 0.7 and 1.3 are acceptable [11]. DIF helps examine whether items are behaving differently for particular subgroups of determined respondents, i.e. by race, sex or ethnicity.
The underlying cause of DIF could be either that those respondents in two subpopulations understand the ques-tion differently, or they experience or manage FI differ-ently [12]. Cronbach’s α and point bi-serial correlations are helpful to ascertain internal reliability; however, they have several limitations [13] and Rasch reliability can be used instead. External validation that can be established by associating experience-based HFI measures with fac-tors considered to be determinants or outcomes, such as income, nutrition status and food expenditure, is done, and this is termed as construct validation [4].
There is limited evidence on which of the above globally recommended and validated experience-based HFI scales and/or questions in these scales are suitable for India. To fill this information gap, this paper maps the use of expe-rience-based HFI scales in India and reviews their inter-nal validity and reliability, with the aim to inform policy decisions on inclusion of suitable experience-based HFI questions in the large-scale national Nutrition or Demo-graphic Health Surveys in India.
Methods
The study’s geographic scope is India (rural, tribal, urban). It uses a mix of analytic methods including desk review of published/unpublished studies on HFI in India; mapping and interviewing researchers contributing to these studies to record their experiences; and future rec-ommendations and psychometric analyses for studies where raw data were available.
For the desk review, a literature search of HFI in India, conducted between 2000 and 2015, was undertaken. Studies written in English were included. Search engines, including PubMed, Web of science, Medline and Scopus, were used. Search terms applied were ‘experience-based’, ‘experiential’, ‘food insecurity’, ‘hunger’, ‘Rasch model’, ‘food security scales’, ‘food security measurement’ and ‘India’. The search period was 1 June–31 August 2015.
To gain access to grey literature (papers/reports), a contact list was generated of 31 researchers who have conducted relevant work in India (14 from non-govern-mental organizations and 17 from academia). Subse-quently, an email questionnaire was sent to the identified 31 researchers. Of these, 22 responded affirmatively and provided information to at least three of the four ques-tions and also shared their reports/papers: (1) Which questions have been the most applicable in your con-text?; (2) which questions have been the most difficult to understand for the respondents in your context?; (3) concern(s) with translating the questions in local lan-guage; and (4) any feedback regarding future application of the scale?
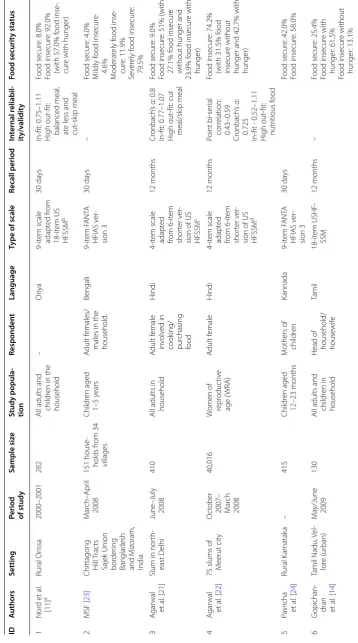
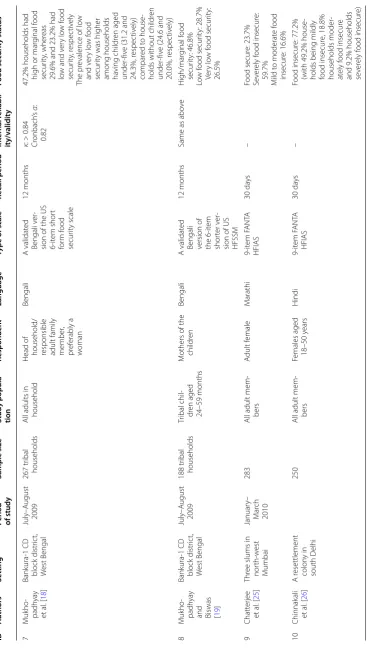
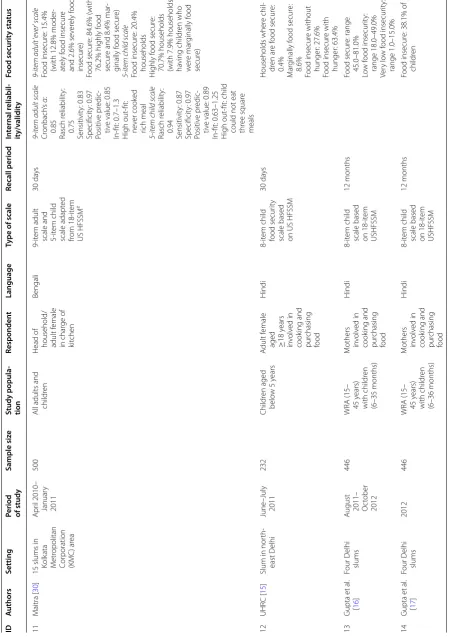
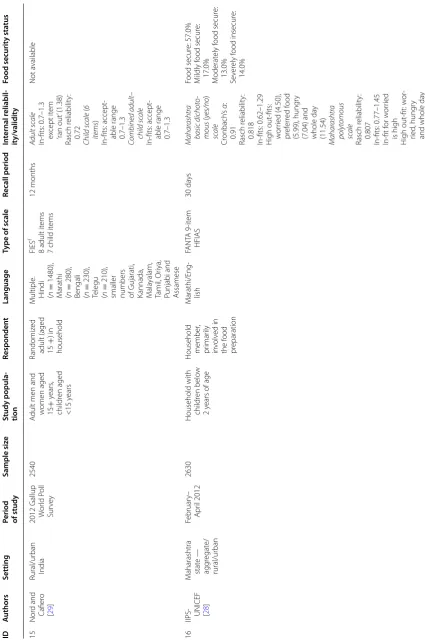
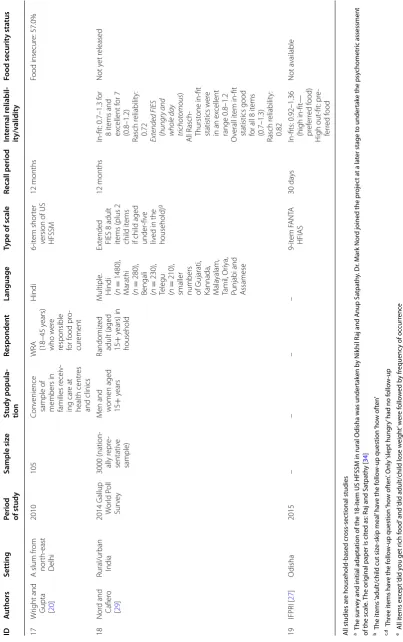
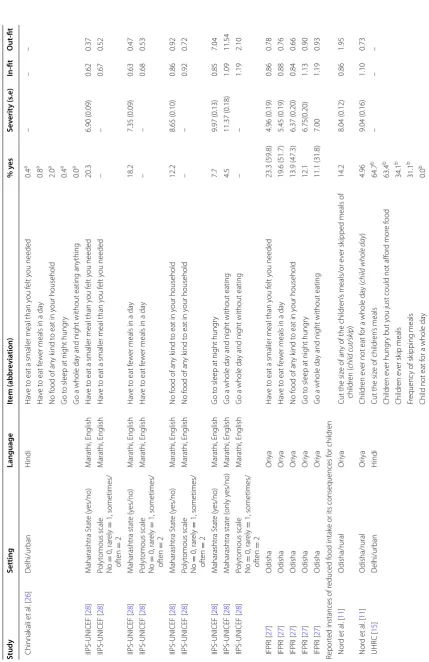
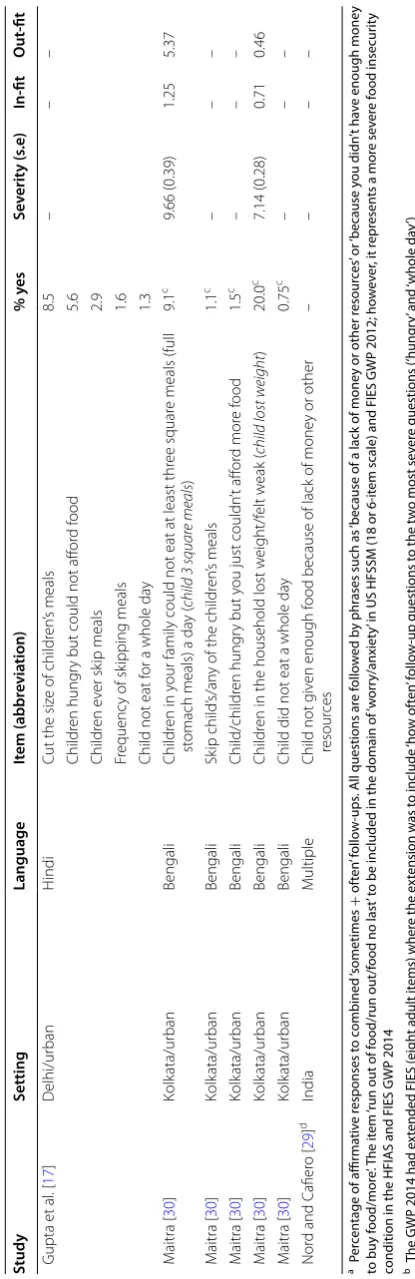
period, 19 studies were identified that had their survey instrument tested for at least one of the measures of internal validity and internal reliability. For each of the 19 studies, an excel spreadsheet was prepared, listing study objective, study setting, sample size, period of sur-vey, study population, survey respondents, recall period, type of scale used and information on scale’s reliability statistics (Cronbach’s α, point bi-serial correlation, Rasch reliability, classification reliability), and validity statistics (face validity, conceptual validity, fit statistics, residual correlations and DIF) (Table 2). Cross-cultural validity for equally worded items across studies was compared by four domain areas: (1) worry/anxiety related to food budget/food supply; (2) perceptions of inadequate food quality or quantity; (3) reported instances of reduced
food intake or its consequences for adults; (4) reported instances of reduced food intake or its consequences for children. To evaluate the external validity of the HFI scales across 19 studies, information was collated on bivariate or multivariate association of HFI status with respect to its determinants and consequences.
Results
In total, 19 experience-based HFI studies in Indian set-tings were identified during the study period. All studies were household-based and cross-sectional (Table 2).
Experience‑based HFI scales used in Indian settings
The 18-item scale and its adaptations have been used across six studies. In urban Vellore [14], they used the
Table 1 Food security scale questionnaire: various scales
Items 18‑item US HFSSM 6‑item short form US HFSSM 9‑item HFIAS 8‑item FIES
Recall period 12 months 12 months 30 days 12 months
Worried food would run out/not have enough food ✓ × ✓ ✓
Food bought just didn’t last/household ran out of food ✓ ✓ × ✓
Couldn’t afford to eat balanced meals/healthy/nutritious food ✓ ✓ × ×
Cut the size or skip meals ✓ ✓ × ×
Did you ever eat less than you felt you should ✓ ✓ × ×
Hungry but didn’t eat ✓ ✓ × ×
Lose weight because there wasn’t enough money for food ✓ × × ×
Not eat for a whole day because there wasn’t enough money for
food? ✓ × × ×
Relied on only a few kinds of low-cost food to feed child/the
children ✓ × × ×
Couldn’t feed child/the children a balanced meal ✓ × × ×
Child/children not eating enough ✓ × × ×
Cut size of child’s meals ✓ × × ×
Child/children ever skip meals ✓ × × ×
Child/children ever hungry ✓ × × ×
Child/any children not eat for a whole day ✓ × × ×
Not able to eat preferred foods × × ✓ ×
Eat limited variety of foods/few kinds of foods × × ✓ ✓
Eat some foods you really did not want to eat × × ✓ ×
Eat a smaller [meal] than you felt you needed × × ✓ ×
Eat [fewer meals in a day]/ate less × × ✓ ✓
No food to eat of any kind in your household because of lack of
resources to get food? × × ✓ ×
Sleep at night hungry × × ✓ ×
Whole day and night without eating anything/went without
eat-ing for a whole day × × ✓ ✓
Skip a meal × × × ✓
Hungry but did not eat × × × ✓
Any of the children younger than 5 years old: did not eat healthy
and nutritious foods × × × ✓
Any children younger than 5 years old was not given enough
Table
2
Summar
y of published/unpublished w
or
k on e
xp
erien
tial household f
oo
d securit
y sc
ales
, I
ndia, 2000–2015
ID
A
uthors
Setting
Period of study
Sample siz
e
Study popula
‑
tion
Responden
t
Language
Type of scale
Recall period
In
ternal r
eliabil
‑
it
y/v
alidit
y
Food securit
y sta
tus
1
Nor
d et
al
.
[
11
]
a
Rural Or
issa
2000–2001
282
All adults and childr
en in the
household
–
Or
iya
9-it
em scale adapt
ed fr
om
18-it
em US
HFSSM
b
30
da
ys
In-fit: 0.75–1.11 High out
-fit:
balanced meal
,
at
e less and
cut
-sk
ip meal
Food secur
e: 8.0%
Food insecur
e: 92.0%
(with 57.0% f
ood inse
-cur
e with hunger)
2
MSF [
23
]
Chittagong H
ill T
rac
ts
Sajek Union bor
der
ing
Bangladesh and M
iz
oram,
India
M
ar
ch–Apr
il
2008
151 house
-holds fr
om 34
villages
Childr
en aged
1–5
y
ears
A
dult f
emales/
males in the household
.
Bengali
9-it
em F
ANT
A
HFIAS v
er
-sion 3
30
da
ys
–
Food secur
e: 4.0%
M
ildly f
ood insecur
e:
4.6%
M
oderat
ely f
ood inse
-cur
e: 11.9%
Se
ver
ely f
ood insecur
e:
79.5%
3
A
gar
wal
et
al
. [
21
]
Slum in nor
th-east D
elhi
June
–July
2008
410
All adults in household
A
dult f
emale
in
volv
ed in
cook
ing/
pur
chasing
food
H
indi
4-it
em scale adapt
ed
from 6-it
em
shor
ter v
er
-sion of US HFSSM
c
12
months
Cr
onbach
’s
α
: 0.8
In-fit: 0.77–1.07 High out
-fit: cut
meal/sk
ip meal
Food secur
e: 9.0%
Food insecur
e: 51% (with
27.1% f
ood insecur
e
without hunger and
23.9% f
ood insecur
e with
hunger)
4
A
gar
wal
et
al
. [
22
]
75 slums of M
eerut cit
y
O
ct
ober
2007– Mar
ch
2008
40,016
W
omen of repr
oduc
tiv
e
age (
WRA)
A
dult f
emale
H
indi
4-it
em scale adapt
ed
from 6-it
em
shor
ter v
er
-sion of US HFSSM
d
12
months
Point bi-ser
ial
cor
relation:
0.43–0.59
Cr
onbach
’s
α
:
0.725
In-fit - 0.52–1.11 High out
-fit:
nutr
itious f
ood
Food insecur
e: 74.2%
(with 31.5% f
ood
insecur
e without
hunger and 42.7% with hunger)
5
Pasr
icha
et
al
. [
24
]
Rural K
ar
natak
a
–
415
Childr
en aged
12–23
months
M
others of childr
en
Kannada
9-it
em F
ANT
A
HFIAS v
er
-sion 3
30
da
ys
Food secur
e: 42.0%
Food insecur
e: 58.0%
6
G
opichan
-dran et al
. [
14
]
Tamil
Nadu
, V
el
-lor
e (ur
ban)
M
ay/June 2009
130
All adults and childr
en in
household
Head of household/ house
wif
e
Tamil
18-it
em USHF
-SSM
12
months
–
Food secur
e: 25.4%
Food insecur
e with
hunger
: 61.5%
Food insecur
e without
hunger
Table
2
c
on
tinued
ID
A
uthors
Setting
Period of study
Sample siz
e
Study popula
‑
tion
Responden
t
Language
Type of scale
Recall period
In
ternal r
eliabil
‑
it
y/v
alidit
y
Food securit
y sta
tus
7
M
uk
ho
-padh
ya
y
et
al
. [
18
]
Bank
ura-1 CD
block distr
ic
t,
W
est Bengal
July–A
ugust
2009
267 tr
ibal
households
All adults in household Head of household/ responsible adult family member
,
pr
ef
erably a
w
oman
Bengali
A validat
ed
Bengali v
er
-sion of the US 6-it
em shor
t
for
m f
ood
secur
ity scale
12
months
κ
: >
0.84
Cr
onbach
’s
α
:
0.82
47.2% households had high or mar
ginal f
ood
secur
ity
, wher
eas
29.6% and 23.2% had low and v
er
y lo
w f
ood
secur
ity
, r
espec
tiv
ely
The pr
evalence of lo
w
and v
er
y lo
w f
ood
secur
ity was higher
among households having childr
en aged
under
-fiv
e (31.2 and
24.3%, r
espec
tiv
ely)
compar
ed t
o house
-holds without childr
en
under
-fiv
e (24.6 and
20.0%, r
espec
tiv
ely)
8
M
uk
ho
-padh
ya
y
and Biswas [19
]
Bank
ura-1 CD
block distr
ic
t,
W
est Bengal
July–A
ugust
2009
188 tr
ibal
households
Tr
ibal chil
-dr
en aged
24–59
months
M
others of the childr
en
Bengali
A validat
ed
Bengali version of the 6-it
em
shor
ter v
er
-sion of US HFSSM
12
months
Same as abo
ve
H
igh/mar
ginal f
ood
secur
ity
: 46.8%
Lo
w f
ood secur
ity
: 28.7%
Ver
y lo
w f
ood secur
ity
:
26.5%
9
Chatt
erjee
et
al
. [
25
]
Thr
ee slums in nor
th-w
est
M
umbai
Januar
y–
M
ar
ch
2010
283
All adult mem
-bers
A
dult f
emale
M
arathi
9-it
em F
ANT
A
HFIAS
30
da
ys
–
Food secur
e: 23.7%
Se
ver
ely f
ood insecur
e:
59.7%
M
ild t
o moderat
e f
ood
insecur
e: 16.6%
10
Chinnak
ali
et
al
. [
26
]
A r
esettlement colon
y in
south D
elhi
250
All adult mem
-bers
Females aged 18–50
y
ears
H
indi
9-it
em F
ANT
A
HFIAS
30
da
ys
–
Food insecur
e: 77.2%
(with 49.2% house
-holds being mildly food insecur
e, 18.8%
households moder
-at
ely f
ood insecur
e
and 9.2% households sever
ely f
ood insecur
Table
2
c
on
tinued
ID
A
uthors
Setting
Period of study
Sample siz
e
Study popula
‑
tion
Responden
t
Language
Type of scale
Recall period
In
ternal r
eliabil
‑
it
y/v
alidit
y
Food securit
y sta
tus
11
M
aitra [
30
]
15 slums in Kolk
ata
M
etr
opolitan
Cor
poration
(KMC
) ar
ea
Apr
il 2010–
Januar
y
2011
500
All adults and childr
en
Head of household/ adult f
emale
in char
ge of
kit
chen
Bengali
9-it
em adult scale and 5-item child scale adapt
ed
from 18-it
em
US HFSSM
e
30
da
ys
9
-item adult sc
ale
Cr
onbach
’s
α
:
0.85
Rasch r
eliabilit
y:
0.75
Sensitivit
y: 0.83
Specificit
y: 0.97
Positiv
e pr
edic
-tiv
e value: 0.85
In-fit: 0.7–1.3 High out
-fit:
ne
ver cook
ed
rich meal
5
-item child sc
ale
Rasch r
eliabilit
y:
0.94
Sensitivit
y: 0.87
Specificit
y: 0.97
Positiv
e pr
edic
-tiv
e value: 0.89
In-fit: 0.63–1.25 High out
-fit: child
could not eat three squar
e
meals
9
-item adult
‘
eve
r
’
sc
ale
Food insecur
e: 15.4%
(with 12.8% moder
-at
ely f
ood insecur
e
and 2.6% se
ver
ely f
ood
insecur
e)
Food secur
e: 84.6% (with
76.2% highly f
ood
secur
e and 8.4% mar
-ginally f
ood secur
e)
5
-item child sc
ale
Food insecur
e: 20.4%
households
H
ighly f
ood secur
e:
70.7% households (with 7.9% households having childr
en who
w
er
e mar
ginally f
ood
secur
e)
12
UHR
C [
15
]
Slum in nor
th-east D
elhi
June
–July
2011
232
Childr
en aged
belo
w 5
y
ears
A
dult f
emale
aged ≥18
y
ears
in
volv
ed in
cook
ing and
pur
chasing
food
H
indi
8-it
em child food secur
ity
scale based on US HFSSM
30
da
ys
Households wher
e chil
-dr
en ar
e f
ood secur
e:
0.4%
M
ar
ginally f
ood secur
e:
8.6%
Food insecur
e without
hunger
: 27.6%
Food insecur
e with
hunger
: 63.4%
13
Gupta et
al
.
[
16
]
Four D
elhi
slums
A
ugust 2011– Oct
ober
2012
446
WRA (15– 45
y
ears)
with childr
en
(6–35
months)
M
others involv
ed in
cook
ing and
pur
chasing
food
H
indi
8-it
em child scale based on 18-it
em
USHFSSM
12
months
Food secur
e: range
45.0–81.0%
Lo
w f
ood insecur
ity
:
range 18.0–49.0%
Ver
y lo
w f
ood insecur
ity
:
range 1.0–15.0%
14
Gupta et
al
.
[
17
]
Four D
elhi
slums
2012
446
WRA (15– 45
y
ears)
with childr
en
(6–36
months)
M
others involv
ed in
cook
ing and
pur
chasing
food
H
indi
8-it
em child scale based on 18-it
em
USHFSSM
12
months
Food insecur
e: 38.1% of
childr
Table
2
c
on
tinued
ID
A
uthors
Setting
Period of study
Sample siz
e
Study popula
‑
tion
Responden
t
Language
Type of scale
Recall period
In
ternal r
eliabil
‑
it
y/v
alidit
y
Food securit
y sta
tus
15
Nor
d and
Cafier
o
[
29
]
Rural/ur
ban
India
2012 G
allup
W
or
ld P
oll
Sur
ve
y
2540
A
dult men and women aged 15+
y
ears
,
childr
en aged
<15
y
ears
Randomiz
ed
adult (aged 15+
) in
household
M
ultiple
.
H
indi
(
n
=
1480),
M
arathi
(
n
=
280),
Bengali (n=
230),
Telegu (n=
210),
smaller numbers of Gujarati, Kannada, Mala
yalam,
Tamil
, Or
iya,
Punjabi and Assamese
FIES
f
8 adult it
ems
7 child it
ems
12
months
Adult sc
ale
In-fits: 0.7–1.3 ex
cept it
em
‘ran out
’ (1.38)
Rasch r
eliabilit
y:
0.72
Child sc
ale
(
6
items
)
In-fits: accept
-able range 0.7–1.3
Combined adult
–
child sc
ale
In-fits: accept
-able range 0.7–1.3
Not a
vailable
16
IIPS- UNICEF [28
]
M
aharashtra stat
e —
agg
regat
e/
rural/ur
ban
Februar
y–
Apr
il 2012
2630
Household with childr
en belo
w
2
years of age
Household member
,
pr
imar
ily
in
volv
ed in
the f
ood
pr
eparation
M
arathi/Eng
-lish
FANT
A 9-it
em
HFIAS
30
da
ys
Mahar
ashtr
a
basic dichoto
-mous
(
yes/no
)
sc
ale
Cr
onbach
’s
α
:
0.91
Rasch r
eliabilit
y:
0.818
In-fits: 0.62–1.29 High out
-fits:
w
or
ried (4.50),
pr
ef
er
red f
ood
(5.99), hung
ry
(7.04) and whole da
y
(11.54)
Mahar
ashtr
a
polytomous scale
Rasch r
eliabilit
y:
0.807
In-fits: 0.77–1.45 In-fit f
or w
or
ried
is high
H
igh out
-fit: w
or
-ried
, hung
ry
and whole da
y
Food secur
e: 57.0%
M
ildly f
ood secur
e:
17.0%
M
oderat
ely f
ood secur
e:
13.0%
Se
ver
ely f
ood insecur
e:
Table 2 c on tinued ID A uthors Setting
Period of study
Sample siz e Study popula ‑ tion Responden t Language Type of scale Recall period In ternal r eliabil ‑ it y/v alidit y Food securit y sta tus 17 W
right and Gupta [20]
A slum fr
om nor th-east D elhi 2010 105 Con venience
sample of members in families r
eceiv -ing car e at health centr es and clinics
WRA (18–45
y
ears)
who w
er
e
responsible for f
ood pr o-cur ement H indi 6-it em shor ter
version of US HFSSM
12 months Food insecur e: 57.0% 18 Nor d and Cafier o [ 29 ] Rural/ur ban India 2014 G allup W or ld P oll Sur ve y 3000 (nation -ally r epr e-sentativ e sample) M
en and women aged 15+
y
ears
Randomiz
ed
adult (aged 15+
y ears) in household M ultiple . H indi ( n = 1480), M arathi ( n = 280),
Bengali (n=
230),
Telegu (n=
210),
smaller numbers of Gujarati, Kannada, Mala
yalam,
Tamil
, Or
iya,
Punjabi and Assamese
Ex
tended FIES 8 adult items (plus 2 child it
ems
if child aged under
-fiv
e
liv
ed in the
household)
g
12
months
In-fit: 0.7–1.3 f
or 8 it ems and ex cellent f or 7 (0.8–1.2) Rasch r eliabilit y: 0.72 Ex
tended FIES (hungr
y and
whole day trichotomous
) All R asch-Thurst one in-fit statistics w er e
in an ex
cellent
range 0.8–1.2
O
verall it
em in-fit
statistics good for all 8 it
ems (0.7–1.3) Rasch r eliabilit y: 0.82 Not y et r eleased 19 IFPRI [ 27 ] O disha 2015 – – – – 9-it em F ANT A HFIAS 30 da ys
In-fits: 0.92–1.36 (high in-fit
— pr ef er red f ood) H igh out -fit: pr e-fer red f ood Not a vailable A
ll studies ar
e household-based cr
oss-sec
tional studies
a T
he sur
vey and initial adapta
tion of the 18-it
em US HFSSM in rur
al O disha w as under taken b y N ik hil R
aj and A
nup S atpa th y. Dr . M ar k Nor
d joined the pr
ojec
t a
t a la
ter stage t
o under
take the psy
chometr
ic assessmen
t
of the scale
. T
he or
ig
inal paper is cit
ed as: R
aj and S
atpa
th
y [
34
]
b T
he it
ems
‘adult/child cut siz
e-sk
ip meal
’ ha
ve the f
ollo w -up question ‘ho w of ten ’ c,
d T
hr
ee it
ems ha
ve the f
ollo w -up question ‘ho w of ten ’. Only ‘slept hung ry
’ had no f
ollo
w
-up
e A
ll it
ems e
xc
ept
‘did y
ou get r
ich f
ood
’ and
‘did adult/child lose w
eigh t’ w er e f ollo w ed b y fr equenc
y of oc
cur
renc
e
f No f
ollo w -up question ‘ho w of ten ’
g Ex
tension w as t o include ‘ho w of ten ’ f ollo w
-up questions t
o the t
w
o most sev
er
e questions (hung
ry and whole da
y). R
esponse options:
‘only onc
e or t
wic
e’,
‘in some mon
ths but not ev
er
y mon
th
’, ‘almost ev
er y mon th ’. Par tial cr edit R
asch model analy
sis
. Child it
ems w er e f or r esear ch pur
original 18-item scale that combines the adult–child item. In the Kolkata slum study, Maitra [30] used nine adult items and five child items. In rural Odisha [11], research-ers adapted the 18-item scale to construct a 9-item adult-child combined scale. Three Delhi-based slum studies used only the eight child items as they intended to assess child FI [15–17]. Five studies used the 6-item scale. Bankura district studies [18, 19] and a north-east Delhi slum study [20] used the original version of the 6-item scale. Delhi [21] and Meerut [22] slum studies shortened it to a 4-item scale. The 9-item FANTA scale has been used in six studies: rural Mizoram [23], Karnataka [24]
Mumbai slums [25], Delhi urban resettlement colony
[26], rural Odisha [27] and state-wide Maharashtra nutri-tion survey [28]. The 8-item FIES scale has been used in the nationwide Gallup World Poll (GWP) 2014 survey and its 2012 feasibility study [29].
Six studies were in rural settings [11, 18, 19, 24, 27], and the remaining ten were urban slums/resettlement colonies. Sample size varied from 130 [14] to 40,000 [30]. The GWP 2014 survey and Maharashtra survey sampled between 2000 and 3000 households and were representa-tive for nation and state, respecrepresenta-tively [28, 29]. The survey tool was locally adapted in all studies.
The respondents were mostly women of reproductive age, except in five studies [12, 16,17, 26, and 27] where respondents were head of household or any responsi-ble adult family member, preferably a woman. For two studies [11, 27], information on respondents was not available.
Studies using the 9-item scale used a 30-day recall period, and those studies using FIES and the 6-item scale or its adaptations used a 12-month recall period. The Kolkata slums and rural Odisha studies reported using a 30-day recall period while using the 18-item scale for recall accuracy [11, 30] although a 12-month recall period is recommended. Only one of the three studies that used the child-referenced items of the 18-item scale [15] reported experiencing difficulty with a 12-month recall period and, hence, used a 30-day recall period.
All studies that used the 9-item scale used standard fre-quency of occurrence options. The 18-item version of the scale has frequency of occurrence questions for selected items. These options were followed in the Vellore study [14] and child food security studies in Delhi slums [15– 17]. However, the Kolkata slum study incorporated a fre-quency of occurrence question after every ‘occurrence’ question except the questions on ‘eating rich food’ and ‘losing weight’ and tweaked the frequency of response options to: ‘often’ (a few times most weeks), ‘sometimes’ (1 or 2 weeks but not every week) and ‘rarely’ (only a few days in a month/1 or 2 days) [30].
Studies using the 6-item scale have used the standard frequency of occurrence options with minor variations— for example, while the Delhi survey [21] defined ‘often’ as ‘10–12 months’ or ‘almost every month’ and ‘sometimes’ as ‘3–9 months’, the Meerut survey [22] worded ‘often’ as ‘few times in most months’ or ‘almost every month’ and ‘sometimes’ as ‘6–12 times past year’. The rural Odi-sha survey [11] did not use any frequency of occurrence response. India is among the few countries of the GWP 2014 survey in which affirmative responses to the two most severe questions ‘hungry’ and ‘whole day’ were fol-lowed up with frequency of occurrence options [29] such as ‘only once or twice’, ‘in some months but not every month’ and ‘almost every month’.
Prevalence thresholds used across experience‑based HFI scales
Fifteen of the nineteen studies used standard recom-mended raw score thresholds for classifying HFI. The rural Odisha study [11], Delhi slum studies [21], Agarwal et al. [22] and Kolkata slum study [30] used locally mean-ingful cut-off for raw scores to capture local context. Not surprisingly, HFI prevalence varied depending on the type of scale used and geographic context (Table 2).
Internal reliability and validity
For nine studies with information on psychometric anal-ysis, the item and household severity parameters have been reported (Table 2). For studies using the 18-item scale [11, 30], in-fits were in acceptable range for adult items (0.7–1.13) and out-fits were high for ‘balanced meal’ (4.96), ‘ate less’ (3.07), ‘child cut size-skip meal’ (1.95) in the Odisha study [11] and for ‘rich meal’ (5.00) in the Kolkata study [30].
The adapted 6-item scale into four-items was adminis-tered in Delhi and Meerut slums [21, 22] with in-fits rang-ing from 0.52 to 1.11 and variant out-fits (0.63–11.22), particularly for ‘cut size-skip meal’ and ‘nutritious meal’.
Using the 9-item scale, the Odisha study [27] reports item in-fits of 0.84–1.36, with high in-fit (1.36) and out-fit (1.47) for the item ‘preferred food’. In Maharashtra study [28], in-fits were variant (0.62–1.29), largely owing to erratic responses for the items ‘worried’, ‘preferred food’, ‘hungry’ and ‘whole day’. The residual correlation between ‘smaller’ and ‘fewer’ is excessive (0.63) (Table 2).
GWP 2014 survey results [29] on internal validity
All nine studies reported consistency in ordering of items corresponding to anxiety and quality of food (e.g. ‘worried’, ‘preferred food’, ‘limited variety’) being at the lower end of the scale and the items relating to drastic reduction in adult intake (e.g. ‘hungry’ and ‘whole day’) being at the higher end of the scale. In between lie the questions on graduated reduction in quality or intake (‘food not want’ or ‘smaller meal’). Occasional overlaps in ordering of responses to some of the questions are noted, the most striking result being the item ‘lost weight’ (adult-referenced), while ‘personally eating less’ and ‘rich food’ having very low severity in the Kolkata slum study [30] and the item ‘preferred food’ having relatively lower severity than expected in the rural Odisha study [11].
Cross‑cultural validity
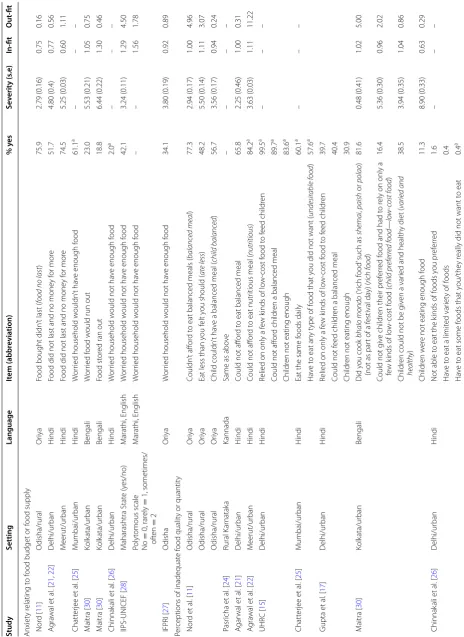
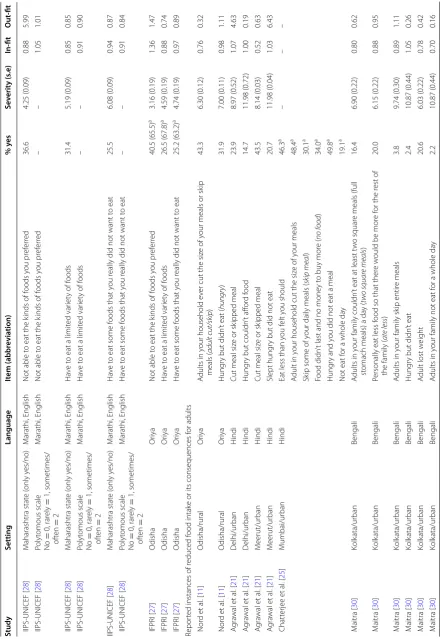
For most items, severity of equally worded items was comparable for domains pertaining to reducing quantity of food reduced food intake, but not those relating to worry/anxieties related to food budget and perceptions of inadequate food quality (Table 3).
External validation
There was a positive linear relation that children from food-insecure households have poor nutritional status in studies where construct validity was established [19, 21, 28].
Discussion
Low in‑fits for selected items across scales
In-fit statistics for one or more items in seven of the nine studies where fit statistics were reported were not in the expected range of 0.7–1.3, owing to either low in-fits or extremely high out-fits on selected items [11, 21, 22, 27– 30]. Variant out-fits/in-fits were particularly noted for items such as ‘worried’, ‘balanced meal’, ‘preferred food’, ‘rich meal’, ‘adult/child cut-skip meal’, ‘nutritious meal’. These results show either poor interviewee or inter-viewer understanding of the questions, proper wording of items and, hence, a need for more robust pre-testing and contextualization. A rephrasing of and elaboration of the questions to arrive at suitable answers may help improve the in-fits. Evidence on the ‘uncertainty and anxiety’ items is mixed, demonstrating weak association of the item with the underlying latent trait of experience-based HFI in India and an indication that worrying about food is not a common concept in all cultures and redun-dancy of some ‘worry/anxiety’ items for deprived envi-ronments [31].
Quality‑related items are problematic
Major concerns emerge on items/questions related to the ‘inadequate food quality’ domain, adult or child specific.
First, the ‘balanced meal’ item may speculated to be not applicable in the Indian low-income zones unless accom-panied by relevant and suitable examples, due to lack of equivalent expression for the phrase in the Indian con-text. Attempts to replace the expression ‘balanced meal’ by expressions such as ‘healthy and varied diet’ (child-referenced) or ‘nutritious meal’ (adult-(child-referenced) have also met with problems in some studies indicating the need for care during translation in a well-understood lan-guage. Additionally, including relevant indicators from FAO dietary diversity score is suggested to help under-stand (1) access to food and nutrient adequacy and (2) capture information on source of meals. It is an impor-tant step, since ‘balanced meal’ itself as a question leads to deviant out-fits. Also, the score provides perspective on agriculture–nutrition linkages, which are important in rural areas.
Second, the item ‘preferred food’ is also problematic based on both psychometric evidence and the research-ers’ feedback, since the concept of ‘preferred’ food is likely to vary according to culture and geographic origin of people and also between adults and children. Third, an attempt to capture the quality through items such as ‘rich food’ did not prove meaningful. Items such as ‘lost weight’, ‘personally eating less food’ in scales seem to contradict the essence, and it would be useful to avoid them.
Severe forms of food insecurity are uniformly cross‑cultural The items in the domain of ‘inadequate food quantity’ perform more or less consistently across all settings and all scales and were inacceptable fit-statistics ranges (0.70–1.30) in most cases, providing evidence that the most severe forms of FI are uniform across all cultures and also easier to relate to by respondents.
A challenging item across scales was ‘adult cut-skip meal’, and researchers [11, 22] have advised to split the item for future applications, since the two behaviours are supposedly different in practice. Similar results have been reported by Derrickson for Hawaii [10] where the item ‘cut size-skip meal’ has been tested for inclusion on the national scale and reported poor in-fit statistics.
Problematic child food insecurity items
There is limited psychometric evidence in the domain of child food inadequacy and its consequences [32]. How-ever, the consensus that emerges from literature and personal feedback of researchers who participated in the online survey is that child FI may not always represent severe FI since reduction in children’s meals is possible for reasons other than FI.
Table
3
F
oo
d insecurit
y themes and c
orr esp onding it ems , I ndia, 2000–2015 Study Setting Language It em (abbr evia tion) % y es Se verit y (s .e) In ‑fit O ut ‑fit Anxiet y r elating t o f
ood budget or f
ood supply Nor d [ 11 ] O disha/rural Or iya
Food bought didn
’t last (
food no last
) 75.9 2.79 (0.16) 0.75 0.16 A gra wal et al . [ 21 , 22 ] D elhi/ur ban H indi
Food did not last and no mone
y f or mor e 51.7 4.80 (0.4) 0.77 0.56 M eerut/ur ban H indi
Food did not last and no mone
y f or mor e 74.5 5.25 (0.03) 0.60 1.11 Chatt erjee et al . [ 25 ] M umbai/ur ban H indi W or
ried household w
ouldn
’t ha
ve enough f
ood 61.1 a – – – M aitra [ 30 ] Kolk ata/ur ban Bengali W or ried f ood w
ould run out
23.0 5.53 (0.21) 1.05 0.75 M aitra [ 30 ] Kolk ata/ur ban Bengali Food st or
ed ran out
18.8 6.44 (0.22) 1.30 0.46 Chinnak ali et al . [ 26 ] D elhi/ur ban H indi W or
ried household w
ould not ha
ve enough f
ood 2.0 a – – – IIPS-UNICEF [ 28 ] M aharashtra Stat e (y es/no) M arathi, English W or
ried household w
ould not ha
ve enough f
ood 42.1 3.24 (0.11) 1.29 4.50 Polyt omous scale No = 0, rar ely = 1, sometimes/ of ten = 2 M arathi, English W or
ried household w
ould not ha
ve enough f
ood – – 1.56 1.78 IFPRI [ 27 ] O disha Or iya W or
ried household w
ould not ha
ve enough f
ood 34.1 3.80 (0.19) 0.92 0.89 Per
ceptions of inadequat
e f
ood qualit
y or quantit
y Nor d et al . [ 11 ] O disha/rural Or iya Couldn ’t aff or d t
o eat balanced meals (
balanc ed meal ) 77.3 2.94 (0.17) 1.00 4.96 O disha/rural Or iya
Eat less than y
ou f
elt y
ou should (
ate less ) 48.2 5.50 (0.14) 1.11 3.07 O disha/rural Or iya Child couldn ’t ha
ve a balanced meal (
child balanc ed ) 56.7 3.56 (0.17) 0.94 0.24 P asr icha et al . [ 24 ] Rural K ar natak a Kannada
Same as abo
ve – – – – A gar wal et al . [ 21 ] D elhi/ur ban H indi
Could not aff
or
d t
o eat balanced meal
65.8 2.25 (0.46) 1.00 0.31 A gra wal et al . [ 22 ] M eerut/ur ban H indi
Could not aff
or
d t
o eat nutr
itious meal (
nutritious ) 84.2 a 3.63 (0.03) 1.11 11.22 UHR C [ 15 ] D elhi/ur ban H indi
Relied on only a f
ew k
inds of lo
w-cost f ood t o f eed childr en 99.5 a – – –
Could not aff
or
d childr
en a balanced meal
89.7
a
Childr
en not eating enough
83.6 a Chatt erjee et al . [ 25 ] M umbai/ur ban H indi
Eat the same f
oods daily 60.1 a – – – Ha ve t
o eat an
y t
ype of f
ood that y
ou did not want (
undesir able food ) 57.6 a Gupta et al . [ 17 ] D elhi/ur ban H indi
Relied on only a f
ew k
inds of lo
w-cost f ood t o f eed childr en 39.7
Could not f
eed childr
en a balanced meal
40.4
Childr
en not eating enough
30.9 M aitra [ 30 ] Kolk ata/ur ban Bengali Did y ou cook bhalo mondo (‘ rich f ood
’ such as
shemai , paish or polao )
(not as par
t of a f
estival da y) ( rich food ) 81.6 0.48 (0.41) 1.02 5.00
Could not g
iv
e childr
en their pr
ef
er
red f
ood and had t
o r
ely on only a
fe
w k
inds of lo
w-cost f ood ( child pr eferr ed food — lo w -c ost food ) 16.4 5.36 (0.30) 0.96 2.02 Childr
en could not be g
iv
en a var
ied and health
y diet (
varied and healthy ) 38.5 3.94 (0.35) 1.04 0.86 Childr en w er
e not eating enough f
ood 11.3 8.90 (0.33) 0.63 0.29 Chinnak ali et al . [ 26 ] D elhi/ur ban H indi
Not able t
o eat the k
inds of f
oods y ou pr ef er red 1.6 – – – Ha ve t
o eat a limit
ed var
iet
y of f
oods
0.4
Ha
ve t
o eat some f
oods that y
ou/the
y r
eally did not want t
o eat
0.4
Table 3 c on tinued Study Setting Language It em (abbr evia tion) % y es Se verit y (s .e) In ‑fit O ut ‑fit IIPS-UNICEF [ 28 ] M aharashtra stat e (only y es/no) M arathi, English
Not able t
o eat the k
inds of f
oods y ou pr ef er red 36.6 4.25 (0.09) 0.88 5.99 IIPS-UNICEF [ 28 ] Polyt omous scale No = 0, rar ely = 1, sometimes/ of ten = 2 M arathi, English
Not able t
o eat the k
inds of f
oods y ou pr ef er red – – 1.05 1.01 IIPS-UNICEF [ 28 ] M aharashtra stat e (only y es/no) M arathi, English Ha ve t
o eat a limit
ed var
iet
y of f
oods 31.4 5.19 (0.09) 0.85 0.85 IIPS-UNICEF [ 28 ] Polyt omous scale No = 0, rar ely = 1, sometimes/ of ten = 2 M arathi, English Ha ve t
o eat a limit
ed var
iet
y of f
oods – – 0.91 0.90 IIPS-UNICEF [ 28 ] M aharashtra stat e (only y es/no) M arathi, English Ha ve t
o eat some f
oods that y
ou r
eally did not want t
o eat 25.5 6.08 (0.09) 0.94 0.87 IIPS-UNICEF [ 28 ] Polyt omous scale No = 0, rar ely = 1, sometimes/ of ten = 2 M arathi, English Ha ve t
o eat some f
oods that y
ou r
eally did not want t
o eat – – 0.91 0.84 IFPRI [ 27 ] O disha Or iya
Not able t
o eat the k
inds of f
oods y ou pr ef er red 40.5 (65.5) a 3.16 (0.19) 1.36 1.47 IFPRI [ 27 ] O disha Or iya Ha ve t
o eat a limit
ed var
iet
y of f
oods 26.5 (67.8) a 4.59 (0.19) 0.88 0.74 IFPRI [ 27 ] O disha Or iya Ha ve t
o eat some f
oods that y
ou r
eally did not want t
o eat 25.2 (63.2) a 4.74 (0.19) 0.97 0.89 Repor
ted instances of r
educed f
ood intak
e or its consequences f
or adults Nor d et al . [ 11 ] O disha/rural Or iya A
dults in y
our household e
ver cut the siz
e of y
our meals or sk
ip meals ( adult cut/sk ip ) 43.3 6.30 (0.12) 0.76 0.32 Nor d et al . [ 11 ] O disha/rural Or iya Hung
ry but didn
’t eat (
hungr y ) 31.9 7.00 (0.11) 0.98 1.11 A gra wal et al . [ 21 ] D elhi/ur ban H indi
Cut meal siz
e or sk
ipped meal 23.9 8.97 (0.52) 1.07 4.63 A gra wal et al . [ 21 ] D elhi/ur ban H indi Hung
ry but couldn
’t aff or d f ood 14.7 11.98 (0.72) 1.00 0.19 A gra wal et al . [ 21 ] M eerut/ur ban H indi
Cut meal siz
e or sk
ipped meal 43.5 8.14 (0.03) 0.52 0.63 A gra wal et al . [ 21 ] M eerut/ur ban H indi Slept hung
ry but did not eat
20.7 11.98 (0.04) 1.03 6.43 Chatt erjee et al . [ 25 ] M umbai/ur ban H indi
Eat less than y
ou f elt y ou should 46.3 a – – – A
dult in y
our household cut the siz
e of y
our meals
48.4
a
Sk
ip some of y
our daily meals (
sk ip meal ) 30.1 a Food didn
’t last and no mone
y t
o buy mor
e ( no food ) 34.0 a Hung
ry and y
ou did not eat a meal
49.8
a
Not eat f
or a whole da
y 19.1 a M aitra [ 30 ] Kolk ata/ur ban Bengali A
dults in y
our family couldn
’t eat at least t
w
o squar
e meals (full
st
omach meals) a da
y ( tw o squar e meals ) 16.4 6.90 (0.22) 0.80 0.62 M aitra [ 30 ] Kolk ata/ur ban Bengali
Personally eat less f
ood so that ther
e w
ould be mor
e f
or the r
est of
the family (
ate less ) 20.0 6.15 (0.22) 0.88 0.95 M aitra [ 30 ] Kolk ata/ur ban Bengali A
dults in y
our family sk
ip entir e meals 3.8 9.74 (0.30) 0.89 1.11 M aitra [ 30 ] Kolk ata/ur ban Bengali Hung
ry but didn
’t eat 2.4 10.87 (0.44) 1.05 0.26 M aitra [ 30 ] Kolk ata/ur ban Bengali A
dult lost w
eight 20.6 6.03 (0.22) 0.78 0.42 M aitra [ 30 ] Kolk ata/ur ban Bengali A
dults in y
our family not eat f
or a whole da
y
2.2
10.87 (0.44)
0.70
Table 3 c on tinued Study Setting Language It em (abbr evia tion) % y es Se verit y (s .e) In ‑fit O ut ‑fit Chinnak ali et al . [ 26 ] D elhi/ur ban H indi Ha ve t
o eat a smaller meal than y
ou f elt y ou needed 0.4 a – – – Ha ve t
o eat f
ew
er meals in a da
y
0.8
a
No f
ood of an
y k
ind t
o eat in y
our household
2.0
a
G
o t
o sleep at night hung
ry
0.4
a
G
o a whole da
y and night without eating an
ything 0.0 a IIPS-UNICEF [ 28 ] M aharashtra Stat e (y es/no) M arathi, English Ha ve t
o eat a smaller meal than y
ou f elt y ou needed 20.3 6.90 (0.09) 0.62 0.37 IIPS-UNICEF [ 28 ] Polyt omous scale No = 0, rar ely = 1, sometimes/ of ten = 2 M arathi, English Ha ve t
o eat a smaller meal than y
ou f elt y ou needed – – 0.67 0.52 IIPS-UNICEF [ 28 ] M aharashtra stat e (y es/no) M arathi, English Ha ve t
o eat f
ew
er meals in a da
y 18.2 7.35 (0.09) 0.63 0.47 IIPS-UNICEF [ 28 ] Polyt omous scale No = 0, rar ely = 1, sometimes/ of ten = 2 M arathi, English Ha ve t
o eat f
ew
er meals in a da
y – – 0.68 0.53 IIPS-UNICEF [ 28 ] M aharashtra Stat e (y es/no) M arathi, English No f
ood of an
y k
ind t
o eat in y
our household 12.2 8.65 (0.10) 0.86 0.92 IIPS-UNICEF [ 28 ] Polyt omous scale No = 0, rar ely = 1, sometimes/ of ten = 2 M arathi, English No f
ood of an
y k
ind t
o eat in y
our household – – 0.92 0.72 IIPS-UNICEF [ 28 ] M aharashtra Stat e (y es/no) M arathi, English G o t
o sleep at night hung
ry 7.7 9.97 (0.13) 0.85 7.04 IIPS-UNICEF [ 28 ] M aharashtra stat e (only y es/no) M arathi, English G
o a whole da
y and night without eating
4.5 11.37 (0.18) 1.09 11.54 IIPS-UNICEF [ 28 ] Polyt omous scale No = 0, rar ely = 1, sometimes/ of ten = 2 M arathi, English G
o a whole da
y and night without eating
– – 1.19 2.10 IFPRI [ 27 ] O disha Or iya Ha ve t
o eat a smaller meal than y
ou f elt y ou needed 23.3 (59.8) 4.96 (0.19) 0.86 0.78 IFPRI [ 27 ] O disha Or iya Ha ve t
o eat f
ew
er meals in a da
y 19.6 (51.7) 5.45 (0.19) 0.88 0.76 IFPRI [ 27 ] O disha Or iya No f
ood of an
y k
ind t
o eat in y
our household 13.9 (47.3) 6.37 (0.20) 0.84 0.66 IFPRI [ 27 ] O disha Or iya G o t
o sleep at night hung
ry 12.1 6.75(0.20) 1.13 0.90 IFPRI [ 27 ] O disha Or iya G
o a whole da
y and night without eating
11.1 (31.8)
7.00
1.19
0.93
Repor
ted instances of r
educed f
ood intak
e or its consequences f
or childr en Nor d et al . [ 11 ] O disha/rural Or iya
Cut the siz
e of an
y of the childr
en
’s meals/or e
ver sk
ipped meals of
childr en ( child cut/sk ip ) 14.2 8.04 (0.12) 0.86 1.95 Nor d et al . [ 11 ] O disha/rural Or iya Childr en e
ver not eat f
or a whole da
y (
child whole day
) 4.96 9.04 (0.16) 1.10 0.73 UHR C [ 15 ] D elhi/ur ban H indi
Cut the siz
e of childr
en ’s meals 64.7 b – – – Childr en e ver hung
ry but y
ou just could not aff
or d mor e f ood 63.4 b Childr en e ver sk ip meals 34.1 b Fr equenc
y of sk
ipping meals
31.1
b
Child not eat f
or a whole da
y
0.0
Table
3
c
on
tinued
Study
Setting
Language
It
em (abbr
evia
tion)
% y
es
Se
verit
y (s
.e)
In
‑fit
O
ut
‑fit
Gupta et
al
. [
17
]
D
elhi/ur
ban
H
indi
Cut the siz
e of childr
en
’s meals
8.5
–
–
–
Childr
en hung
ry but could not aff
or
d f
ood
5.6
Childr
en e
ver sk
ip meals
2.9
Fr
equenc
y of sk
ipping meals
1.6
Child not eat f
or a whole da
y
1.3
M
aitra [
30
]
Kolk
ata/ur
ban
Bengali
Childr
en in y
our family could not eat at least thr
ee squar
e meals (full
st
omach meals) a da
y (
child 3 squar
e meals
)
9.1
c
9.66 (0.39)
1.25
5.37
M
aitra [
30
]
Kolk
ata/ur
ban
Bengali
Sk
ip child
’s/an
y of the childr
en
’s meals
1.1
c
–
–
–
M
aitra [
30
]
Kolk
ata/ur
ban
Bengali
Child/childr
en hung
ry but y
ou just couldn
’t aff
or
d mor
e f
ood
1.5
c
–
–
–
M
aitra [
30
]
Kolk
ata/ur
ban
Bengali
Childr
en in the household lost w
eight/f
elt w
eak (
child lost w
eight
)
20.0
c
7.14 (0.28)
0.71
0.46
M
aitra [
30
]
Kolk
ata/ur
ban
Bengali
Child did not eat a whole da
y
0.75
c
–
–
–
Nor
d and C
afier
o [
29
]
d
India
M
ultiple
Child not g
iv
en enough f
ood because of lack of mone
y or other
resour
ces
–
–
–
–
a P
er
cen
tage of affir
ma
tiv
e r
esponses t
o c
ombined
‘sometimes
+
of
ten
’ f
ollo
w
-ups
. A
ll questions ar
e f
ollo
w
ed b
y phr
ases such as
‘because of a lack of money or other r
esour
ces
’ or
‘because y
ou didn
’t ha
ve enough money
to buy f
ood/mor
e’.
The it
em
‘run out of f
ood/run out/f
ood no last
’ t
o be included in the domain of
‘w
or
ry/anxiet
y’
in US HFSSM (18 or 6-it
em scale) and FIES GWP 2012; ho
w
ev
er
, it r
epr
esen
ts a mor
e sev
er
e f
ood insecur
ity
condition in the HFIAS and FIES GWP 2014 b T
he GWP 2014 had e
xt
ended FIES (eigh
t adult it
ems) wher
e the e
xt
ension w
as t
o include
‘ho
w of
ten
’ f
ollo
w
-up questions t
o the t
w
o most sev
er
e questions (‘
hung
ry
’ and
‘whole da
y’)
c T
he GWP 2012 da
ta f
or FIES included sev
en questions tha
t asked about f
ood c
onditions among childr
en aged 0–14 y
ears in the household
d T
he GWP 2014 had t
w
o child it
ems if child aged under
-fiv
e liv
ed in the household
. Child it
ems w
er
e f
or r
esear
ch pur
poses and not included in the scale
. No child it
ems ar
e included in the GWP 2015 sur
refer only to much younger children under the age of five due to the potential threat of the presence of a strong sec-ond dimension differentiated by adult versus child items. This explains why the child-referenced questions were removed in the 8-item FIES.
Inclusion of follow‑up questions should be based on pre‑testing stage
In the 4-item Delhi and Meerut slum studies [21, 22] including the follow-up question ‘how often’ after the combined item ‘cut size-skip meal’ served to improve the validity of the scale. The Delhi study [21] also recom-mended adding ‘how often’ follow-up questions to the item ‘hungry’. Similar suggestions were proposed by the Kolkata study [30].
Other researchers interviewed suggested that including ‘how often’ responses may increase respondent burden and greatly complicate analysis. It can thus be suggested that it may be useful to include such follow-up questions in a research survey to explore the temporal patterns of FI or it may be useful to include such follow-ups to the most severe questions in order to extend the range of measured severity upward. However, the final decision to include follow-up items should be based on pre-testing.
Mixed evidence on cross‑cultural validity
Items in domains of uncertainty and quality reduc-tion, such as ‘worried’, ‘balanced meal’, ‘preferred food’, ‘no food to eat’, have different severities across different scales and settings. Nonetheless, the 8-item FIES tested across various settings and subpopulations in India did find cross-cultural comparability, indicating that its prev-alence rates will have little bias. However, the question of equivalence of different scales remains unanswered due to lack of adequate data.
Relevance of construct validity
Construct validation is relevant only if internal validity and reliability is robust and a standardized set of charac-teristics are defined for use across studies and only nine studies have established the same. Reporting poor associ-ation of experience-based HFI scales (with poor internal validity) will misrepresent the information on construct validity. Although the respondent in the majority of stud-ies reviewed was an adult female member in the house-hold, possible sources of bias in the surveys may affect the validity of the scales, such as sex of respondent, period of survey and choice of recall period, thereby reducing comparability [32].
Recall period: 12 months or 30 days?
The survey period is also an important consideration in eliminating risk of response bias due to seasonality and
subsequent change in food habits, especially during fes-tivities [30]. The shorter reference period may improve recall. It is a good option when differences in food secu-rity between the different seasons need to be studied. Difference in recall periods should also be kept in mind when comparing HFI prevalence using experience-based HFI scales. In surveys conducted over a longer period, like National Surveys, a 12-month recall period is better since it reduces seasonality effects and improves compa-rability across different parts of the country. A 12-month recall period may be more relevant in those settings where averaging out seasonal differences is necessary. If experience-based HFI is transient or occasional for a sub-stantial proportion of those who are food insecure, then the difference between the 12-month and 30-day recall period may be substantial. Based on the objective of the study, the reference period should be decided.
Conclusions
This paper reviewed the internal reliability and validity of 19 studies using experience-based HFI in the India. The following conclusions are based on this analysis:
First, experience-based HFI scales used in the Indian context are internally reliable. To improve validation, the following actions are suggested: (1) cognitive testing of quality of diet items; (2) avoid child-referenced items (FAO guidelines state ‘additional child centric questions may be added to describe the context of FI among chil-dren, but will not be used in the analysis of the 8-item FIES scale’ [7]); (3) rigorous training of enumerators; (4) addition of ‘how often’ to avoid overestimation of food-insecure conditions; (5) split the ‘cut and skip’ meal item; (6) use a standardized set of questions for aiding compar-ison of construct validity across scales; and (7) apart from evaluating the Rasch assumption of equal item discrimi-nation, examine the assumption of conditional item inde-pendence to eliminate the threat of redundant items and of a second dimension in the data, such as households with and without children.
Second, the survey recall period may be decided according to the survey purpose and based on pre-testing and duration of FI periods.
Third, it is critical to establish external validity of expe-rience-based HFI scales with nutritional (anthropomet-ric) indicators.