RESEARCH ARTICLE
Optimization of enzymatic esterification
of dihydrocaffeic acid with hexanol in ionic
liquid using response surface methodology
Somayeh Gholivand
1, Ola Lasekan
1*, Chin Ping Tan
1, Faridah Abas
2and Leong Sze Wei
3Abstract
Background: Developing an efficient lipophilization reaction system for phenolic derivatives could enhance their applications in food processing. Low solubility of phenolic acids reduces the efficiency of phenolic derivatives in most benign enzyme solvents. The conversion of phenolic acids through esterification alters their solubility and enhances their use as food antioxidant additives as well as their application in cosmetics.
Results: This study has shown that lipase-catalyzed esterification of dihydrocaffeic acid with hexanol in ionic liquid (1-butyl-3-methylimidazoliumbis (trifluoromethylsulfonyl) imide) was the best approach for esterification reaction. In order to achieve the maximum yield, the process was optimized by response surface methodology (RSM) based on a five-level and four independent variables such as: dosage of enzyme; hexanol/dihydrocaffeic acid mole ratio; temper-ature and reaction time. The optimum esterification condition (Y = 84.4%) was predicted to be obtained at tempera-ture of 39.4 °C, time of 77.5 h dosage of enzyme at 41.6% and hexanol/dihydrocaffeic acid mole ratio of 2.1.
Conclusion: Finally, this study has produced an efficient enzymatic esterification method for the preparation of hexyl dihydrocaffeate in vitro using a lipase in an ionic liquid system. Concentration of hexanol was the most significant (p < 0.05) independent variable that influenced the yield of hexyl dihydrocaffeate.
Keywords: Enzymatic esterification, Hexyl dihydrocaffeate, Candida antartica lipase (Novozyme 435), Ionic liquid, Response surface methodology (RSM)
© The Author(s) 2017. This article is distributed under the terms of the Creative Commons Attribution 4.0 International License (http://creativecommons.org/licenses/by/4.0/), which permits unrestricted use, distribution, and reproduction in any medium, provided you give appropriate credit to the original author(s) and the source, provide a link to the Creative Commons license, and indicate if changes were made. The Creative Commons Public Domain Dedication waiver (http://creativecommons.org/ publicdomain/zero/1.0/) applies to the data made available in this article, unless otherwise stated.
Background
Due to the useful biological properties of phenolic acids, they have been reported to have widespread applica-tions in the pharmaceutical, cosmetics and food indus-tries [1–5]. Phenolic acids are compounds which act as hydrogen donors, singlet oxygen quenchers and reducing agents [6]; therefore, they are classified as antioxidants. Anti-atherosclerotic, anti-cancer or anti-carcinogenic, anti-mutagenic, anti-viral, anti-bacterial and anti-inflam-matory activities are the other important properties of many phenolic compounds [7]. Most of the phenolic acids are hydrophilic compounds; thus, they exhibit low solubility and stability in oil-based formulae which
has restricted their application in various industries [2]. However, to apply naturally occurring phenolic acids in oil-based formulation and food processing, the esterifica-tion strategy of their carboxylic acid group with suitable aliphatic alcohol is necessary.
The conversion of phenolic acids through esterification alters their solubility and enhances their use as food anti-oxidant additives as well as their application in cosmetics. phenolic acids trans-esterification with chemical method reduces their product yield since they are heat sensitive and susceptible to oxidation under certain pH [8]. There-fore, lipase-catalyzed reaction in organic solvent media under mild conditions can be used as an alternative syn-thetic method. In spite of improving the conversion yield by this method, the existence of a few technical difficul-ties during the enzyme-catalyzed esterification of phe-nolic acids has been noticed such as their low solubility
Open Access
*Correspondence: [email protected]
1 Department of Food Technology, University Putra Malaysia, 43400 Serdang, Selangor, Malaysia
in the presence of some organic solvent media (e.g. in hexane) where the enzyme is active or reversed behavior in other solvents (e.g. DMSO). Hence, to overcome the above problems, the other suitable synthetic pathway is needed. Ionic liquids have been introduced as a green synthesis media, instead of organic solvents, for the enzy-matic transformation of various substances [9].
Ionic liquids (ILs) which are made from bulky cat-ion and a small ancat-ion, have been classified as tunable designer solvents with very low volatility and high ther-mal stability [10]. These solvents have attracted the atten-tion of organic researchers as greener replacements to conventional organic media in order to facilitate sus-tainable chemistry. The low toxicity of some of the ionic liquids [11, 12], reusability, ecofriendly nature of ionic liquids and also their ability to improve the enzyme sta-bility and selectivity are the other advantages of ILs for the bio-catalytic modification of phenolic compounds [13–17]. Several groups have also reported the use of ionic liquids for the enzymatic transformation of flavo-noid [9], glucose [18], phenolic glycosides and other com-pounds [19–22].
In the present study, the enzymatic esterification of dihydrocaffeic acid (DHCA) with 1- hexanol (Fig. 1) as a model reaction was carried out in ionic liquid [1-butyl-3-methylimidazoliumbis (trifluoromethylsul-fonyl) imide]. DHCA is a degradation product of caffeic acid with potent antioxidant properties [2]. In fact, it is formed by human intestinal bacteria as hydrogenated analogue metabolite of caffeic acid and eriocitrin [23]. To assist the enzymatic esterification reaction between DHCA and hexanol, response surface methodology (RSM) was used to investigate the reaction processes and
elucidate the relationships between the optimized factors (substrate concentration; dosage of the enzyme, reaction time and temperature) on the degree of esterification as a response variable. RSM is a valuable tool used to deter-mine the optimum levels of two or more treatment vari-ables. In addition; RSM is a useful approach for reducing the experimental runs, time and cost in comparison with one factor at a time for hexyl dihydrocaffeate produc-tion. It has important applications in the design, develop-ment and formulation of new products, as well as in the improvement of existing product design [24].
Results and discussion
Effect of hexanol concentration on the conversion yield of hexyl dihydrocaffeate
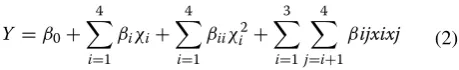
Results of the esterification of DHCA during a 3 days period are shown in Fig. 1. Increasing the hexanol con-centration resulted in higher conversion of DHCA to its hexyl ester. Nearly 100% conversion yield was obtained when the DHCA to hexanol mole ratio of 1:16 was used for 3 days. Although using high dosage of alcohol was particularly useful for obtaining a higher conversion yield for the antioxidant (hexyl dihydrocaffeate) but its separa-tion and purificasepara-tion from the residual unreacted alcohol in solutions containing the DHCA/hexanol mole ratio greater than 1:2 posed serious problems. Therefore, the synthesis of the hexyl dihydrocaffeate was carried out in solutions containing lower DHCA/alcohol ratio (i.e. less than 1:2 ratio) in order to overcome the above drawback. This range of acid/alcohol mole ratio (less than 1:2) was used for optimization of esterification.
To perform the reaction at high temperatures, Novo-zyme 435 was selected as one of the thermo stable immobilized enzymes since it has optimum reaction tem-perature of 40–60 °C and a longer half time [25]. Higher temperature not only decreases the system viscosity which increases the mass transfer [26] but also improves the kinetics of enzymatic reaction which resulted in higher conversion yield. Selection of the suitable range for all factors affecting the conversion of DHCA was based on either the preliminary experiments or literature data [27].
Fitting the response surface model
Multivariate regression analysis was performed using response surface analysis to fit the mathematical model to the experimental values aiming at high composite desirability and optimal region for the response variable studied, to describe the relationship between four factors and response variable and finally determine the optimum conditions for the synthesis of the natural antioxidant in ionic liquid system. The response surface analysis permit-ted the development of an empirical relationship where
0 20 40 60 80 100 120
Soln. 1 Soln. 2 Soln. 3 Soln. 4
Conversion (%)
Hexanol (mM) Day 1 Day 2 Day 3
response (Y) was measured as a function of substrate mole ratio (X1), enzyme amount (X2), reaction time (X3),
reaction temperature (X4) and also predicted as the sum
of constant (β0), four first-order effects (linear terms in
X1, X2, X3 and X4), four second-order effects (quadratic
terms in X21, X22, X23and X24) and four interaction effects
(interactive terms in X1X2, X1X3, X1X4 and X2X4). The
results of the analysis of variance revealed a “goodness of fit”. In the reduced model, only statistical significant (p < 0.05) terms were included.
The fitted quadratic regression (1), illustrating the degree of conversion of DHCA to its ester as a function of four factors, was determined as follows:
According to the results given in Eq. 1, the model obtained for the response variable described the linear, quadratic and interaction effects of four independent var-iables affecting the yield. The predicted regression coef-ficient of adjusted model along with its lack of fit test, R2
adjusted and R2 value is presented in Table 1. The final
reduced model which has been fitted based on F test at
(1)
Y= −300.110+18.654 X1+3.831 X2+1.182 X3
+8.425 X4− 1.409 X21−0.052 X 2
2−0.011 X 2 3
−0.065 X24+0.249 X1X2+0.058 X1X3
−0.182 X1X4−0.038 X2X4
the 5% confidence level of the regression model (p < 0.05) resulted in a second-order polynomial model for the response variable studied. It should be noted that the full quadratic equation was fitted for predicting the degree of esterification value.
The unity of the R2 value means that the model is strong
and also has a better prediction of the response [28]. On the other, the coefficient of determination (R2) provided
the quality and satisfactory fit to the second-order poly-nomial model. It has been reported that for the model to have goodness of fit (predicted response variables), the R2
should be greater than 0.80 [29]. In the current study, the high values of R2 adjusted (0.91) and R2 (0.95) indicated
the high variability in the response variable studied and high significance in model respectively, and as a result, these guaranteed an adequate fitting of the polynomial model to the experimental data. Also, the lack of fit (F
value), which measures the fitness of models, resulted in no significant F value (p > 0.05) in terms of the response variables studied.
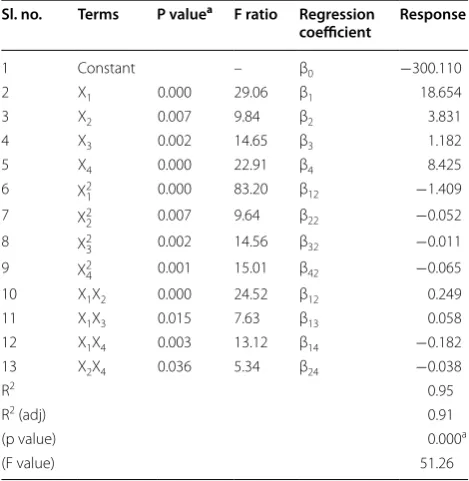
In addition, Table 1 shows that the linear terms of the four independent variables had significant positive effects on conversion while at the same time indicating a nega-tive effect on the quadratic terms. Interaction effects between two factors namely: hexanol-enzyme and hex-anol-time were positively related to the percent of con-version value. Conversely, response value was negatively influenced by interaction between hexanol-temperature and enzyme-temperature. These significant terms should be considered as the primary independent variables for evaluating the variation of conversion yield.
In accordance with Table 1, the most significant inde-pendent factor affecting the variation of conversion yield was found in the quadratic term for concentration of hexanol. Furthermore, the probability (p) of the regres-sion model (0.000) confirmed that the model was highly significant for the response variable. Also, Table 1 clearly revealed that the esterification of dihydrocaffeic acid as a response variable was significantly (p < 0.05) influenced by the linear and quadratic terms of all studied factors, followed by the interaction effects of hexanol-enzyme, hexanol-time, hexanol-temperature and enzyme-temper-ature variables.
Optimization procedure
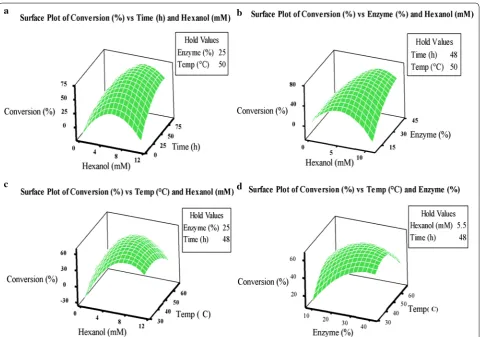
Graphical and numerical optimization procedures were employed to predict the precise level of four fac-tors resulting in the desirable goal of response variable. An optimal treatment was shown by response surface plotting of the values. Using 3D response surface of the regression model for the graphical interpretation of the factor interactions has been highly recommended [30–32].
Table 1 ANOVA and regression coefficient of the first and second degree polynomial regression model
Concentration of hexanol (×10−4 mM) X
1, enzyme amount (%) X2, reaction time
(h) X3 and reaction temperature X4 a Significant (p < 0.05)
Sl. no. Terms P valuea F ratio Regression
coefficient Response
1 Constant – β0 −300.110
2 X1 0.000 29.06 β1 18.654
3 X2 0.007 9.84 β2 3.831
4 X3 0.002 14.65 β3 1.182
5 X4 0.000 22.91 β4 8.425
6 X2
1 0.000 83.20 β12 −1.409
7 X2
2 0.007 9.64 β22 −0.052
8 X23 0.002 14.56 β32 −0.011
9 X24 0.001 15.01 β42 −0.065
10 X1X2 0.000 24.52 β12 0.249
11 X1X3 0.015 7.63 β13 0.058
12 X1X4 0.003 13.12 β14 −0.182
13 X2X4 0.036 5.34 β24 −0.038
R2 0.95
R2 (adj) 0.91
(p value) 0.000a
Figure 2 indicated the three-dimensional (3D) response surface for two factors at a constant value of the other two factors. The 3D diagrams can be used to better under-stand the significant (p < 0.05) interaction effect between two independent variables and response as well as locate their optimum levels. As it is evident from the surface plots (a, b, c and d), by increasing the concentration of hexanol, the response variable (hexyl dihydrocaffeate) increased. Further increase in hexanol concentration (>6 mM) significantly decreased the percent conversion of hexyl dihydrocaffeic acid (HDHCA). Also the conver-sion yield was increased with increased enzyme amount, time and temperature up to 40 °C.
The response optimizer was employed to generate the optimal set of four factors leading to the desired criteria of response variable. The conversion of dihydrocaffeic acid would be viewed as an optimal product if the goal employed for numerical or graphical optimization led to a maximum degree of esterification. The optimum esteri-fication conditions were predicted to be obtained at tem-perature of 39.4 °C, time of 77.5 h dosage of enzyme at
41.6% and concentration of hexanol at 9.3 × 10⁻⁴ mM
using response optimizer and response surface plots. As it can be seen in Fig. 3, the composite and the individual desirability for the degree of esterification of phenolic compound (dihydrocaffeic acid) were found to be one.
Model verification
Comparison was made between the experimental data of the response and the fitted values predicted by the response regression model (Table 2) using two-sample T test for checking the adequacy of the response surface equation. The results exhibited no significant (p > 0.05) difference between the predicted data and actual values. Proximity of the observed values and predicted data and also the high correlation coefficient (0.95) affirmed that the corresponding response surface model was adequate in predicting variations of response variable as a func-tion of esterificafunc-tion condifunc-tions. However, the close results of the predicted and experimental values under the optimum area revealed the appropriateness of the model.
Characterization of the purified product
FTIR analysis for hexyl dihydrocaffeate
The results of the hexyl dihydrocaffeate FTIR with spec-trum in the 4000–280 cm−1 regions are presented in
Table 3. The bands at 3385–3502 cm−1 could be
attrib-utable to the stretching of the hydroxyl functional group of catechol moiety. The adsorption bands at about 2900 cm−1 with two branches can be attributed to the
C=H stretching of aromatic and aliphatic, while the peak at 1704 cm−1 was assigned to C=O stretching of
the ester. The bands found at wavelengths lower than 1608 cm−1 revealed the presence of aromatic ring in the
structure of the resultant ester. Also, the bands between 1261 and 1008 are related to C–O stretching of the ester (Table 3).
NMR analysis for hexyl dihydrocaffeate and other alkyl esters
The synthesized antioxidant ester (hexyl dihydro-caffeate) was identified by 1H NMR (500 MHz, (METHANOL-d4)) and its result is presented in Fig. 4. Chemical shifts (δ) were given in ppm while coupling constants were in Hz. The result of the ester is: 1H NMR
δ ppm: 0.90 (t, J = 6.99 Hz, 3 H), 1.20–1.36 (m, 6 H), 1.50–1.62 (m, 2 H), 2.54 (t, J = 7.57 Hz, 2 H), 2.75 (t, J = 7.60 Hz, 2 H), 4.03 (t, J = 6.70 Hz, 2 H), 6.49 (dd, J = 8.15, 1.75 Hz, 1 H), 6.62 (d, J = 1.75 Hz, 1 H), 6.65 (d, J = 8.15 Hz, 1 H).
Conclusion
The central composite design (CCD) was shown to be a valuable tool for optimizing the esterification conditions of dihydrocaffeic acid. Concentration of hexanol was the most significant (p < 0.05) independent variable affecting the conversion yield. Results have shown that hexyl dihy-drocaffeate yield was significantly (p < 0.05) affected by the linear and quadratic terms of all the factors studied. Moreover, the optimization procedure showed that the optimum region with the highest desirability (D = 1) was achieved at temperature of 39.4 °C, time of 77.5 h dos-age of enzyme at 41.6% and concentration of hexanol at 9.3 × 10⁻⁴ mM.
Experimental Materials
Ionic liquids consisting: 1-butyl-3-methylimidazoliumbis (trifluoromethylsulfonyl) imide with purity of 98% was acquired from Sigma-Aldrich (Milan, Italy). Immobi-lized lipase (triacylglycerol hydrolase, EC 3.1.1.3; Novo-zyme 435 from C.antarctica supported on acrylic resin beads was obtained from Novo Nordisk Bio-industrials, Inc. (Bagsvaerd, Denmark). 3,4 Dihydroxycaffeic acid (DHCA), hexanol, and methanol with the highest avail-able purity purchased from Sigma-Aldrich (Milan, Italy). 3 Å molecular sieves (10–20 Mesh beads) were obtained from Fluka (Fluka, Neu-Ulm, Germany). Chloroform, diethyl ether and all solvents were of analytical and HPLC
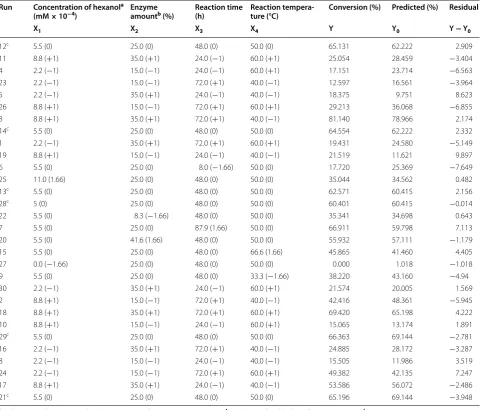
Table 2 Central composite design: factor (Xi), response variable (Y) and residual
a Substrate molar ratio was selected correspondingly to 0.5 − 2(2.2–8.8 × 10⁻⁴ mM) hexanol to dihydrocaffeic acid (4.4 × 10⁻⁴ mM) b 15–35% relative to the total weight of substrates
c Center point
Run Concentration of hexanola
(mM × 10−4) Enzyme amountb (%) Reaction time (h) Reaction tempera-ture (°C) Conversion (%) Predicted (%) Residual
X1 X2 X3 X4 Y Y0 Y − Y0
12c 5.5 (0) 25.0 (0) 48.0 (0) 50.0 (0) 65.131 62.222 2.909
11 8.8 (+1) 35.0 (+1) 24.0 (−1) 60.0 (+1) 25.054 28.459 −3.404 4 2.2 (−1) 15.0 (−1) 24.0 (−1) 60.0 (+1) 17.151 23.714 −6.563 23 2.2 (−1) 15.0 (−1) 72.0 (+1) 40.0 (−1) 12.597 16.561 −3.964 5 2.2 (−1) 35.0 (+1) 24.0 (−1) 40.0 (−1) 18.375 9.751 8.623 26 8.8 (+1) 15.0 (−1) 72.0 (+1) 60.0 (+1) 29.213 36.068 −6.855 3 8.8 (+1) 35.0 (+1) 72.0 (+1) 40.0 (−1) 81.140 78.966 2.174
14c 5.5 (0) 25.0 (0) 48.0 (0) 50.0 (0) 64.554 62.222 2.332
1 2.2 (−1) 35.0 (+1) 72.0 (+1) 60.0 (+1) 19.431 24.580 −5.149 19 8.8 (+1) 15.0 (−1) 24.0 (−1) 40.0 (−1) 21.519 11.621 9.897
6 5.5 (0) 25.0 (0) 8.0 (−1.66) 50.0 (0) 17.720 25.369 −7.649
25 11.0 (1.66) 25.0 (0) 48.0 (0) 50.0 (0) 35.044 34.562 0.482
13c 5.5 (0) 25.0 (0) 48.0 (0) 50.0 (0) 62.571 60.415 2.156
28c 5 (0) 25.0 (0) 48.0 (0) 50.0 (0) 60.401 60.415 −0.014
22 5.5 (0) 8.3 (−1.66) 48.0 (0) 50.0 (0) 35.341 34.698 0.643
7 5.5 (0) 25.0 (0) 87.9 (1.66) 50.0 (0) 66.911 59.798 7.113
20 5.5 (0) 41.6 (1.66) 48.0 (0) 50.0 (0) 55.932 57.111 −1.179
15 5.5 (0) 25.0 (0) 48.0 (0) 66.6 (1.66) 45.865 41.460 4.405
27 0.0 (−1.66) 25.0 (0) 48.0 (0) 50.0 (0) 0.000 1.018 −1.018
9 5.5 (0) 25.0 (0) 48.0 (0) 33.3 (−1.66) 38.220 43.160 −4.94
30 2.2 (−1) 35.0 (+1) 24.0 (−1) 60.0 (+1) 21.574 20.005 1.569 2 8.8 (+1) 15.0 (−1) 72.0 (+1) 40.0 (−1) 42.416 48.361 −5.945 18 8.8 (+1) 35.0 (+1) 72.0 (+1) 60.0 (+1) 69.420 65.198 4.222 10 8.8 (+1) 15.0 (−1) 24.0 (−1) 60.0 (+1) 15.065 13.174 1.891
29c 5.5 (0) 25.0 (0) 48.0 (0) 50.0 (0) 66.363 69.144 −2.781
16 2.2 (−1) 35.0 (+1) 72.0 (+1) 40.0 (−1) 24.885 28.172 −3.287 8 2.2 (−1) 15.0 (−1) 24.0 (−1) 40.0 (−1) 15.505 11.986 3.519 24 2.2 (−1) 15.0 (−1) 72.0 (+1) 60.0 (+1) 49.382 42.135 7.247 17 8.8 (+1) 35.0 (+1) 24.0 (−1) 40.0 (−1) 53.586 56.072 −2.486
21c 5.5 (0) 25.0 (0) 48.0 (0) 50.0 (0) 65.196 69.144 −3.948
Table 3 Representative FTIR spectra (cm−1) of dihydrocaffeic acid ester
a Dihydrocaffeic acid b H-bond lattice
Frequency range (cm−1) Frequency (cm−1) Functional groups
DHCAa Hexyl dihydrocaffeate
3500–3200 3338 3502b, 3386 O–H stretching
3000–2850 2925–2869 2917–2856 C–H stretching
1760–1690 1668 1705 C=O stretching
1600–1400 1525–1441 1608–1534 C=C stretching
1320–1000 1207–1286 1192–1261 C–O stretching
grades purchased from Fisher Scientific, Inc. (Slangerup, Denmark). Thin-layer chromatography (TLC) with a sil-ica gel 60F254 plate no. 5715 was obtained from Merck (Darmstadt Germany).
Experimental design
The effect of four factors [i.e. X1 (dihydrocaffeic acid
to hexanol molar ratio of 1:0.5–1:2); X2
(immobilized-enzyme amount 15–35% by the total weight of sub-strates); X3 (reaction time of 24–72 h) and X4 (reaction
temperature of 40–60 °C)] were selected for the synthesis of hexyl dihydrocaffeate as a response variable and was assessed using RSM (Table 4). Central composite design (CCD), as a statistical method, was employed to inves-tigate the major and combined effects of all independ-ent variables on the degree of esterification, to generate a model between variables and finally, to evaluate the effect of these parameters in order to optimize the reac-tion condireac-tions for the synthesis of hexyl dihydrocaffeate
enzymatically leading to the desired goal. MINITAB v16 statistical package (Minitab Inc., State College, PA, USA) software was applied for generating experimental design matrix, data analysis and optimization procedure.
As presented in Table 2, 30 experimental runs along with center point which was repeated six times, were assigned using a second order composite design tak-ing into account four independent variables at five levels of each factor [30]. The treatments were randomized in order to reduce the impact of unexplained variability in the actual response owing to extraneous parameters.
Statistical analysis
Analysis of variance and regression analysis were car-ried out to determine statistically significant model terms and regression coefficients, fitting of mathematical mod-els to the experimental data aiming at an overall optimal region and high composite desirability for the response variable. Multiple regression coefficients were employed
Fig. 4 NMR spectrum of hexyl dihydrocaffeate
Table 4 Levels of independent variables established according to central composite design for enzymatic esterification of hexyl dihydrocaffeate condition level (coded and, un coded)
a Reaction time (h) b Reaction temperature (°C)
c Concentration of hexanol (substrate molar ratio was selected correspondingly to 0.5 − 2((2.2–8.8) × 10−4 mM) of hexanol to dihydrocaffeic acid (4.4 × 10⁻⁴ mM) d 15–35% relative to the total weight of substrates
Independent variable Independent variable level
Low (−1) Medium (0) High (+1) Axial (−1.66) Axial (+1.66)
Reaction timea 24 48 72 8.0 88.0
Reaction Tempb 40 50 60 33.3 66.7
Conc. of hexanolc 2.2 5.5 8.8 0.0 11.0
by applying the least-squares technology [33] to predict the linear, quadratic polynomial models and also inter-active effects between tested parameters for response function. The mathematical relationship among factors and response was expressed in the quadratic polynomial Eq. 2:
where: Y is the predicted response value, β0 is constant, βi, βii and βij are the linear, quadratic and interaction regression coefficients of RSM model, and Xi and Xj are the factor variables.
The individual linear, quadratic and interaction effects and also regression coefficients terms of tested parame-ters were presented by the ANOVA results. According to the F-ratio at P-value of 0.05; the significance of the equa-tion parameters for response based on model analysis, coefficient of determination (R2 = at least 0.80) analysis
as outlined and the suitability of the model were evalu-ated [29, 34, 35].
Optimization procedure
The optimization procedure was employed to acquire the optimal levels of four independent variables (X1, X2, X3
and X4) after producing the polynomial regression
equa-tion concerning the factors studied. By choosing desired goal for the variable, numerical optimization was per-formed to evaluate the exact optimum level of factors leading to the desired enzymatic synthesis conditions in terms of percent of dihydrocaffeic acid conversion. Optimum conditions that depended on the factors, were achieved through the predicted equation evaluated using RSM. Moreover, for deducing workable optimal condi-tions, a graphical technique was applied [36, 37]. Gener-ally, the three-dimensional (3D) response surface plots were employed for visualizing the relationship between experimental levels for each independent variable and the response and also for deducing the optimal condi-tions [30, 38]. In order to interpret graphical interaction of the four factors studied (graphical optimization), the 3D response surface plots were plotted by altering two variables in the experimental range and keeping the other two variables constant at the center point.
Model verification
Model validation was done theoretically by comparing the experimental data and predicted values. This was employed to assess the adequacy of the final reduced model equation obtained using two-sample T test. There must be close agreement between the predicted and experimental values and no significant difference existing
(2)
Y =β0+ 4
i=1 βiχi+
4
i=1 βiiχi2+
3
i=1 4
j=i+1 βijxixj
for model adequacy validation. Experiments under the suggested optimum conditions were tested to verify the suitability of response model for predicting optimum data as well.
Enzymatic esterification of dihydrocaffeic acid with hexanol in ionic liquid
The enzymatic esterification of DHCA was performed in ionic liquid (1-buthyl-3-methylimidazoliumbis (trif-luoromethylsulfonyl) imide). A fixed amount of DHCA (4.4 × 10⁻⁴ mM) with different quantities of hexanol,
according to the substrate mole ratios presented in Table 2, were introduced into the test tubes which con-tained various dosages of the powdered C. antarctica
lipase in ionic liquid as a medium. Typical reactions were conducted in the presence of activated 3Å molec-ular sieves as by-product (water) eliminating substance. The reactions were performed in an incubator equipped with a shaker operating at 250 rpm, under various tem-peratures and times (Table 2). With the removal of the biocatalyst, the reaction was terminated and then, quan-titative analysis of the synthesized esters was carried out by HPLC.
Ester purification
The alkyl dihydrocaffeate esters were obtained by extract-ing each reacted solution in diethyl ether. The ether layer was dried over sodium sulfate and filtered [39]. In each case, the filtrate was evaporated to dryness under reduced pressure. The extract was applied onto a silica gel column (2.5 × 30 cm, fractions of 50 mL), which washed with 200 mL of chloroform (100%) and 400 mL of (99:1–98:2%) chloroform–methanol mixture respec-tively for eluting the unreacted substrates. The formed ester product was detected by thin-layer chromatography (TLC) [40] or HPLC methods.
Degree of esterification
The following equation was employed [28] to calculate the degree of esterification from the HPLC profile:
where Atp is the total peak area of dihydrocaffeic acid, Atpe is the total peak area of hexyl dihydrocaffeate and
1.462 is the ratio of the average molecular weight of hexyl dihydrocaffeate to the average molecular weight of dihy-drocaffeic acid.
Characterization of purified product
HPLC analysis
The reaction components were diluted with methanol and filtered using syringe filter (0.22 µm). A 10 µL ali-quot was taken from the reaction mixture and injected
Degree of esterification(%)=Atpe/
in HPLC (Agilent 1200 series, Waldbrunn, Germany) equipped with a C18 reverse-phase capillary column (250 × 4.6 mm, 5 µL) as well as an ultraviolet detector at wavelength range of 200–325 which was applied for DHCA evaluation. The injected samples were eluted by mobile phases including: 90% of solvent A and 10% of solvent B [namely methanol (pre-dried over 3 Å molec-ular sieves) and 0.75% of acetic acid in distilled water respectively] at a flow rate of 1 mL/min for 16 min [41].
Fourier transforms infrared (FTIR) and nuclear magnetic resonance (NMR) analysis
Fourier transform infrared (FTIR) and nuclear magnetic resonance (NMR) spectroscopy were used for charac-terization of each alkyl dihydrocaffeate. The functional groups of each synthesized compound were identified by Perkin Elmer spectrum 100 Series spectrometer (United Kingdom) facilitated with a mid-infrared detec-tor-DTGS (deuterated triglycine sulphate). Each syn-thesized product was dispersed in potassium bromide pellet and compressed into a disc by pressure. Then the IR spectrum of each sample was recorded. The resultant FTIR spectrum in the 4000–280 cm−1 regions with
res-olution of 4 cm−1. Nuclear magnetic resonance (NMR)
spectra were recorded on Varian 500 MHz-NMR Spec-trometer. The synthesized product was dissolved in methanol-d4 and the chemical shifts were given on the parts per million scales with TMS as an internal standard.
Abbreviations
ANOVA: analysis of variance; CCD: central composite design; D: desirability; DHCA: dihydrocaffeic acid; DMSO: dimethyl sulfoxide; DTGS: deuterated triglycine sulphate; ILs: ionic liquids; NMR: nuclear magnetic resonance; FTIR: Fourier transforms infra-red.
Authors’ contributions
SG carried out all the experiments, data analysis and interpretations. OL, CP, FA and SW have critically reviewed the content of this manuscript. OL has made intellectual contributions and given the final approval for the manuscript to be published. All authors read and approved the final manuscript.
Author details
1 Department of Food Technology, University Putra Malaysia, 43400 Serdang, Selangor, Malaysia. 2 Department of Food Science, University Putra Malaysia, 43400 Serdang, Selangor, Malaysia. 3 Laboratory of Natural Products, Institute of Bioscience, University Putra Malaysia, 43400 Serdang, Selangor, Malaysia.
Acknowledgements
This study was supported by University Putra Malaysia Research Grant No: 5524558.
Competing interests
The authors declare that they have no competing interests.
Publisher’s Note
Springer Nature remains neutral with regard to jurisdictional claims in pub-lished maps and institutional affiliations.
Received: 16 August 2016 Accepted: 23 May 2017
References
1. Decker E (1998) Strategies for manipulating the prooxidative/antioxida-tive balance of foods to maximize oxidaprooxidative/antioxida-tive stability. Trends Food Sci Technol 9:241–248
2. Figueroa-Espinoza M-C, Villeneuve P (2005) Phenolic acids enzymatic lipophilization. J Agric Food Chem 53:2779–2787
3. Khadem S, Marles RJ (2010) Monocyclic phenolic acids; hydroxy-and polyhydroxybenzoic acids: occurrence and recent bioactivity studies. Molecules 15:7985–8005
4. Gauthier L, Verdal M-N, Marchegay G, Pinson-Gadais L, Ducos C, Richard-Forget F, Atanasova-Penichon V (2016) Fungal biotransformation of chlorogenic and caffeic acids by Fusarium graminearum: new insights in the contribution of phenolic acids to resistance to deoxynivalenol accumulation in cereals. Int J Food Microbiol 221:61
5. Lu Y, Luthria D (2016) Influence of gelatinization on the extraction of phenolic acids from wheat fractions. Food Chem 194:1138–1142 6. Pietta P-G (2000) Flavonoids as antioxidants. J Nat Prod 63:1035–1042 7. Huang W-Y, Cai Y-Z, Zhang Y (2009) Natural phenolic compounds from
medicinal herbs and dietary plants: potential use for cancer prevention. Nutr Cancer 62:1–20
8. Ingraham LL, Corse J (1951) Enzymatic browning of fruits. I. Autoxidation of chlorogenic acid. J Am Chem Soc 73:5550–5553
9. Katsoura M, Polydera A, Tsironis L, Tselepis A, Stamatis H (2006) Use of ionic liquids as media for the biocatalytic preparation of flavonoid deriva-tives with antioxidant potency. J Biotechnol 123:491–503
10. Eastoe J, Gold S, Rogers SE, Paul A, Welton T, Heenan RK, Grillo I (2005) Ionic liquid-in-oil microemulsions. J Am Chem Soc 127:7302–7303 11. Couling DJ, Bernot RJ, Docherty KM, Dixon JK, Maginn EJ (2006) Assessing
the factors responsible for ionic liquid toxicity to aquatic organisms via quantitative structure–property relationship modeling. Green Chem 8:82–90
12. Zhao D, Liao Y, Zhang Z (2007) Toxicity of ionic liquids. Clean Soil Air Water 35:42–48
13. De Diego T, Lozano P, Gmouh S, Vaultier M, Iborra JL (2005) Understand-ing structure-stability relationships of candida a ntartica lipase b in ionic liquids. Biomacromol 6:1457–1464
14. Kaar JL, Jesionowski AM, Berberich JA, Moulton R, Russell AJ (2003) Impact of ionic liquid physical properties on lipase activity and stability. J Am Chem Soc 125:4125–4131
15. Kim M-J, Choi MY, Lee JK, Ahn Y (2003) Enzymatic selective acylation of glycosides in ionic liquids: significantly enhanced reactivity and regiose-lectivity. J Mol Catal B Enzym 26:115–118
16. Lozano P, De Diego T, Carrie D, Vaultier M, Iborra J (2001) Over-stabili-zation of Candida antarctica lipase B by ionic liquids in ester synthesis. Biotech Lett 23:1529–1533
17. Persson M, Bornscheuer UT (2003) Increased stability of an esterase from Bacillus stearothermophilus in ionic liquids as compared to organic solvents. J Mol Catal B Enzym 22:21–27
18. Park S, Kazlauskas RJ (2001) Improved preparation and use of room-temperature ionic liquids in lipase-catalyzed enantio- and regioselective acylations. J Organ Chem 66:8395–8401
19. Park S, Kazlauskas RJ (2003) Biocatalysis in ionic liquids—advantages beyond green technology. Curr Opin Biotechnol 14:432–437
20. Van Rantwijk F, Sheldon RA (2007) Biocatalysis in ionic liquids. Chem Rev 107:2757–2785
21. Yang Z, Feddern V, Glasius M, Guo Z, Xu X (2011) Improved enzymatic production of phenolated acylglycerols through alkyl phenolate interme-diates. Biotech Lett 33:673–679
22. Yang Z, Pan W (2005) Ionic liquids: green solvents for nonaqueous bioca-talysis. Enzym Microb Technol 37:19–28
23. Miyake Y, Yamamoto K, Osawa T (1997) Metabolism of antioxidant in lemon fruit by human intestinal bacteria. J Agric Food Chem 45:3738 24. Lasekan O, Salva TJ, Abbas K (2009) Effect of malting conditions and
25. Xin J-Y, Zhang L, Chen L-L, Zheng Y, Wu X-M, Xia C-G (2009) Lipase-catalyzed synthesis of ferulyl oleins in solvent-free medium. Food Chem 112:640–645
26. Gardas RL, Coutinho JA (2008) A group contribution method for viscosity estimation of ionic liquids. Fluid Phase Equilib 266:195–201
27. Liu L, Jin C, Zhang Y (2014) Lipophilic phenolic compounds (Lipo-PCs): emerging antioxidants applied in lipid systems. RSC Adv 4:2879–2891 28. Tan Z, Shahidi F (2012) Optimization of enzymatic synthesis of
phytos-teryl caprylates using response surface methodology. J Am Oil Chem Soc 89:657–666
29. Joglekar A, May A (1987) Product excellence through design of experi-ments. Cereal Foods World 32:857
30. Montgomery DC, Runger GC, Hubele NF (2009) Engineering statistics. Wiley, Hoboken
31. Mason RL, Gunst RF, Hess JL (2003) Statistical design and analysis of experiments: with applications to engineering and science, vol 474. Wiley, Hoboken
32. Vining GG, Kowalski S (2010) Statistical methods for engineers. Cengage Learning, Boston
33. Myers RH, Montgomery DC, Anderson-Cook CM (2016) Response surface methodology: process and product optimization using designed experi-ments. Wiley, Hoboken
34. Lee J, Ye L, Landen WO, Eitenmiller RR (2000) Optimization of an extrac-tion procedure for the quantificaextrac-tion of vitamin E in tomato and broccoli using response surface methodology. J Food Compos Anal 13:45–57
35. Weng W-L, Liu Y-C, Lin C-W (2001) Studies on the optimum models of the dairy product Kou Woan Lao using response surface methodology. Asian Australas J An Sci 14:1470–1476
36. Floros J, Chinnan M (1988) Computer graphics- assisted optimization for product and process development. Food Technol 42:72–78
37. Giovanni M (1983) Response surface methodology and product optimi-zation. Food Technol 37(11):41–45
38. Lasekan O (2011) Headspace solid-phase microextraction analysis of the volatile flavour compounds of roasted chickpea (Cicer arietinum L.). J Food Process Technol 2:1
39. Borneman WS, Hartley RD, Morrison WH, Akin DE, Ljungdahl LG (1990) Feruloyl and p-coumaroyl esterase from anaerobic fungi in relation to plant cell wall degradation. Appl Microbiol Biotechnol 33:345–351 40. Nagaoka T, Banskota AH, Tezuka Y, Saiki I, Kadota S (2002) Selective
anti-proliferative activity of caffeic acid phenethyl ester analogues on highly liver-metastatic murine colon 26-L5 carcinoma cell line. Bioorg Med Chem 10:3351–3359
![Fig. 1 Esterification of DHCA in 1–3 days by varying molar ratio of dihydrocaffeic acid to hexanol: solution 1 (1:2), solution 2 (1:4), solution 3 (1:8) and solution 4 (1:16) keeping all other parameters constant [at temperature 55 °C and 250 rpm in ionic liquid (1-butyl-3 methylimidazolium)bis (trifluoromethylsulfonyl) imide]](https://thumb-us.123doks.com/thumbv2/123dok_us/393913.2036732/2.595.59.292.513.669/esterification-dihydrocaffeic-solution-solution-parameters-temperature-methylimidazolium-trifluoromethylsulfonyl.webp)