Issues
ISSN: 2146-4138
available at http: www.econjournals.com
International Journal of Economics and Financial Issues, 2015, 5(Special Issue) 47-53.
Economics and Society in the Era of Technological Changes and Globalization
The Experience of Factor Analysis of Conditions for Human
Capital Formation and Development in Russian Federation
Olga Vitalyevna Zaborovskaya
1*, Ekaterina Vasilyevna Plotnikova
2, Elena Evgenyevna Sharafanova
31State Institute of Economics, Finance, Law and Technology, Ul. Roshchinskaya 5, Gatchina 188350, Russia, 2Peter the Great
St. Petersburg Polytechnic University, Ul. Polytechnicheskaya 29, Saint Petersburg 195251, Russia, 3Saint-Petersburg State
University of Economics, Ul. Sadovaya 21, Saint Petersburg 191015, Russia. *Email: [email protected]
ABSTRACT
The article suggests a factor analysis procedure for assessment of conditions for human capital formation and development (CHCFD) in the Russian Federation (RF) for Russian environment. This assessment integrates 21 private index, which measures the deviation of the actual CHCFD in the RF and Federation constituent entities, from the best ones, achieved in any Russian region. Data base for calculations is the official statistics, presented in the period from 1999 to 2012. The factors are the irregularity coefficients of indices achievement, characterizing the CHCFD in the regions of the RF. The calculation results of influence of factors on the deviation of CHCFD in whole in RF are presented, and the analysis of territorial differences is carried out. There was determined the distribution of factor values, that influenced much on assessment of CHCFD, per Federal Districts (macroregions), different variation of factors was revealed. Intra-regional differences were analyzed based on distribution of factors that influenced much on the assessment of CHCFD, per the constituent entities of the Federation of the Northwestern Federal District. There were determined the regions, that had the most and the least favorable conditions from the positions of human capital. There was determined a possibility to collate the indices as per the share of influence on the assessment value, presenting the basis to determine the priorities in development of regional policy of human capital formation and development.
Key words: Human Capital, Factors of Development, Regional Policy, Regional Economy
JEL Classifications: J24, C31, Z13, H76
1. INTRODUCTION
A wide circle of scientific works of the researchers from the whole world is devoted to the study of different aspects of human capital (Becker, 1962; Schultz, 1961; Ben-Porath, 1967; Nelson and Phelps, 1966; Kiker, 1966, Gennaioli et al., 2013; Dyatlov, 1994; Kapelyushnikov, 2012; Gratsinskaya and Pogosyan, 2012; Nureev, 2010; Kurgansky, 2011; Iyere Joseph and Aibieyi, 2014).
They are focused on such problems, as determination of structure of human capital, of the factors, influencing on its volume, determination of effects from the investing to human capital at the level of individual, social and economic systems of different levels. Highlighting of different levels of social and economic
systems presupposes corresponding hierarchy of management tasks. For Russian environment, it is reasonable to consider the levels of the company, region, Federal District (as macroregion) and Federal Center. In order to develop the regional economy, the urgent problem is to reveal key factors, contributing to the development of human capital of the required quality, able to provide the competitive advantages. For Russian environment, regional management level is the basic one due to existing interregional differentiation of social and economic development and federative state structure.
processes, providing an opportunity to evaluate the changes, taking place in the region. Possible approach to the solution of this problem, based on the concept of “ideal” system, taking into consideration the specificity of Russian state structure and statistic base, as well as feasibility of these purposes, was presented in the work (Zaborovskaia et al., 2014). Implementation of this approach provided an opportunity to create a complex of integral assessments of CHCFD for Russian regions and to evaluate their dynamics. When determining the list of factors, the authors (Zaborovskaia et al., 2014) judged from the key role of educational system in human capital formation and development (Rodionov et al., 2014; Abel and Deitz, 2011; Rodionov et al., 2014; Rodionov et al., 2014).
For regional management, it was necessary to make the following step in the investigation, namely, to analyze the influence of factors, included to the integral index, on its value in Russian regions. Thus, the most significant problems in regional human capital management are determined; the critical points, requiring budgetary resources, are revealed. Current article presents some results, obtained in the course of study of the abovementioned factors.
2. DATA AND METHOD
The data of state statistics per the regions-constituent entities of the Russian Federation (RF) and Federal Districts (macroregions) present the database to calculate the assessments of CHCFD. The algorithm of assessment and analysis of CHCFD in the region was suggested by Zaborovskaya nearly 10 years ago (Zaborovskaia et al., 2014; Zaborovskaya, 2005). The experience of use has shown, that the assessment of CHCFD allows solving the tasks of classification and grouping of regions in compliance with CHCFD (Zaborovskaya, 2005). However, more substantial analysis is possible based on determination of influence of each of 21 factors, determining the level and dynamics of CHCFD, which is calculated as the geometric average of the partial coefficients of inequality (Zaborovskaia et al., 2014; Zaborovskaya, 2005):
Kij =(lΠ=kijl)
1 21 1
21
Where Kij is the assessment of CHCFD in j region in i-time period;
kijl is the value of l coefficient of inequality (l = (1,21), Table 3.2.2)
in j-region in i-time period.
This assessment is non-dimensional; it is varied over the segment [0,1], and its growth shows the improvement of CHCFD in the region.
Let us present the list of basic indices, the calculation rules for the inequality coefficient (IC) and record determination (RD), forming the quantitative basis of the study (note: The indices 12-21 are determined per 100,000 people, the records per these indices are determined based on maximum value):
1. Gross regional product per capita; IC: k a a
ijBP ij
BP
iBP
= * ;
RD: a iBP a
ijBP
* =max( )
2. Unemployment rate; IC: k a a a a ijb ib iYH ij b ijYH 3 3 3 = * * ;
RD: a ib a
ijb
* 3=min( 3)
3. Crude birth rate; IC: k a a
ijP ij
P
i P
=
* ; RD: a*iP =max(aijP)
4. Crude death rate; IC: k a a
ijC ij
C
iC
= * ; RD: a iC a
ijC
* =min( )
5. Morbidity rate per 1000 people of population; IC: k a a ij ij i 3 3 3 = * ;
RD: a*i3=min(aij3)
6. Relative estimate of atmosphere pollution; IC: k a a
ijA ij
A iA 3 3 3 = * ;
RD: a iA a
ijA
* 3=max( 3)
7. Food rationality (per product groups); RD: Closeness to 1;
IC: kij aijf k k Π = =
∏
( ) 1 8 18a a
a if a a
a if a
ijf
ijf
ijf ij
f
ijf
ijf ij
f k k k k k k k = ⋅ ≥ ⋅ * , , * , 1 1
8. Family stability; IC: k a a
ijYC ij
YC
i YC
= * ; RD: a*iyc =min(aijyc)
9. Criminogenity level; IC: k a a
ijKP ij
KP
iKP
= * ;
RD:a iKP a
ijKP
* =min( )
10. Theatre attendance; IC: k a a
ijKP ij
KP
iKP
= * ;
RD: a*iT =max(aijT)
11. Museum attendance; IC: k a
a
ijM ij
M
iM
=
* ;
RD: a iM a
ijM
* =max( )
12. Number of preschools; IC: k a
a
ijAAOY ij
AAOY
iAAOY
=
* ; RD:
a*iAAOY =max(aijAAOY)
13. Number of state and municipal daytime comprehensive
educational institutions; IC: k a
a
ijMAOY ij
MAOY i MAOY Γ Γ Γ = *
14. Number of private daytime comprehensive educational
institutions; IC: k a
a
ijH AOY ij
H AOY
iH AOY
Γ Γ
Γ =
*
15. Number of institutions of initial vocational education;
IC: k a
a
ijH O ij
H O
iH O
Π Π
Π =
*
16. Number of private specialized secondary schools;
IC: k a
a
ijH CCY ij
H CCY
iH CCY
Γ Γ Γ 3 3 3 = *
17. Number of state and municipal specialized secondary schools;
IC: k a
a
ijMCCY ij
MCCY iMCCY Γ Γ Γ 3 3 3 = *
18. Number of private higher educational institutions;
IC: k a
a
ijH BY ij
19. Number of state and municipal higher educational institutions;
IC: k a
a
ijMBY ij
MBY
iMBY
Γ Γ
Γ
3 3
3
=
*
20. Number of institutions for Ph.D. candidates training;
IC: k a
a
ijOA ij
OA
i OA
=
*
21. Number of institutions for doctoral candidates training;
IC: k a
a
ijOA ij
OA
i OA
=
*
Theoretically, it is impossible to exclude the situation, when one or several indices will be equal to zero. In this case, the region gets zero Kij even in case of high values of other factors (IC). Consequently, there is a need to reduce to the similar (interpreted) type of assessment, calculated per regions, in order to exclude (eliminate) the influence of factors, which value is equal to zero.
The analysis of statistical data showed that these factors involve the following (listed in decreasing order of occurrence rates of zero values of indices):
• Number of institutions for doctoral candidates training; • Number of private specialized secondary schools; • Number of private higher educational institutions;
• Number of private daytime comprehensive educational institutions.
Reduction of assessments to the consistent type per all data set is carried out in the following order:
• “Roughening” of assessment is carried out, when small to negligible, but not zero value of indices is set; they “re-zero” the integral assessment (for instance, at the level, equal to 0.01); • The influence of “re-zeroing” indices is eliminated.
It is possible to eliminate the influence of the abovementioned indices on the change of assessment of CHCFD in the region on the basis of standard methods of factor analysis, particularly, the way of chain substitutions. The essence of modification is the following: • Only those factors are eliminated, that result in the loss of
assessment significance of CHCFD in the region;
• It is assessed the influence of factor change on the change of successful index not within two time periods, but the influence of factor on the level of successful index in the definite time period;
• The influence of factor is excluded due to the fact, that the value of the eliminated index is taken to be equal to 1, providing an opportunity to exclude the unevenness of development of regions per the abovementioned factor.
Conditional assessments are evaluated for it:
• Kijyjy 1, eliminating the influence of IC of number of
institutions for doctoral candidates training, per 100 thousand people:
Kijyjy kijBP k k k k k k k k
ijb ijP ijC ij ijA ij ijYC ij
1
3 3 3
=( Π* * * * * * Π* * KKP
ijT ijM ijAAOY ijMAOY ijH AOY ijH O
ijH CCY
k k k k k k
k k
*
* * * * * *
*
Γ Γ Π
Γ 3
iijΓMCCY3 kijH BYΓ 3 kijΓMBY3 kijOA
1 21
* * * )
• Kijyjy 2, eliminating the influence of IC number of institutions
for doctoral candidates training, per 100,000 people and influence of IC of number of private higher educational institutions per 100,000 people:
Kijyjy kijBP k k k k k k k k
ijb ijP ijC ij ijA ij ijYC ij
2
3 3 3
=( Π* * * * * * Π* * KKP
ij T
ijM ijAAOY ijMAOY ijH AOY ijH O
ijH CCY
k k k k k k
k k
* * * * * * *
*
Γ Γ Π
Γ 3
iijΓMCCY3 kijΓMBY3 kijOA
1 21
* * )
• Kijyij3, eliminating the influence of coefficients: Inequality of number of institutions for doctoral candidates training, per 100,000 people; inequality of number of private higher educational institutions per 100,000 people; inequality of number of private specialized secondary schools per 100,000 people:
Kijyjy 3 kijBP k kij ijP kijC k kij ijA kij kijYC kijK
3 3 3
=( Π* * * * * * Π* * PP ijT
ijM ijAAOY ijMAOY ijH AOY ijH O
ijMCCY i
k
k k k k k
k k
*
* * * * * *
*
Γ Γ Π
Γ 3
jjMBY kijOA
Γ 3* )121
• Kijyij4, eliminating the influence of ICs: Number of institutions for doctoral candidates training, per 100,000 people; number of private higher educational institutions per 100,000 people; number of private specialized secondary schools per 100,000 people; number of private daytime comprehensive educational institutions per 100,000 people.
Kijyjy 4 kijBP k kij ijP kijC k kij ijA kij kijYC kijK
3 3 3
=( Π* * * * * * Π* * PP ijT
ijM ijAAOY ijMAOY ijH O ijMCCY ijMBY i
k
k k k k k k k
* *
* * Γ * Π * Γ 3* Γ 3* OAjj )121
ICs of number of institutions for doctoral candidates training and number of private higher educational institutions per 100,000 people are taken to be equal to 1:
kijO= 1, k
ijH BYΓ 3 = 1
What means, that the number of institutions for doctoral candidates training, the number of private higher educational institutions, the number of private specialized secondary schools and the number of private daytime comprehensive educational institutions per 100,000 people. In j-region in i-time period equals to record-breaking (the maximum value). This assumption allows leveling the CHCFD per these four indices at the levels of their record values in each time period of the analyzed interval.
The last assessment excludes “re-zeroing,” and it is taken as the operating one during the analysis.
When calculating the influence of factors on change of assessment of CHCFD in the region, for the successful KijR, it is necessary to
use one of the indices Kij, Kijyjy1, Kijyjy2, Kijyjy3, Kijyjy4. It is selected in the following way. If for some region j in the definite time period i:
• aijOA a a a K K
ijH BY ijH CCY ijH AOY ijR ij
≠0, Γ 3≠0, Γ 3≠0, Γ 3≠0,then = ;
• aijOA K K
ijR ijyjy
=0 =
1
, then
• aijH BY K K
ijR ijyjy
Γ 3
0
2
• aijH CCY K
ijR ijyjy
Γ 3 0
3
= ,then K = ;
• aijH AOY K K
ijR ijyjy
Γ 3 0
4
= , then = .
Then, there is the subsequent elimination of influence of factors-multipliers by the estimate KijR, meaningfully denoting the
equation of CHCFD of the region per the eliminating factor at the level of its record value, equal to 1. A standard method of chain substitution is used for it.
As it is possible to juxtapose each index-factor of assessment of CHCFD with the responsible area of departments of regional authorities, then this procedure of analysis allows determining the sphere of competence and responsibility of state and regional authorities for the changes of definite factors for human capital formation and development.
3. ANALYSIS AND RESULTS
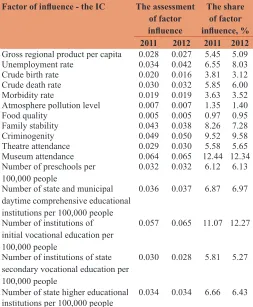
In accordance with the analysis methodology, based on the data of Federal State Statistics Service, there were calculated the assessments of influence of factors - ICs of indices on the deviation of assessments of CHCFD from the maximum possible value, equal to 1. The results of calculations are presented in Table 1.
Table 1 shows that the maximum influence on deviation of CHCFD in whole in the RF is made by the indices of availability of culture and education services. Thus, the share of influence on
deviation from the record unit value of assessment of CHCFD “museum attendance factor was 12.44% in 2011 and 12.34% in 2012”; a factor “The number of institutions of initial vocational education per 100,000 people” was 11.07% in 2011 and 12.27% in 2012. The influence of criminogenity factor is also very high: The share of its influence was 9.52% in 2011, and it increased up to 9.58% in 2012. The group of factors, influencing negatively on the assessment under study, involves the factor “Family stability” (The share of its influence was 8.26% in 2011 and 7.285 in 2012).
The factors “Level of atmosphere pollution” (1.35% in 2011 and 1.4% in 2012); “Morbidity rate” (3.63% in 2011 and 3.52% in 2012); “Crude birth rate” (3.81% in 2011 and 3.12% in 2012) influenced least of all on the assessment of CHCFD.
Let us illustrate the territorial differences of influence of the factors under study at the example of the first group, according to the data for 2012. The distribution of assessments per Federal Districts is presented in Table 2.
The calculations testify about different variations of the considered factors per Federal Districts. Their variation, relatively the value of the RF in whole, is the following:
• Per the factor “Family stability” 25.7%; • Per the factor “Criminogenity” 21.7%; • Per the factor “Museum attendance” 31.3%; • Per the factor “Number of NPO institutions” 9.6%.
Let us consider the influence of the studied group of factors on the assessment of CHCFD per the constituent entities of the Federation of Northwest Federal District. Of all four factors, only one, the museum attendance, is slightly lower, than the value of factor, typical of RF in whole (Table 3).
The most favorable CHCFD per the factor “Family stability” are in St. Petersburg (0.670), the Republic of Karelia (0.648), the Komi Republic (0.644); the least favorable ones are in the Murmansk Region (0.529), the Novgorod Region (0.492), the Leningrad Region (0.459). Per the factor “Criminogenity,” the most favorable conditions in the analyzed period were observed in the Komi Republic (0.731), St. Petersburg (0.725), the Republic of Karelia (0.724); the least favorable ones are in the Murmansk and Novgorod regions (0.631), the Kaliningrad Region (0.585) and the Leningrad Region (0.513). Per the factor “Museum attendance,” the number of leading regions included the Komi Republic (0.823), the Republic of Karelia (0.791), The Vologda Region (0.773); the triplet of outsiders is presented by the Novgorod Region (0.668), the Kaliningrad Region (0.626) and the Leningrad Region (0.561). Per the factor “Number of NPO institutions,” the leaders are presented by the Vologda Region (0.910), the Komi Republic (0.905), the Republic of Karelia (0.901); the outsiders are the Novgorod Region (0.843), the Kaliningrad Region (0.865), the Leningrad Region (0.782).
Summarizing the results according to the principle of regularity of the region to the group of leaders or outsiders, we can say, that the most serious problems with the CHCFD are typical for such
Table 1: The analysis of influence of factors on the assessment of CHCFD in the RF
Factor of influence ‑ the IC The assessment
of factor influence
The share of factor influence, %
2011 2012 2011 2012
Gross regional product per capita 0.028 0.027 5.45 5.09
Unemployment rate 0.034 0.042 6.55 8.03
Crude birth rate 0.020 0.016 3.81 3.12
Crude death rate 0.030 0.032 5.85 6.00
Morbidity rate 0.019 0.019 3.63 3.52
Atmosphere pollution level 0.007 0.007 1.35 1.40
Food quality 0.005 0.005 0.97 0.95
Family stability 0.043 0.038 8.26 7.28
Criminogenity 0.049 0.050 9.52 9.58
Theatre attendance 0.029 0.030 5.58 5.65
Museum attendance 0.064 0.065 12.44 12.34
Number of preschools per
100,000 people 0.032 0.032 6.12 6.13
Number of state and municipal daytime comprehensive educational institutions per 100,000 people
0.036 0.037 6.87 6.97
Number of institutions of initial vocational education per 100,000 people
0.057 0.065 11.07 12.27
Number of institutions of state secondary vocational education per 100,000 people
0.030 0.028 5.81 5.27
Number of state higher educational
institutions per 100,000 people 0.034 0.034 6.66 6.43
regions of the Northwest Federal District, as the Leningrad Region, the Novgorod Region, the Kaliningrad Region. The most favorable conditions are in the Republic of Karelia, the Komi Republic and in St. Petersburg.
The share of influence of the factor on the assessment of CHCFD reflects the urgency of problems, characterized by this index, and the collating of indices per the share of influence on the assessment value can be the basis to determine the priorities, when developing regional policy of human capital formation and development.
4. DISCUSSION
The works, devoted to the study of human capital, mainly deal with the problems, connected with the study of essence and content of the human capital, its relations with other economic categories, the influence on economic growth (Becker, 1962; Kapelyushnikov, 2012; Nureev, 2010) the investments of resources to the human capital and their return (Schultz, 1961; Ballester et al., 2002). The works, where the human capital is considered from the positions of multilevel models (Ployhart and Moliterno, 2011; Kozlowski and Klein, 2000) are of great interest from the viewpoint of assessment of conditions for human capital formation at regional level. At that, the work (Ployhart and Moliterno, 2011; Sharafanova and Kotov, 2011) thoroughly studies, how the theory of human capital is manifested at different levels, how the individual skills, abilities and knowledge transform into the resource, taking into consideration the influence of environment. A part of scientific works in the sphere of human capital is devoted to the assessment of influence of human capital on the development of economy, including the regional one (Korchagin, 2005; Stark and Wang, 2002; Gennaioli et al., 2013).
The interconnections of level of human capital formation and migration problems are studied in the work (Stark and Wang, 2002). However, these studies do not consider the problem of assessment of CHCFD in the definite territory, which can be the basis for appropriate updating of social and economic policy.
The work (Zaborovskaia et al., 2014) provides an attempt to present the methodology of assessment of CHCFD for the regional level, taking into consideration the peculiarities of statistic observation in Russia; the corresponding integral assessments were received there. These assessments provided an opportunity to build a rating of regions from the viewpoint of favorability or unfavorability of CHCFD. This study was continued by the team of authors in the part of factor analysis, which allows revealing the most urgent problems and highlighting the spheres that require the increased attention on the part of both
Federal Center and regional authorities. The results of the study showed a high degree of inequality of social and economic space in Russia and regional development. The inequality is mainly shown in the availability of cultural values and possibilities to consume the cultural services. The next significant factor was the factor, providing the required educational level. If to take into consideration, that the basic elements of human capital are health, education and culture, it is necessary to study thoroughly the reasons of existing inequality and to develop the instruments to overcome it.
5. SUMMARY
The creation of integral index of assessment of CHCFD in the region and the subsequent factor analysis can be used to update the instrumentarium of regional social and economic policy. Thus, the suggested assessments can be the indicator of favorable and unfavorable consequences of regional policy implementation, to estimate the correlation of development of the regions, included to macroregions (Federal Districts), to create the ratings of regional development. For the Federal Center, it can become the basis for differentiated approach to financial support of social development of the regions. The addition of factor analysis to the obtained assessments provides an opportunity to distinguish both intraregional priorities in human capital management, and to determine the sharpest (critical) problems in interregional cut. It provides an opportunity to substantiate the point centers of budgetary resources, provided by the Federal Center for the regions, to forecast the changes in CHCFD in dependence on the change of features of the regional social sphere. Thus, the results of study can be practically used both by the governing bodies of the constituent entities of the RF and the Federal Ministries, determining the priorities of social development of the regions and the direction of their reforming. At that, the areas of responsibility of governing bodies for the change of factors, influencing on the factors for human capital formation and development in the region, are determined.
Prospects for further development of this topic are connected with overcoming of some restrictions of this study.
First of all, it deals with the substantiation of definite responsibility areas of governing bodies, revelation of mismatch of demands in human capital management and the existing system of regional management, regulatory and legal framework for regional development control. This study only specifies the possibility of determination of responsibility areas, however, definite mechanisms are not developed, including the correction directions of regional and federal legislation.
Table 2: Distribution of factor values, maximally influenced on the assessment of CHCFD, per Federal Districts
Factor of influence RF Federal District
Central South North-Caucasian Volga Region Ural Siberian Far-Eastern North-West
Family stability 0.603 0.619 0.536 0.512 0.578 0.600 0.608 0.606 0.621
Criminogenity 0.683 0.689 0.640 0.570 0.663 0.667 0.692 0.718 0.721
Museum attendance 0.748 0.579 0.748 0.708 0.669 0.745 0.756 0.777 0.747
Number of NPO institutions 0.882 0.908 0.836 0.824 0.861 0.864 0.883 0.892 0.885
Factor analysis provided an opportunity to determine key problems in human capital management, at the same time, it is reasonable to reveal the reasons, explaining the change of factors, to give their qualitative assessment. Besides, the factor analysis provides only general view of the priorities of regional policy of human capital management, they can be specified.
REFERENCES
Abel, J., Deitz, R. (2011), Do colleges and universities increase their region’s human capital? Federal Reserve Bank of New York. Economic Research, Staff Report, October 2009, 401. Available from: http://www.newyorkfed.org/research/staff_reports/sr401.html. [Last retrieved on 2011 Apr].
Ballester, M., Livnat, J., Sinha, N. (2002), Labor costs and investments in human capital. Journal of Accounting, Auditing, and Finance, 17, 351-373.
Becker, G. (1962), Investment in human capital: A theoretical analysis. Journal of Political Economy, 70, 9-49.
Ben-Porath, Y. (1967), The production of human capital and the life cycle of earnings. Journal of Political Economy, 75(4), 352-365. Dyatlov, S.A. (1994), The Foundations of the Human Capital Theory.
St. Petersburg: St. Petersburg State University of Economy and Finances.
Gennaioli, N., La Porta, R., Lopez-de-Silanes, F., Shleifer, A. (2013), Human capital and regional development. The Quarterly Journal of Economics, 128(1), 105-164.
Gratsinskaya, G.V., Pogosyan, T.R. (2012), Human capital as a key tool of modernizing Russian economy. A Magazine of Legal and Economic Studies, 2, 88-90.
Iyere Joseph, A., Aibieyi, S. (2014), Human capital: Definitions, approaches and management dynamics. Journal of Business Administration and Education, 5(1), 55-78.
Kapelyushnikov, R.I. (2012), How Much is the Human Capital in Russia? St. Petersburg: Publishing House of Higher School of Economics. Kiker, B. (1966), The historical roots of the concept of human capital.
Journal of Political Economy, 74(48), 1-99.
Korchagin, Y.A. (2005), Russian Human Capital: A Factor of Development or Degradation? Voronezh: A Center of Studies of National Economy. Available from: http://www.hse.ru/data/2011/04/22/1210713272/ Korchagin% 20Russian%20Human%20Capital%20Assets.pdf F. [Last retrieved on 2014 Apr].
Kozlowski, S.W.J., Klein, K.J. editors. (2000), A multilevel approach to theory and research in organizations: Contextual, temporal, and emergent processes. Multilevel Theory, Research, and Methods in Organizations: Foundations, Extensions, and New Directions. San Francisco, CA, US: Jossey-Bass.
Kurgansky, S.A. (2011), The structure of human capital and its assessment at macrolevel. Izvestiya of Irkutsk State Economic Academy, 6, 15-22. Nelson, R., Phelps, E. (1966), Investment in humans, technological
diffusion, and economic growth. American Economic Review, 56, 69-75.
Nureev, R. (2010), Human capital and its development in present-day Russia. Russian Education & Society, 52(3), 3.
Ployhart, R., Moliterno, T. (2011), Emergence of the human capital resource: A multilevel model. Academy of Management Review, 36(1), 127-150.
Rodionov, D.G., Fersman, N.G., Kushneva, O.A. (2014), Credibility of the Russian higher education in the world: Problems and solutions. Life Science Journal, 10(11), 43-47.
Rodionov, D.G., Rudskaia, I.A., Alexandrovna, K.O. (2014), How key Russian universities advance to become leaders of worldwide
Table
3: Distribution of factor
values, maximally influenced on the assessment of CHCFD, per
the constituent entities of the Federation of Northwest Federal
District Factor
of
influence
RF
Northwestern Federal District
The
Republic of Kar
elia
The Komi Republic
The Arkhangelsk
Region
The V
ologda
Region
The
Kaliningrad Region
The Leningrad
Region
The Murmansk
Region
The Novgor
od
Region
The Pskov Region
St.
Petersburg
Family stability
0.603
0.621
0.648
0.644
0.532
0.622
0.541
0.459
0.529
0.492
0.601
0.670
Criminogenity
0.683
0.721
0.724
0.731
0.641
0.720
0.585
0.513
0.631
0.631
0.71
1
0.725
Museum attendance
0.748
0.747
0.791
0.823
0.703
0.773
0.626
0.561
0.703
0.668
0.757
0.725
Number of NPO institutions
0.882
0.885
0.901
0.905
0.859
0.910
0.865
0.782
0.871
0.843
0.887
0.880
NPO: Non
-profit or
education: Problem analysis and solving. World Applied Sciences, 31(6), 1082-1089.
Rodionov, D.G., Rudskaia, I.A., Kushneva, O.A. (2014), The importance of the university world rankings in the context of globalization. Life Science Journal, 11(84), 442-446.
Schultz, T. (1961), Investment in human capital. American Economic Review, 51, 1-17.
Sharafanova, E.E., Kotov, T.M. (2011), Renovation of human capital of regional population: A conceptual framework and directions of implementation. Izvestiya of St. Petersburg State Agriculture University, 23, 279-284.
Stark, O., Wang, Y. (2002), Inducing human capital formation: Migration as a substitute for subsides. Journal of Public Economics, 86(1), 29-46.
Zaborovskaia, O.V., Plotnikova, E.V., Sharafanova, E.E. (2014), Assessment of conditions for formation and development of human capital in the regions of the Russian federation. Asian Social Science, 10(21), 267-274.