Issues
ISSN: 2146-4138
available at http: www.econjournals.com
International Journal of Economics and Financial Issues, 2017, 7(3), 362-370.
Financial Development, Commercial Development, and Economic
Growth in the Selected Emerging and the Middle Eastern
Countries
#1Lotfali Agheli
1*, Golnaz Hadian
21Faculty Member, Economic Research Institute, Tarbiat Modares University, Iran, 2MA in Economics, Tarbiat Modares University,
Iran. *Email: [email protected]
ABSTRACT
This study investigates panel causality relationships among financial development (FD), commercial development and economic growth using bootstrap method in selected emerging and developing countries during 1980-2013. In this study, simultaneous equations, seemingly unrelated regression, Wald test and bootstrap critical tests are used to determine causality relationship among variables under study. Our findings indicate the difference of causality across countries and among different variables, so that in some countries, FD has led to economic growth and in other countries, this has not happened because of lack of deep financial sector. However, in most countries, commercial development has led to improvement of economic growth. Moreover, the results imply difference in direction of causality from economic growth to both financial and commercial development.
Keywords: Oil-dependent Countries, Emerging Markets, Panel Causality
JEL Classifications: C23, G32, P45
# This paper has been extracted from MA thesis of my student.
1. INTRODUCTION
Economists often consider the relationships among financial
policies, commercial development and economic growth. In viewpoints of capitalists, a completely free economy is preferred to a highly regulated economy. Empirical evidences from trade openness demonstrate positive effect of open-door policy on economic growth. In this regard, reduction of trade restrictions, prudent macroeconomic policies, government policies and political stability play crucial roles in explanation of the correlation between economic growth and trade openness of an economy. Positive correlation between trade openness and economic growth has caused appropriate motivation for the unilateral trade reforms
over the past 20 years, so that about 100 countries around the world are committed to commercial development (McKinnon, 1973; Khataie and Seifipour, 2000).
Existence of a positive correlation between open trade and economic growth is an important factor to encourage trade
reforms in many countries. Logical basis for implementation of
trade reforms is this belief that liberalization is the prerequisite
for transferring to a relatively open economy. On the other hand,
financial development (FD) can pave the way for economic
growth through increasing saving and investment level and its
impact on optimal resource allocation and capital efficiency. Commercial development and FD can reduce inefficiencies in
production process, and empower economic growth, since due to empirical evidences, countries with more openness degree and
more developed financial markets have experienced accelerating economic growth (Barro, 1991; Nazifi, 2004).
In simple approach to financial markets, only the losses and gains resulting from fluctuations of financial assets’ prices are considered; although an efficient financial sector can lead to economic growth. In this field, economists like Schumpeter (1911) and Hicks (1969) argued that FD is inseparable component
two efficient financial and real sectors. The interaction of these two sectors is the necessary and sufficient condition for success
of economic system, since performance of each sector can affect the performance of the other one.
The main purpose of this study is to find causality direction among variables of FD, economic growth and commercial development
among oil countries of the Middle East and emerging economics
during 1980-2013. In this regard, bootstrap approach is used in the context of panel causality. The main research questions are
as follows:
1. Do financial institutions influence economic growth? Does economic growth lead to FD in the countries?
2. What is the impact of commercial development on economic
growth?
3. What is the impact of financial growth on commercial
development?
The rest of this paper is organized in 4 sections. Section 2 devotes to theoretical basics. Section 3 presents the empirical
background on the relationships among FD, economic growth
and commercial development. Section 4 introduces the sample, data and variables. Section 5 indicates econometric issues. Finally, Section 6 concludes.
2. THEORETICAL BASICS
The theoretical issues for this research are presented in three following subsections.
2.1. Impact of FD on Economic Growth
In general, there are two patterns on the relationship between FD and economic growth. The first pattern argues that FD has no effect on the economic growth (Solow, 1962; Stern, 1989).
Singh (1997) believed that FD is not useful for economic growth
due to following reasons:
• In developing countries, the intrinsic instability and volatility in stock market prices cannot reflect the efficient allocation of financial assets.
• Due to interdependence of money and stock markets, the
undesired economic shocks may result in macroeconomic instability and slowness of economic growth.
• The banking system in some developing countries, especially
in the South East Asian countries, may be weakened because of expansion of stock markets. It seems Singh considers
financial sector as a main rival for banking system.
• The second pattern emphasizes the relationship between FD
and economic growth. This is developed in three following approaches.
2.1.1. Supply-side approach
This approach assumes one-directional causality running from FD to economic growth. FD can boost economic growth in different ways. For instance, FD can help to trade-off financial sources
among corporates having different portfolios. This trade-off likely
increases the financial depth, and encourages the investments, which finally leads to economic growth.
The neo classical economists, who focus on governance of prices and liberalization of interest rates, follow this approach. In this
context, McKinnon (1991), Shaw (1973), and Goldsmith (1955) reject the monetary models of Keynesians and Structuralists based on control of financial markets, and believe that these models
do not match conditions of developing countries. They argue
that intervention of government in financial markets, which is reflected in controlling interest rate and regulating bank reserves, is a main source of financial repression. They describe scarcity of savings, inadequate growth in investments, low productivity of investments, decreased financial intermediation, expansion of informal financial markets, and inflationary taxation through money seignior age (or inflationary tax), as key characteristics of a repressed financial system. In their view, the financial institutions
act as intermediaries among investors and savers, and help to increase the economic growth. In other words, they accept a
positive correlation between FD and economic growth.
King and Levine (1993) explained the effect of FD on economic growth through improving investment efficiency due to selecting
economical projects, innovation and entrepreneurship.
2.1.2. Demand-side approach
In this approach, the changes in financial markets occur by
growth of real sectors of the economy because of technological progress or enhanced labour productivity. In other words, the
economic growth causes expansion of financial markets. Since the demand for financial services depends on growth of real output in different economic sectors (Patrick, 1966), hence establishment of modern financial institutions is a response to demand of investors and savers for financial services. Robinson (1952) believes
that countries with faster growth rates allocate larger funds to
development of own financial sector. She defines financing a function of entrepreneurship. In her viewpoint, financing is not
a direct cause to economic growth, but it automatically reacts to changes in demand in real sector.
2.1.3. Bidirectional causality approach
The third approach believes in two-way relationship between
economic growth and FD. In the early stages of economic growth, the financial sector plays key role in the economic growth through expanding financial markets and creating financial institutions, and supplying financial assets. This process is in line with supply-side
approach. In the next phases of economic growth, the expansion
of financial sectors is influenced by economic growth. This is consistent to demand-side approach. Greenwood and Smith (1997) and Luintel and Khan (1999) advocate this bidirectional approach.
Since capital accumulation and technological innovation is vital
to economic growth, market deficiencies such as information and transaction costs result in creating mediation in financial markets (Levine, 1992). The financial intermediaries collect savings, ease
the risk management, and facilitate the exchange of goods, services and contracts. The result is high growth rates.
Using endogenous growth models, Barro (1991) explains the causal relationship from FD to economic growth. According to Barro, FD may enhance economic growth through increasing
In summary, sufficient resources for financing new projects, risk management, financial mediation, diversification of the corporate portfolio, and higher expected profits can provide appropriate environment for economic growth (Barro, 1991; Khataie and Seifipour, 2000).
2.2. Impact of Commercial Development on Economic Growth
New theories of economic growth present important arguments on the relation between trade and economic growth. According to these theories, if the economic growth is created by research
and development (R and D) activities, free trade makes access
to science and technology of commercial partners possible. Moreover, open trade policies allow the producers to have access to larger markets and create technical innovations. Particularly, open trade provides new opportunity for developing countries in order to access to capital and intermediate inputs. Finally, if economic growth leads to supply of new products, trade can play key role in economic growth through facilitating access to new
inputs, new outputs and new markets (Gorji and Alipourian, 2006).
Theoretical literature of growth pays more attention to the correlation between trade policies and economic growth compared to the correlation between trade volume and growth. Therefore, the relationship between trade barriers and economic growth cannot display the response to effects of changes in trade volume on economic growth directly. Even if two concepts of “trade volume” and “trade barriers” are closely interrelated, their linkages with economic growth will probably be different. The difference is because the external sector of a country is affected by other factors such as geographical characteristics, size of a country and income level of that country. In empirical studies, different criteria are used to test effect of trade openness on economic growth. The most fundamental criterion of openness is share of trade
(exports plus imports) in gross domestic product (GDP) in a given
economy. In a simple form, this index is the sum of exports and
imports divided by GDP. Many studies have obtained positive and
strong correlation between economic growth and trade openness
(Acaravci et al., 2007; Ozturk, 2008; Babajide et al., 2015; Sbia and Alrousan, 2016).
2.3. Effect of Commercial Development on FD
A few studies have investigated the issue of effect of trade
liberalization on FD. In this regard, Do and Levchenko (2007)
presented a theoretical model with two sections, which one of them
was finance-oriented. In this model, size of financial system is a function of total product in finance-oriented section. Moreover, quality of financial system is a function of its size. In this
framework, larger section provides more desirable environment
for entrepreneurs in order to finance from external resources, since when the entrepreneurs begin finance-oriented projects and involve in financial system of country. As a result, liquidity volume is increased. In this case, deeper financial system leads to reduction of risk of projects in case of lack of liquidity. Hence, in this model, entrepreneurs in finance-oriented section create positive externalities for other entrepreneurs. They believe that financial
system of every country is the endogenous product of demand of
entrepreneurs for foreign financial funds. In their viewpoint, when
a poor and a rich country open their trade, the poor country begins
to import finance-dependent product against producing it in the
country and as a result, demand for foreign funds is reduced and
domestic financial system is restricted. Accordingly, the losses
resulting from trade affect the poor country; although the losses
imposed on financial system may lead to long-term reduction of economic growth. As size and quality of financing system of
country is the resultant of balance between domestic supply and
demand for foreign financial funds, they could be affected also by trade. Hence, it is expected that effect of trade be different among countries. If trade increases specialization toward finance-dependent products, then financial system will be enlarged. On the contrary, if trade derives the country toward finance-dependent imports, then financial system will be vulnerable after opening the economy (Barro, 1991).
3. EMPIRICAL BACKGROUND
While most economists agree on the correlation between FD, trade
openness and economic growth; however there is no consensus on the causality direction among them.
Kazerouni (2003) used Johansen-Juselius (1990) co-integration test to analyze the correlation between FD and economic growth
in Iran during 1959-1996. The results from Johansen-Juselius test
indicated the existence of long-term correlation between FD and economic growth; although the long-term correlation is not significant statistically and granger test confirms one-way causality from FD to economic growth. Rasekhi and Ranjbar (2009) investigated the impact of FD on economic growth of Organization of Islamic Cooperation States using panel data during 1980-2004. The results indicated positive effect of FD on economic growth in this economic bloc.
Rasti (2009) examined the impacts of trade openness on FD in
the Iranian economy and evaluated the effects of trade promotion on main economic sectors using autoregressive distributed lag
(ARDL) model, impulse response functions and analysis of
variance. The results indicated positive impacts of trade expansion
on FD in Iran.
Jafari et al. (2009) investigated the effect of liquidity volume as index of FD on GDP in Iran during 1973-2007. They found a significant and positive relationship between FD and GDP using ARDL econometrics method.
Using vector auto-regressive (VAR) specification, Abu-Bader and Abu-Qarn (2008) found the two-way causality relation between FD and economic growth in Egypt. Chen (2006) used generalized method of moments to investigate the impact of financial mediator development on economic growth in China. He reached a positive relationship between FD and economic growth.
Liang and Jian-Zhou (2006) used multivariate VAR to report one-way causality from economic growth to FD for China during 1952-2001.
different among countries. The result refers to positive impact of
trade on enhancement of financial system growth in rich countries
and its reduction in poor countries.
Choe and Moosa (1999) used non-nested models and Granger causality test to analyze causality relation between FD and economic growth of South Korea during 1975-1992. In the study, financial sector was divided to two parts of financial mediators and capital markets. The results from the study showed that FD can lead to economic growth and in this field, role of financial
intermediaries is more important than capital markets.
The study of Liu and Hsu (2006) on Taiwan, South Korea and Japan by 1981-2001 showed that high investment can result in
increase in economic growth in Japan; although this issue is not
true for Taiwan and South Korea. Moreover, FD has positive effect
on economy of Taiwan; although it has negative impact on Japan
and South Korea.
Ahmed and Ansari (1998) have used Granger Causality test and Cobb-Douglas production function to study the causal relationship of financial sector development and economic growth of three
countries of India, Pakistan and Sri Lanka during 1973-1991. The results showed existence of one-way causal relationship from
FD to economic growth and positive and significant effect of this
sector on economic growth.
Using panel data methodology, Agheli et al. (2017) estimated the effect of transaction costs on FD in Iran during 1990-2012. They proved that transaction costs affect FD significantly, and the reduced transaction costs result in increasing FD. In addition they found that guaranteed property rights raise the FD.
4. DATA AND VARIABLES
4.1. Statistical Sample
This article focuses on two groups: (1) Oil-rich Middle Eastern states including Iran, Saudi Arabia, Oman, Bahrain, and (2)
emerging economies including Egypt, Jordan, Argentina,
Malaysia, Thailand, China, Chile, Mexico, Turkey, Brazil and Indonesia. The main characteristic of the first group is to export
crude oil, natural gas, and oil products. This group is heavily
reliant on oil and gas revenues in financing public projects. This
group is of heterogeneous economies in terms of population size,
GDP per capita and oil and gas reserves. While United Arab Emirates, Kuwait and Qatar are high-income and low-populated
members in this group, Iran is a medium-income and relatively populated country in the region. This group is vulnerable to oil price shocks, because volatile oil prices affect negatively terms of trade and foreign exchange reserves, which in turn leads to the limited economic growth.
On the other hand, the “emerging economies” have experienced
crucial changes in their institutional frameworks (Šević, 2006).
This term initiated by Antoine Willem van Agtmael from World
Bank in 1981. It currently refers to all Asian and Latin America
countries, and former socialist countries, and some developed regions, which have recorded successful socioeconomic
achievements during the past 20 years. According to the Mody (2004), the emerging countries are of the following features: • They are extremely volatile, but they offer the potential to
share in the early stages of a country’s economic growth. • They are of high growth expectations.
• Foreign investments in these markets are characterized by a
high level of risk and possibility of a high return.
• Transitions occur in economic, political, social and
demographic dimensions.
• They are committed to market-oriented policy to attract
productive investment.
• They are of sufficient flexibility to respond to unexpected
developments.
According to the World Bank (1997), the five biggest emerging markets are China, India, Indonesia, Brazil and Russia. By 2020,
their share of world output will double to 16.1% from 7.8% in
1992. They will also become more significant buyers of goods
and services than industrialized countries.
4.2. Variables
This research considers the following variables:
GGDP: GDP growth rate.
TO: Trade (sum of exports and imports) to GDP ratio. This
measures trade promotion or commercial development.
Moreover, in order to study different aspects of FD, average of three following variables is assumed as an indicator of FD:
M2: Money and quasi money, as a per cent of GDP. DCPS: Domestic credits to private sector, as a percent of GDP. TVS: Total value of stocks traded, as a percent of GDP.
4.3. Data
Statistical data is collected from the World Development Indicators, which is published by the World Bank annually. This study covers the period 1980-2013.
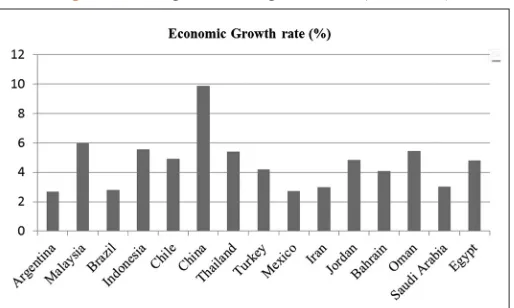
Figure 1 illustrates the average economic growth in the countries
under study during 1980-2013. As shown, China has the
highest growth rate in our sample. This country has recorded
the economic growth rates more than 10% during 2000s. After
China, Thailand and Malaysia have experienced the greatest economic growth. Iran is of low economic growth, on average.
This country has been faced negative economic growth in recent years.
The FD is depicted in Figure 2. China and Turkey rank the first
and the second, which indicates efficiency and depth of financial system in these countries. Iran is of the lowest FD over the period
under consideration. This is because of lack of relationship between
real and financial sectors in Iran. Bahrain is a low-populated and small country in our sample. It has recorded the lowest financial
depth. Chile is rich of copper reserves. This country has small
financial sector. It seems this resource-based country has failed in promoting financial services. The similar situation is observed for
Iran, another resource-based economy. According to literature on
“resource curse,” there is a negative relationship between financial
depth and resource rents, at least for Iran and Chile. Among Latin
American countries, Brazil has recorded the relatively higher FD.
Figure 3 shows that Brazil, Malaysia and Bahrain, on average,
have experienced the highest commercial development, in terms of trade openness. These economies have increased trade in goods and services. Financial and banking services, air transport services,
and post services have risen since early 1980s. Iran has not been successful in opening its doors to foreign investors. During the
period under study, this country challenged with an unintended 8-year war. The special conditions of war period did not let Iran to follow open-doors trade policies. Afterwards, some efforts were made to attract foreign investments, however high dependency to oil exports limited the scope of the Iranian economy to merge with
the world in the other non-oil sectors. Due to sanctions imposed
by US, United Nations, and European Union during past 6 years, Iran lost its market share in global trade, especially in the oil market. Argentina is the other country with low level in terms of
open trade. This means that it has not sufficiently been integrated
in the regional and world economic arena.
5. MODEL SPECIFICATION
This study uses panel data and tests for causality among variables. In panel data models, Granger causality test needs to consider two points:
• The first point is to control the possibility of sectional
correlation among panel members. The reason for sectional correlation among panel members is this fact that the shocks on a country can also affect other countries because of high
degree of globalization, international trade and financial integration. Pesaran (2006) emphasized the importance of
sectional correlation test in studying panel data and proved that if the sectional correlation is ignored, a basic bias would be created in the results.
• The second point is that inconsistency of estimated parameters
for each panel member should be considered in order to
apply a restriction on causal relationship. Because of special
conditions of every country, the homogeneity cannot be assumed for panel data parameters. In other words, the assumption of homogeneity cannot remove the presence of
heterogeneity within data. For example, although a significant relation from FD to economic growth is possible in many
countries; same relation may be reverse in other countries.
This is because; FD level differs across countries.
According to Goyal et al. (2004), assumption of homogeneity in analyzing the causal relationship among FD, trade liberalization
and economic growth may lead to confusing results. In order to deliberate sectional correlation and heterogeneity, this study uses
Konya approach to test panel causality test. This approach is based on Seemingly Unrelated Regression (SUR), developed by Zellner (1962), which considers assumption of sectional correlation among
panel members and determines causality direction based on Wald
test and Bootstrap critical values specified to each country.
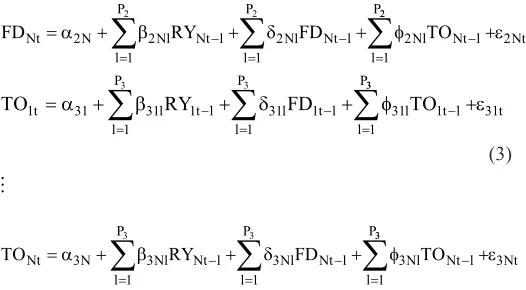
According to Konya (2006) panel causality approach, we consider a system of equations as follows:
RYt lRYt l FD TO
l P
l t l l
P
l t l l
P
1 11 11 1
1
11 1 1
11 1 1
1 1
= + − + + +
=
− =
− =
∑
∑
α β δ φ
1 1
11
∑
ε t(1)
RYNt N NlRYNt l FD TO
l P
Nl Nt l l
P
Nl Nt l l
P
= + − + + +
=
− =
− =
∑
∑
α1 β1 δ φ
1
1 1
1 1
1 1 11
1
∑
εNtFDt lRYt l FD TO
l P
l t l l
P
l t l l
P
1 21 21 1
1
21 1 1
21 1 1
2 2
= + − + + +
=
− =
− =
∑
∑
α β δ φ
2 2
21
∑
ε t(2)
Figure 2: Average financial development (1980-2013)
FDNt N NlRYNt l FD TO
l P
Nl Nt l l
P
Nl Nt l l P = + − + + + = − = − =
∑
∑
α2 β2 δ φ
1
2 1
2 1
2 2 22
2
∑
ε NtTOt lRYt l FD TO
l P
l t l l
P
l t l l
P
1 31 31 1
1 31 1 1 31 1 1 3 3 = + − + + + = − = − =
∑
∑
α β δ φ
3 3
31
∑
ε t(3)
TONt N NlRYNt l FD TO
l P
Nl Nt l l
P
Nl Nt l l P = + − + + + = − = − =
∑
∑
α3 β3 δ φ
1
3 1
3 1
3 3 33
3
∑
ε NtWhere; Y, FD and TO indicate GDP growth rate, FD and trade openness, respectively. N is number of countries (i=1,2…, N); and t is a symbol for time period (t=1,2…,T). In addition, l indicates
lag length.
In this system of equations:
1. If all δ1,i,j s are statistically non-zero and all β2,i,j s are
statistically equal to zero, one-way causality relationship will run from FD to RY.
2. If all δ1,i,j s are statistically equal to zero and all β2,i,j s are
statistically non-zero, one-way causality relation will exist
from RY to FD.
3. If all δ1,i,j s and β2,i,j s are significantly non-zero, then a
two-way causality linkage will be between RY and FD.
4. If all δ1,i,j s and β2,i,j s are significantly equal to zero, there is
no causality relationship between RY and FD and they are
two independent variables.
Moreover, to test the causality relationship between other variables, same process is run.
5.1. Evaluation of Concurrent Correlation
In order to test for concurrent correlation we follow a test proposed
by Breusch and Pagan (1980) and Pesaran (2004) and Pesaran et al. (2008). This test is based on seemingly unrelated model, which
can increase the efficiency of estimators. According to Table 1, H0
indicating lack of concurrent autocorrelation among our panel data
is rejected at significance level of 5%. As a result, the concurrent correlation is confirmed.
After confirmation of correlation among cross-sections, the
system of equations is estimated using SUR method. As there
is no presumption based on existence or lack of panel unit root,
the variables under study may have unit root. Hence, through
comparing Wald test values with critical values of statistical tables, no certain result can be achieved. Thus, Bootstrap critical
values is used here, in which through repeated sampling with about
10,000 replications, critical values for distribution of statistical
population are determined and are applied to test stationary in
time series. As Konya (2006) stated, bootstrapping is basically a
re-sampling method.
5.2. Bootstrap Process Steps
All countries can be considered concurrent. This approach makes sectional correlation among panel members possible. Through
running Wald test and using Bootstrap critical values specified to each country, Granger causality among variables (FD, commercial development and economic growth) is clarified. The main issue is
that how bootstrap samples are generated and used. The process
of generating bootstrap samples and critical values consists of five steps as follows (Konya, 2006):
Step 1: The system of equations in Section 4 is estimated (3-2) under null hypothesis of lack of causality from FD to Y (through
imposing γ1,i,l = 0 constraint for all countries and lags) and then
residuals (eH ,i,t
0 ) is computed:
eH i t yi t i i lyi t l i N t T
l mly 0 1 1 1 1 1 1
, , = , − ∝ −,
∑
= β, , ,− = ,..., , = ,... (4)The array N×T eH ,i,t
0
is obtained from the residuals, and mly is maximum lag of y.
Step 2: The residuals are resampled. To maintain sectional concurrent correlation, residuals are not plotted individually for every country, but a complete column of matrix eH ,i,t
0
is
selected randomly at the given time. The selected bootstrap residuals are shown as e*H ,i,t
0 , where t=1,…T* and T* can be
greater than T.
Step 3: Assuming that there is no causality relationship from FD
to y, bootstrap sample of y is generated as follows:
1
0
mly
* * * *
i,t 1,i 1,i,l i,t l H ,i,t l 1
y ˆ ˆ y − e t 1, ,T
=
=∝ +
∑
β + = … (5)Step 4: yi,t is replaced by yi,t* and system of equations is estimated with applying no parametric limitation, and then Wald test is
performed separately for every country to test H0 (no causality).
Step 5: In this step, steps 2-4 are repeated several times to obtain empirical distributions of Wald test values. Then, bootstrap critical values are generated through selecting proper percentile of the sample distributions. In this step, bootstrap sample
distribution may be derived for each test statistic through 10,000
replications.
5.3. Empirical Results
In this paper, we applied bootstrapping method to examine causality relationships. The results of causality test are reported in Table 2, which indicates lack of granger causality running from
FD to economic growth in most countries under investigation. However, the null hypothesis is rejected for Bahrain, Chile, China, Indonesia and Mexico at the significance level of 5% which implies Table 1: Results of concurrent autocorrelation test
Test Test statistic P value
LM 661.11 0.000
CDLM 15.39 0.000
CD 16.01 0.000
LMadj 8.09 0.000
that in these countries, FD causes economic growth. This finding is consistent with results of Kazerouni (2003), Abu-Bader and Abu-Qarn (2008) and Choe and Moosa (1999). On the other hand,
there is a causality relationship running from economic growth
to financial development for Bahrain, Chile, China, Malaysia,
Egypt and Turkey.
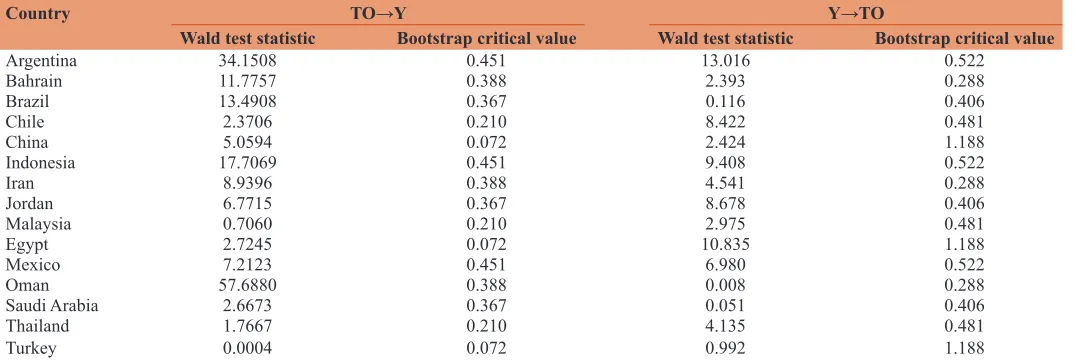
According to Table 3, in all countries, except for Turkey, Wald
test value is more than bootstrap critical values. As a result, H0 is
rejected at the significance level of 5%. Hence, in sample countries (except for Turkey), trade openness causes economic growth. This result reaffirms the viewpoints of Gorji and Alipourian (2006) and Acaravci et al. (2007). The special case of Turkey may be a
matter of further research, because it needs to examine accurately
and separately. On the other hand, in Brazil, Oman, Saudi Arabia
and Turkey, economic growth does not lead to trade promotion.
Although these findings seem surprisingly, however we have to
remember that these countries have become globalized since
early 2000s. This study extends the long term period beginning from 1980. Due to size of its economy, Iran is an open economy,
and economic growth logically results in trade expansion, and vice versa.
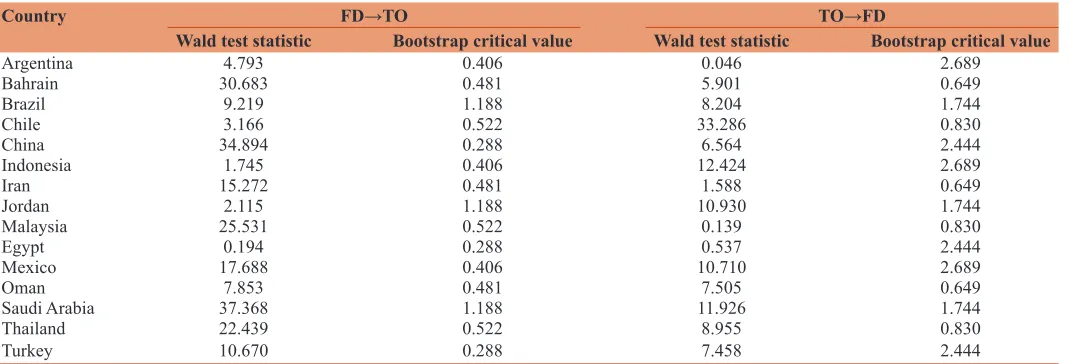
Table 4 reports the results of causality relation between trade
openness and FD. The causality from trade openness to FD is confirmed for most countries in our sample. These findings are in line with those of Do and Levchenko (2007) and (2009). However,
as shown, there is no causality relationship running from trade
openness to FD in Argentina, Malaysia and Egypt. On the contrary, except for Egypt, the causality runs from FD to open trade.
6. CONCLUSIONS
The findings imply causality in different directions among variables under consideration, so that in some countries, FD has led to
economic growth and in the others, there is no causality relationship
because of low level of FD. However, in most countries, trade
expansion and promotion has resulted in economic growth. This
can be a priority over FD in line with improving economic growth.
On the opposite side, the results indicate differences in directions
of causality from economic growth to FD and trade openness.
Hence, our findings are consistent with majority of economic researches, so that FD and trade liberalization are the main
Table 2: Causality test between FD and economic growth
Country FD→Y Y→FD
Wald test statistic Bootstrap critical value Wald test statistic Bootstrap critical value
Argentina 0.027 0.219 42.444 62.361
Bahrain 3.338 0.974 44.655 42.342
Brazil 0.520 21.488 0.002 131.585
Chile 5.581 3.119 36.148 23.585
China 4.780 4.587 4.643 1.168
Indonesia 1.317 0.219 9.059 62.361
Iran 0.006 0.974 0.039 42.342
Jordan 0.010 21.488 1.028 131.585
Malaysia 2.632 3.119 27.840 23.485
Egypt 0.013 4.587 11.585 1.168
Mexico 5.267 0.219 8.051 62.61
Oman 0.969 0.974 0.114 42.342
Saudi Arabia 1.712 21.488 0.088 131.585
Thailand 0.461 3.119 18.204 23.458
Turkey 2.889 4.587 6.031 1.168
Indicates causality direction. FD and Y denote FD and economic growth rate, respectively. Significance level is 5%, FD: Financial development
Table 3: Causality test between trade openness and economic growth
Country TO→Y Y→TO
Wald test statistic Bootstrap critical value Wald test statistic Bootstrap critical value
Argentina 34.1508 0.451 13.016 0.522
Bahrain 11.7757 0.388 2.393 0.288
Brazil 13.4908 0.367 0.116 0.406
Chile 2.3706 0.210 8.422 0.481
China 5.0594 0.072 2.424 1.188
Indonesia 17.7069 0.451 9.408 0.522
Iran 8.9396 0.388 4.541 0.288
Jordan 6.7715 0.367 8.678 0.406
Malaysia 0.7060 0.210 2.975 0.481
Egypt 2.7245 0.072 10.835 1.188
Mexico 7.2123 0.451 6.980 0.522
Oman 57.6880 0.388 0.008 0.288
Saudi Arabia 2.6673 0.367 0.051 0.406
Thailand 1.7667 0.210 4.135 0.481
Turkey 0.0004 0.072 0.992 1.188
strategies in order to achieve economic growth. These strategies will be effective, when they mixed with institutional changes in the structure of national economies. These changes do not occur fast. A combination of technological advancements, transparency in government policies, increasing social cohesion, sound monetary
and fiscal policies and control of corruption may help countries
in order to reach higher economic growth. It goes without saying
that a closed economy with weak financial sector cannot play
participatory role in the global markets.
Currently, most selected countries like Bahrain, South Korea, Brazil are experiencing domestic political instability. Some
countries involve in strategic games through intervening in
conflicts occurred after Arab Springs in Yemen, Bahrain, Syria. The
main players in the Middle East, i.e., Turkey, Saudi Arabia, and Iran are confronting with low foreign revenues due to decreased
tourism inflows (in case of Turkey), and low oil prices (in case of Iran and Saudi Arabia).
The continued economic growth is generated in a calm and stable environment. In the interconnected global markets, any socio-politic change in a country affects the other countries especially
its neighbors. The effects on financial and money markets are
substantial, since these markets are highly volatile.
The message of this article is to recommend sophisticated policy making in order to overcome political disputes in the regional and international sphere. We should remind the fundamental theorem of trade off, which implies that two parts gain from bilateral trade, although the one part may gain more than the other part. Trade drives
the domestic economy, and stimulates economic growth, if flows of
goods and services are channeled through the safe and secure ways. These are guaranteed through cooperation among economic blocs,
and minimization the conflicts at international level.
REFERENCES
Abu-Bader, S., Abu-Qarn, A.S. (2008), Financial development and
economic growth: The Egyptian experience. Journal of Policy
Modeling, 30(5), 887-898.
Acaravci, A., Ozturk, I., Acaravci, S.K. (2007), Finance - Growth Nexus:
Evidence from Turkey. Available fom: https://www.ssrn.com/
abstract=1401590; http://wwwdx.doi.org/10.2139/ssrn.1401590. Agheli, L., Sahabi, B., Solhkhah, N. (2017), The impact of transaction
cost on financial development in the selected OPEC countries. Quarterly Journal of the Economic Research (Sustainable Growth and Development), 17(1), 95-120.
Ahmed, S.M., Ansari, M.I. (1998), Financial sector development and
economic growth: The South-Asian experience. Journal of Asian
Economics, 9(3), 503-517.
Babajide, A.A., Adegboye, F.B., Omankhanlen, A.E. (2015), Financial
inclusion and economic growth in Nigeria. International Journal of
Economics and Financial Issues, 5(3), 629-637.
Barro, R.J. (1991), Economic growth in a cross section of countries. Quarterly Journal of Economics, 106(2), 407-443.
Breusch, T.S., Pagan, A.R. (1980), The lagrange multiplier test and its applications to model specification in econometrics. The Review of Economic Studies, 47(1), 239-253.
Chen, H. (2006), Development of financial intermediation and economic growth: The Chinese experience. China Economic Review, 17(4),
347-362.
Choe, C., Moosa, I.A. (1999), Financial system and economic growth: The Korean experience. World Development, 27(6), 1069-1082. Do, Q.T., Levchenko, A.A. (2007), Comparative advantage, demand for
external finance, and financial development. Journal of Financial Economics, 86(3), 796-834.
Goldsmith, R.W. (1955), Financial structure and economic growth in advanced countries: An experiment in comparative financial
morphology. In: Capital Formation and Economic Growth. Princeton: Princeton University Press. p112-167.
Gorji, E., Alipourian, M. (2006), Analysis of effect of trade liberalization
on economic growth of OPEC member states. Iranian Journal of
Trade Studies, 10(40), 187-203.
Goyal, R., Creane, S., Mobarak, A.M., Sab, R. (2004), Financial Sector Development in the Middle East and North Africa No. 4-201.
International Monetary Fund.
Greenwood, J., Smith, B.D. (1997), Financial markets in development, and the development of financial markets. Journal of Economic Dynamics and Control, 21(1), 145-181.
Hicks, J. (1969), A Theory of Economic History. Oxford: Clarendon Press. Jafari, S.A., Farhang, S., Rostamzadeh, M., Mohammadzadeh, M. (2009),
Effect of financial development and trade liberalization on economic growth of Iran. Quarterly Journal of Economic Research, 9(4), 1-21. Johansen, S., Juselius, K. (1990), Maximum likelihood estimation and
Table 4: Causality test between trade openness and FD
Country FD→TO TO→FD
Wald test statistic Bootstrap critical value Wald test statistic Bootstrap critical value
Argentina 4.793 0.406 0.046 2.689
Bahrain 30.683 0.481 5.901 0.649
Brazil 9.219 1.188 8.204 1.744
Chile 3.166 0.522 33.286 0.830
China 34.894 0.288 6.564 2.444
Indonesia 1.745 0.406 12.424 2.689
Iran 15.272 0.481 1.588 0.649
Jordan 2.115 1.188 10.930 1.744
Malaysia 25.531 0.522 0.139 0.830
Egypt 0.194 0.288 0.537 2.444
Mexico 17.688 0.406 10.710 2.689
Oman 7.853 0.481 7.505 0.649
Saudi Arabia 37.368 1.188 11.926 1.744
Thailand 22.439 0.522 8.955 0.830
Turkey 10.670 0.288 7.458 2.444
inference on co-integration-with applications to the demand for
money. Oxford Bulletin of Economics and Statistics, 52(2), 169-210. Kazerouni, A. (2003), The Relation between Financial Development and
Economic Growth: Iran Experiences. 13th Conference on Monetary and Exchange Policies, Collection of Papers and Lectures. Tehran: Tehran University.
Khataie, M., Seifipoor, R. (2000), Role of long-term financial sources in the economic growth of Iran. Iranian Economic Review, 3(4-5), 107-129.
King, R.G., Levine, R. (1993), Finance and growth: Schumpeter might be right. The Quarterly Journal of Economics, 108(3), 717-737. Konya, L. (2006), Exports and growth: Granger causality analysis on
OECD countries with a panel data approach. Economic Modeling, 23(6), 978-992.
Levine, R. (1992), Financial Structures and Economic Development. Vol. 849. Washington, DC: World Bank Publications, World Bank. Liang, Q., Jian-Zhou, T. (2006), Financial development and economic
growth: Evidence from China. China Economic Review, 17(4),
395-411.
Liu, W.C., Hsu, C.M. (2006), The role of financial development in economic growth: The experiences of Taiwan, Korea, and Japan. Journal of Asian Economics, 17(4), 667-690.
Luintel, K.B., Khan, M. (1999), A quantitative reassessment of the finance-growth nexus: Evidence from a multivariate VAR. Journal of Development Economics, 60(2), 381-405.
McKinnon, R.I. (1991), Financial control in the transition from
classical socialism to a market economy. The Journal of Economic
Perspectives, 5(4), 107-122.
McKinnon, R.I. (1973), Money and Capital in Economic Development. Washington, DC: Brookings Institution.
Mody, M.A. (2004), What is An Emerging Market? No. 4-177.
International Monetary Fund.
Nazifi, F. (2004), Financial development and economic growth in Iran. Economic Research Review, 4(3), 97-130.
Ozturk, I. (2008), Financial development and economic growth: Empirical
evidence from Turkey. Applied Econometrics and International
Development, 8(1), 85-98.
Patrick, H.T. (1966), Financial development and economic growth in underdeveloped countries. Economic Development and Cultural Change, 14(2), 174-189.
Pesaran, M.H. (2004), General Diagnostic Tests for Cross Section
Dependence in Panels, IZA (Institute for the Study of Labor) Discussion Paper, No. 1240.
Pesaran, M.H. (2006), Estimation and inference in large heterogeneous panels with a multifactor error structure. Econometrica, 74(4), 967-1012.
Pesaran, M.H., Ullah, A., Yamagata, T. (2008), A bias-adjusted LM test of error cross-section independence. Econometrics Journal, 11(1), 105-127.
Rasekhi, S., Ranjbar, A. (2009), Effect of financial development
on economic growth of member states of Islamic conference
organization. Knowledge and Development, 16(27), 1-22. Rasti, M. (2009), Effects of commercial development on financial
development in Iran economy. Commercial Surveys, 37, 56-63.
Robinson, J. (1952), The model of an expanding economy. The Economic Journal, 62(245), 42-53.
Sbia, R., Alrousan, S. (2016), Does financial development induce economic growth in UAE? The role of capitalization and foreign
direct investment. International Journal of Economics and Financial
Issues, 6(2), 703-710.
Schumpeter, J. (1911), The Theory of Economic Developmen. Cambridge: Harvard University Press.
Šević, Ž., editor. (2006), Local Government Financial Capacity Building in Transition Countries: Selected Country Studies. Bratislava, Slovakia: NISPAcee (The Network of Institutes and Schools of Public Administration in Central and Eastern Europe).
Shaw, E. (1973), Financial Deepening in Economic Development.
New York: Oxford University Press.
Singh, A. (1997), Financial liberalisation, stock markets and economic development. The Economic Journal, 107(442), 771-782.
Solow, R.M. (1962), Investment and technology progress and economic growth. American Economic Review, 52(2), 76-86.
Stern, N. (1989), The economics of development: A survey. The Economic Journal, 99(397), 597-685.
World Bank. (1997), Global Economic Prospects and the Developing Countries: 1997. Washington, DC: The World Bank.
World Bank. World Development Indicators. Washington, DC.
Available from: http://www.data.worldbank.org/data-catalog/world-development-indicators.
Zellner, A. (1962), An efficient method of estimating seemingly unrelated
regressions and tests for aggregation bias. Journal of the American