Applied Animal Behaviour Science
12 In press
Final Revision – NOT EDITED by the journal
34
5
6
7
8
9 10
11 12 13
14 15
16 17 18
19 20
21 22 23
Relationships between behaviour and health in
working horses, donkeys, and mules in developing
countries
Charlotte C. Burn1*, Tania L. Dennison2 & Helen R. Whay3
1Veterinary Clinical Sciences, The Royal Veterinary College, UK; 2Brooke Hospital
for Animals, London, UK; 3Clinical Veterinary Sciences, University of Bristol, UK
Short title: Behaviour and health of working equids
*Corresponding author: Dr C. C. Burn, Centre for Animal Welfare, Department of Clinical Veterinary Sciences, The Royal Veterinary College, Hawkshead Lane, Hertfordshire, AL9 7TA, UK
Abstract
2425 26 27 28 29 30 31 32 33 34 35 36 37 38 39 40 41 42 43 44 45 46 47 48
49
Recent studies raise serious welfare concerns regarding the estimated 93.6 million horses, donkeys and mules in developing countries. Most equids are used for work in poor communities, and are commonly afflicted with wounds, poor body condition, respiratory diseases, parasites, dental problems, and lameness.
Non-physical welfare problems, such as fear of humans, are also of concern. Interventions to improve working equine welfare aim to prioritise the conditions that cause the most severe impositions on the animals’ subjectively experienced welfare, but data
identifying which conditions these may be, are lacking. Here we describe a stage in the validation of behavioural welfare indicators that form part of a working equine welfare assessment protocol. Over four years, behavioural and physical data were collected from 5481 donkeys, 4504 horses, and 858 mules across nine developing countries. Behaviours included the animals’ general alertness, and their responses to four human-interaction tests, using the unfamiliar observer as the human stimulus. Avoidance behaviours correlated significantly with each other across the human-interaction tests, with 21% of animals avoiding the observer, but they showed no associations with likely anthropogenic injuries. Over 13% of equids appeared
‘apathetic’: lethargic rather than alert. Measures of unresponsiveness correlated with each other across the five tests, and were associated with poor body condition, abnormal mucous membrane colour, faecal soiling, eye abnormalities, more severe wounds, and older age, depending on the equine species. This suggests that working equids in poor physical health show an unresponsive behavioural profile, consistent with sickness behaviour, exhaustion, chronic pain, or depression-like states.
Keywords: Animal welfare; Developing countries; Equine; Human-animal
relationships; Inactivity; Sickness behaviour
Introduction
5051 52 53 54 55 56 57 58 59 60 61 62 63 64 65
66 67 68 69 70 71 72 73 74 75 76
An estimated 39 million donkeys, 40.5 million horses and 12.3 million mules live in developing countries, constituting over 85% of the world’s equids (FAOSTAT, 2006). In developing countries, equids are mostly used as working animals, often carrying out tasks under harsh and impoverished conditions for long hours each day. Consequently, previous research has shown that they have many physical and clinical problems, such as wounds, poor body condition, respiratory diseases, high parasite burdens, dental problems, and lameness (de Aluja, 1998; Pritchard et al., 2005; Tesfaye & Curran, 2005; Regan, 2009a; Burden et al., in press; Burn et al., in press; Saul et al., in press). These problems are likely to reduce the work efficiency of the animals, indirectly reducing the income of the often very poor people who rely on them. The physical/clinical problems are also likely to cause poor welfare for the animals themselves, since similar conditions in humans are associated with pain, weakness, exhaustion, and depression (Kelley et al., 2003). Hence, charities, such as the Brooke Hospital for Animals (‘the Brooke’) who provided data for the current study, work to attempt to improve working equine health and welfare.
To date, despite growing information on working equine health, little is known about the animal welfare implications (in the sense of the animals’ subjective
experiences) of the myriad physical conditions these animals accumulate. For
example, some physical conditions might be associated with pain (Broster et al., 2009; Regan, 2009b) or exhaustion (the high creatine kinase concentrations in working
equids indicates that muscle damage from overwork is prevalent: Tadich et al., 1997; Pritchard et al., 2009), while others may barely be perceived by the animals even if they harm their health and longevity. This is of applied importance because funding and resources to improve animal welfare should ideally be targeted towards problems likely to cause the most suffering as perceived by the animals themselves, which may be those causing deviations from normal behaviour. It would also be of value to have
77 78 79 80 81
82 83 84 85 86 87 88 89 90 91 92 93 94 95 96 97 98 99 100 101 102 103
easily observed behavioural welfare indicators, so that the individual animals likely to be in most need of welfare improvement can be identified rapidly before a full
assessment is done. Here we describe a stage in the validation of behavioural welfare indicators in working equids to assess their potential for providing information towards these purposes.
The behavioural indicators here formed part of a non-invasive welfare assessment that was developed in 2003 by the University of Bristol in collaboration with the Brooke. It should be noted that the data were not collected for the purposes of this study, but instead for the internal monitoring purposes of the Brooke. The data thus take the form of a series of standardised surveys of working equine populations, and we use an epidemiological approach, exploiting the natural variation within these populations, to investigate relationships between variables of interest. The welfare assessment protocol was intended to be brief and appropriate for field conditions, where observers were often interrupting the animals’ work. The welfare indicators were chosen to be simple, to minimise assessment time and to facilitate repeatability between observers. The behaviours included an observation of general alertness versus unresponsiveness to the environment. Unresponsiveness can be a component of chronic pain (Ashley et al., 2005), sickness behaviour (Aubert, 1999; Millman, 2007; Weary et al., 2009), depression (Vollmayr & Henn, 2003; Dunn et al., 2005) and exhaustion; but equally it can be associated with neutral or even good welfare if an animal perceives its situation to be secure enough to allow reduced vigilance (Paul et al., 2005). The human-interaction tests, which were proposed as measures of fear, aversion, or friendliness towards humans, incorporated brief assessments of the animals’ avoidance and other responses when a human approached, and their acceptance of human contact (e.g. for farm animals de Passille & Rushen, 2005; Waiblinger et al., 2006, and for sports and companion horses Hausberger et al., 2008). Pain behaviours were not explicitly included in the assessment, since they are highly
104 105
106 107 108 109 110 111 112 113 114 115 116 117 118 119 120 121 122 123 124
125 126 127 128 129 130
diverse, differing with the source, nature, and time-scale of the pain (Ashley et al., 2005; Regan, 2009a).
Like many large-scale, multi-centre epidemiological studies, data were collected by a number of trained observers (e.g. Waters et al., 2002; Dawkins et al., 2004; Rutherford et al., 2009). The observers in the current study were only those attaining ≥80% agreement with the trainer for all indicators, but the more general inter- and intra-observer reliability of the physical and behavioural indicators in the welfare assessment have also been tested (Burn et al., 2009): the population was too homogenous to conclusively test all the indicators, but while alertness showed acceptable intra-observer reliability, it showed poor reliability between observers. This suggests that some observers have different thresholds or use different cues for deciding when equids are alert or not, despite having been trained using the same guidance notes and photographs. These differences will have added unsystematic noise to the data analysed here, but the variable was included because so little is currently known about working equine behaviour, and – with modification – a
measure of general alertness could be important in future equine welfare assessments. The responses to the four human-interaction tests did show acceptable reliability between observers. The only physical indicator in the current study that attained poor reliability was mucous membrane colour, but it was included here because of its clinical relevance as a field test for endotoxaemia or gastrointestinal illness (Hailat et al., 1997; Thoefner et al., 2001; Hillyer, 2004).
In the current study, we investigated how the behaviours related to each other, and how they related to potentially relevant physical measures. Our hypotheses were broadly that (a) unresponsiveness should correlate across the tests and (b)
unresponsiveness should be associated with an overall reduced prevalence of physical problems if it signifies good welfare, or with an increased prevalence of physical problems if it indicates negative welfare (i.e. we tested whether responsiveness in
131 132 133 134 135
136
137
138 139 140 141 142 143 144 145
146 147 148 149 150 151 152 153 154 155 156
these animals had a relationship in either direction with physical welfare). Also, if aversion to humans is consistent within individual animals, animals that show
aversion to humans in one of the tests should (c) show aversion to humans in the three other human-interaction tests, and (d) have more physical signs of anthropogenic harm e.g. wounds on the hindquarters, potentially indicating beating.
Methods
Animals and observers
Non-invasive behavioural and physical data were collected from 5481 donkeys, 4504 horses, and 858 mules across 60 locations in nine developing
countries: Afghanistan, Egypt, Ethiopia, Guatemala, India, Jordan, Kenya, Pakistan and The Gambia. The data were collected over a 4-year period (March 2003- February 2007). The locations were areas where the Brooke was working or
considering working in the future, or where a collaborating organisation was working (see Acknowledgements for collaborating organisations). Details of the locations and dates are reported by Burn and colleagues (in press).
Welfare assessments were carried out by 42 trained observers, the vast majority of whom were veterinarians, but who were otherwise animal behaviour scientists, agricultural experts, or social scientists. All observers underwent a 6-10 day training course (described in Burn et al., 2009), the length being determined by the previous experience and English-language skills of participants; the course was based around a detailed, 102-page, photographic guide (available upon request from the authors: Pritchard & Whay, 2003 (unpublished), 2004 (unpublished)), which the participants kept. Only those participants who attained ≥80% agreement with the trainer on all measures were selected for data collection in this study. A welfare assessment trainer assessed about 5-30% of the animals in each location to help ensure consistency between the locations (the percentage of animals varied due to the
logistical constraints of visiting developing countries, gaining owner permission to assess each animal, and a paucity of data available on equine populations at the planning stages of the study). Animals were selected in locations that the observers had experience of working in, and between 5% and 100% of animals were assessed in each location depending on the size of the population, with it being possible to
examine a higher proportion of animals in smaller populations within a single visit. Until 2004, observers were requested to sample systematically from known animal populations, e.g. every third donkey in the market or on the roadside; thereafter, observers were instructed to sample randomly by writing ‘encounter numbers’ (e.g. 1
157 158 159 160 161 162 163 164 165 166 167 168
169
170 171 172 173 174 175 176 177 178 179
180 181
st, 2nd, 3rd etc animal encountered) or owner names on pieces of paper, which were
folded, mixed, and then blindly selected until the required sample size had been drawn for that day.
Behaviour and health measurement
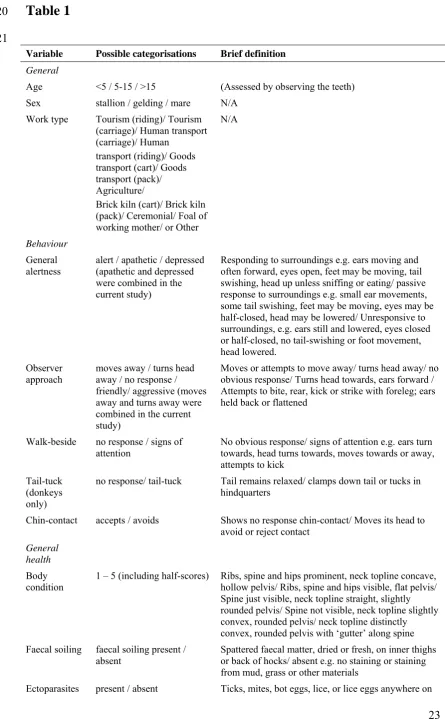
The data were collected using a welfare assessment protocol that included 41 animal-based measures potentially relevant to welfare (Pritchard & Whay, 2003 (unpublished), 2004 (unpublished)); but only a subset of the measurements were analysed in the current study and they are summarised and briefly described in Table 1. The welfare indicators included physical health measures, as well as the animals’ general alertness (versus the opposite, labelled ‘apathy’ but while acknowledging that this is not necessarily the associated emotional state; Table 1) and their behavioural responses to human presence and human contact. The welfare assessment protocol was modified slightly for some of the measurements from 2004 onwards, as described in detail by Burn and colleagues (2009).
Broadly, the sequence and procedure for taking the measurements, including those described in Table 1, was as follows:
182 183 184
185 186
187 188 189
190 191
192 193
194
195 196 197
198
199
200 201 202
203 204
205
1. Without disturbing the animal (and where possible, before asking the owner’s permission to observe the animal), the observer assessed the animal’s general alertness from a distance of at least 3 m away, and for up to 10 s.
2. After gaining permission from the owner, the observer approached the animal from 3 m away at a normal pace, looking at the animal’s neck or breast. The
observer approached at an angle of about 20o, rather than from directly ahead of the animal, and then stopped 30 cm from the animal’s head and recorded the animal’s response at the moment they stopped.
3. The observer walked alongside the animal towards its rear and back again, maintaining a distance of about 30 cm from its body, and recorded any signs of
attention to them and whether donkeys showed a tail-tuck response (tail-tucking was not observed in horses or mules).
4. The observer gently placed their hand under the animal’s chin, contacting it
enough to take some weight but not so as to lift the head. If the animal moved its head away from the hand, the observer would not pursue it. This was the first point of physical contact between the observer and the animal, unless the animal
itself had already initiated contact.
5. The observer then recorded physical health, starting with observing the lips and
head, and any eye abnormalities. They inserted a thumb or finger into the corner of the animal’s mouth and lifted the top lip until the gums and teeth were easily visible. The observer stood back to assign a body condition score (BCS), before
walking to the rear to record faecal soiling. The observer tested skin tent duration on the animal’s neck and observed any behavioural signs of heat stress (discussed
elsewhere in Pritchard et al., 2006, 2007; Pritchard et al., 2008). Ectoparasites and
206 207 208
209 210
211 212 213
214
215 216 217 218 219 220 221 222 223 224 225 226 227 228
229 230 231
lesions were assessed across the body and limbs. Visible swellings of the flexor tendon or fetlock joints were recorded, followed by hoof health, including picking up the right fore-foot to examine the sole surface. Finally, gait was assessed by
watching the animal walk as the owner led it for approximately six paces in a straight line away from, and then back towards, the observer; if the animal was
hitched to a cart, time-constraints required that its gait was assessed while pulling the cart, once the cart had gained momentum (i.e. not while the animal was starting from stationary).
Statistical analyses
Data were analysed using generalised linear mixed models for binary outcomes (glmmML and glmmPQL, R, version 2.58). The three species were
analysed separately, and the precise sample sizes depended on how many animals fell into each of the categories comprising the predictors in each model. In all models the Location nested within Country was included as a random effect (this took into account the location effects themselves as well as systematic ‘noise’ between locations: changes over the 4-year period, the two assessment versions, and the different observers). Predictors always included characteristics of the animals themselves (species, age, sex, and BCS) to control known variation. They also
included the animal’s main work-type, but in some cases this caused multicollinearity (identified from inflated standard errors in the models). When this occurred, an
urbanisation score was included instead of work-type (since it predicted the work type to some extent); urbanisation and work-type could not be included together in the models. Model fit was assessed using the deviance and Akaike's information criterion.
The models were selected to test: (1) interrelationships between the behaviours, (2) relationships between general alertness/ responsiveness to human interaction and measures of physical health, and (3) relationships between human
232 233 234
235 236 237 238 239 240 241 242 243
244
245
246 247 248 249 250 251 252 253 254 255 256 257
avoidance behaviours and physical signs of anthropogenic harm (firing lesions, slit nostrils, and lesions on the hindquarters and tail were chosen here as proxies to reflect anthropogenic harm).
The number of tests carried out was limited to those that were biologically relevant according to the scientific literature and working equine experts. Even so, because 59 tests were carried out for each species, the false discovery rate was controlled for (Benjamini & Hochberg, 1995), which determined that the appropriate significance level was P ≤ 0.016. In addition, because this is an exploratory study, intended to suggest relationships worthy of future research rather than only to test existing hypotheses (Bender & Lange, 2001), P-values between 0.016 and the traditional significance level of 0.05 are reported as ‘trends’; these will require confirmation through further research before they can be treated as significant.
Results
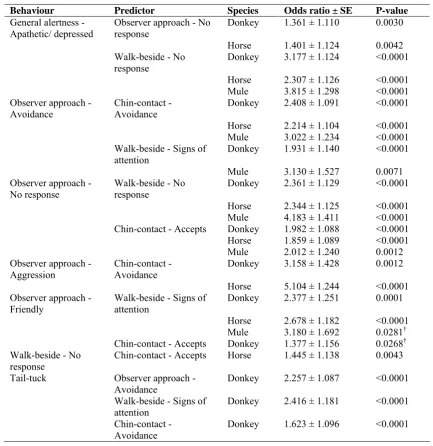
Correlations between behaviours
The prevalences of each behaviour for the three species are given in Table 2, showing that over 13% of equids appeared apathetic or depressed (the two categories are combined in the current study because only 0.6% of the animals (70 individuals) appeared depressed). Measures of unresponsiveness correlated positively with each other across the behavioural tests (Table 3). For example, in all three species, apathy correlated with a lack of response to the observer walking beside the animal, and unresponsiveness to the observer approach correlated with unresponsiveness both to the observer walking beside the animal and to chin-contact. Also, in horses and donkeys, apathy was associated with unresponsiveness to the observer approach. It should be noted that because all these results are correlational, the effect direction can be stated either way around, i.e. alert individuals were more responsive in the human-interaction tests. There were a total of 300 highly unresponsive individuals who
258 259
260 261 262 263 264 265 266 267 268
269 270
271
272 273 274 275 276 277 278 279 280 281 282
appeared apathetic and responded to none of the human-interaction tests, equating to 2.8% of all the animals (2.5% of donkeys, 3.1% of horses, and 2.9% of mules).
Behaviours that were proposed to test aversion to humans also correlated positively with each other across the tests (Table 3). In particular, avoidance of chin-contact was associated, in all three species, with avoidance of observer approach, and in donkeys and horses, with an aggressive response to observer approach. Tail-tucking in donkeys was similarly associated with avoidance of the observer and avoidance of chin-contact. Avoidance of the observer approach was seen in about 26% of donkeys, 14% of horses, and 23% of mules (Table 2). Across all species, 6.6% of animals either avoided or showed aggression to the observer and avoided chin-contact, and 2.6% of donkeys showed both those responses as well as tail-tucking.
Even the species-specific associations showed similar patterns to the above, indicating either unresponsiveness or aversion to humans (Table 3).
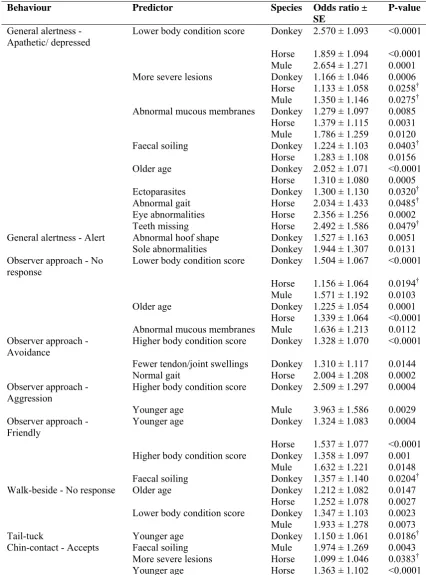
Correlations between behaviours and physical welfare problems
Apathy was associated with a number of indicators of poor health, including – in all three species – a low BCS and abnormal mucous membrane colour (and
possibly more numerous and severe skin lesions, but this was only a trend in horses and mules) (Table 4). The odds ratios show that the effect sizes could be large, such as a one-point decrease in BCS approximately doubling the chance that an animal would appear apathetic. In general, apathy and unresponsiveness to the observer were associated with lower BCSs, older age, and other health problems that depended on the species. It is also worth specifically noting that limb and foot problems (swollen tendons and/or joints in donkeys, and abnormal gaits in horses) reduced the chance that animals would show an avoidance of the observer approach. Conversely, proactive behaviours – including alertness, human avoidance behaviours, and
283 284
285 286 287 288 289
290 291 292
293
294 295 296 297
298
299 300 301 302 303 304 305 306 307
aggressive or friendly responses to the observer – were usually associated with measures such as higher BCSs and younger ages.
Exceptions to this pattern were that abnormal soles and abnormal hoof shapes were associated with alertness. There were also non-significant trends indicating that older horses might be more likely to avoid chin-contact than younger ones were; and that faecal soiling in donkeys might be associated with a friendly response to the observer.
We found no significant relationships or trends between responses to humans and anthropogenic injuries, between avoidance of chin-contact and lesions on the lips/ head, or between tail-tuck behaviour and lesions on the hindquarters/ tail.
Discussion
The results suggest that the behavioural tests incorporated into this welfare assessment have potential as welfare indicators for identifying individual animals with negative welfare, in an unresponsive state, or that consistently show behavioural aversion to unfamiliar humans.
Unresponsiveness as a working equine welfare indicator
It appears that equids with more severe and numerous physical problems enter a state of behavioural unresponsiveness, consistent across the five measurements taken here. The association with physical problems makes it highly unlikely that the behavioural unresponsiveness we have observed in the context of working equids reflects neutral or positive welfare, such as resting or relaxed states. Instead, it implies that the animals’ resources are being stretched to their limits and their fitness is compromised; the animals – of prey species – are conserving ‘energy’, possibly even at the risk of not responding appropriately to potentially threatening stimuli. In terms of the sentient experiences of these animals, this behaviour could indicate any of
308 309 310 311
312 313 314 315 316 317 318 319 320 321 322 323 324 325
326 327 328 329 330 331 332 333
several different negative welfare states, such as malaise (Kelley et al., 2003; Millman, 2007), exhaustion from overwork (Tadich et al., 1997; Pritchard et al., 2009), chronic pain (Ashley et al., 2005), apathy, or depression (Dunn et al., 2005), which may differ depending on the physical problem in question.
Most of these states can be associated with sickness behaviour, which is underlain by a ubiquitous, non-specific proinflammatory cytokine response to a range of problems (Hart, 1988; Kelley et al., 2003; Dantzer & Kelley, 2007). The generality of the response means that it is useful for identifying vulnerable animals initially, but that further diagnostic tests are required to elucidate the specific problem in each case. Sickness behaviour is adaptive in that it allows the body’s resources to be diverted towards the immune system, but the costs include reduced vigilance and a lack of maintenance behaviours, such as eating and grooming: as Hart (1988) states, “The sick individual is viewed as being at a life or death juncture and its behavior is an all-out effort to overcome the disease”. In farm animals, recommendations suggest that individuals exhibiting sickness behaviour should be rested in a quiet area to aid their recovery (e.g. Millman, 2007), but working equids in developing countries can rarely be rested, because of the extreme dependency of their owners on the daily income and subsistence provided by their animals.
Approximately 2.8% of equids appeared apathetic and failed to respond to any of the human-interaction tests, even when the observer made physical contact with their chins. While a relatively small percentage of animals, this may signify a severe welfare problem because of the association we have found between unresponsiveness and many physical problems, and it suggests that if we scale up from the 10,843 equids here to the 93.6 million equids in developing countries as a whole, approximately 2.6 million working equids may be in this unresponsive state worldwide.
334 335 336 337 338 339 340 341 342 343 344 345 346 347 348
349 350 351 352 353 354 355 356 357 358 359 360 361
The unresponsive measure that was associated with the most physical problems in the three species was an apathetic general attitude, in which state
approximately 13% of the equids were classified. This attained acceptable reliability within observers, but poor reliability between observers (Burn et al., 2009)
(remembering that the observers in the current study were only those who attained at least 80% agreement with the trainer). This suggests that some observers used
different thresholds or differing cues for ascribing the more ambiguous animals to one category of alertness or another. However, the biologically plausible associations between apathy, unresponsiveness in the other tests, and physical problems, suggest that the alertness/apathy distinction describes an underlying biological construct that was strong enough to be observed here despite this. Alertness/apathy in working equids could therefore constitute a sensitive, if non-specific, marker of underlying problems that would otherwise only be identified on closer inspection; another such indicator in these animals is BCS, which correlates with many other diverse physical problems (Burn et al., in press).
Nevertheless, assessment of alertness/apathy should be refined, particularly for studies where this brief, broad-brush assessment protocol could be replaced with a more focussed and in-depth assessment. The behavioural assessment could be improved by breaking alertness down into its observable components (e.g. ear
movement and position, eye closure, head position, and foot and tail movement, etc), or by adding a greater number of subjective ‘whole animal’ descriptors (e.g. rigid posture, restless, relaxed, asleep/resting or eating, etc). A refined system could not only improve inter-observer reliability, but would also allow greater discrimination between different negative, unresponsive welfare states; for example, a rigid stance, inattentive to the external environment, is often associated with chronic pain (Ashley et al., 2005), and thus might be distinguishable from the more ‘slumped’ stance associated with depression/exhaustion. Similarly, the associations observed here between foot abnormalities and alertness in donkeys, might be attributed to foot pain
362 363 364 365 366
367
368 369 370 371 372 373 374 375
376 377 378 379 380 381 382 383 384 385 386 387
causing weight-shifting behaviour (Ashley et al., 2005) (foot movement constitutes part of the ‘alert’ descriptor here), rather than donkeys with abnormal feet being alert per se. Other suggestions of pain in the animals observed here were the associations between reduced observer avoidance and presence of limb swellings/ gait
abnormalities in donkeys and horses, respectively.
Human-equine interactions
Aversion to the observer was suggested through the significant associations between avoidance or aggression towards the observer approach, a tail-tuck response in donkeys, and avoidance of chin-contact. The trend associating a friendly response to the observer with acceptance of chin-contact in donkeys lends some weight towards this being more than just an active/ passive distinction between responses to the observer. The acceptable inter-observer reliability of these tests further suggests that individual animals are consistent in how they respond to different unfamiliar strangers (Burn et al., 2009).
These tests did not actually correlate with any likely anthropogenic
pathologies, so we have no evidence to suggest that aversion to the observer indicates fear of being physically injured by them. Of course, a lack of significance does not mean that no relationship exists, but with the large total number of animals sampled here, we should have had sufficient power to at least detect strong associations within the current dataset. More sensitive and diverse measurements might reveal more subtle relationships, as the measurements here were not recorded for the purposes of the current study, so they are quite limited. Another limitation was that the response to the (unfamiliar) observer may not reflect the response to the animals’ regular
handlers, but the animal attendants would not have been able to carry out the human-interaction tests in a standardised manner; hence trained observers were used as the stimuli instead.
388 389 390 391 392 393 394 395 396 397 398
399 400 401 402 403 404 405 406
407 408
409 410 411 412 413
To confirm whether the aversion to the observer assessed here reflects fear or aversion to humans, rather than, say, aversion to any novel stimuli, more focused experimental studies will be required. Well validated indicators of fear should correlate with the proposed fear or aversion behaviours. For example, opportunistic observations of owner/ user behaviours that are known to cause poor welfare and/or aversions to humans in farm animals, such as slapping, beating or shouting (Rushen et al., 1999; Hemsworth, 2003), could be informative. Such observations might be expected to show that animals that are regularly slapped, beaten or shouted at by their users would generally respond with more behaviours or physiological responses that indicate fear or aversion to humans (possibly including learned helplessness in some extreme cases of chronic stress: Vollmayr & Henn, 2003).
Nevertheless, the correlations between tests again suggest that the behaviours are rooted in a biological construct that is consistent within individual equids, and which generalises to different unfamiliar humans. If this represents fear of humans or of novel stimuli generally, it is of concern because some of the behaviours were fairly prevalent: for example, approximately a quarter of donkeys and mules attempted to avoid the observer approach. Clearly this is a topic that merits further research, and interventions may be necessary to facilitate an improvement in the relationships between working equids and their human handlers.
Physical problems that were most strongly associated with
behavioural effects
A final aspect of welfare significance that these results bring to light, is the relative importance of particular physical problems in terms of the behavioural associations seen here. The physical problems that correlated most strongly with unresponsiveness can be summarised as low BCS, abnormal mucous membrane colour, and to a lesser extent, numerous and severe skin lesions, where the association
414 415 416 417 418 419 420 421 422 423 424 425 426 427 428 429 430
431 432 433 434 435 436 437 438 439 440 441
with apathy and at least one other measure of unresponsiveness was observed across all three species. As mentioned previously, lower BCS correlates with many other physical problems in working equids, which is of concern since over 29% of working equids were scored as ‘very thin’ (≤1.5 on a scale of 1 – 5: very thin – very fat) (Burn et al., in press). The causes of low BCS are multifactorial, and likely to include malnutrition, overwork, parasitism, and disease, which could simultaneously cause behavioural unresponsiveness. Conversely, behavioural unresponsiveness may
include a reduced appetite, as in sickness (Hart, 1988; Dantzer & Kelley, 2007; Weary et al., 2009) and depression (Vollmayr & Henn, 2003), which would further reduce BCS. Skin lesions in these animals are also known to be severe and numerous, with over 25% of equids having at least one moderate or deep lesion, and 62% having 1 – 13 lesions larger than 2x2 cm (Burn et al., in press). The lesions could cause apathy through pain and/or infection, or conversely an apathetic animal may be more prone to lesions if it stumbles or collides with objects. It is well known that thinner equids have more lesions (e.g. Pritchard et al., 2005; Burn et al., in press), but this correlation does not explain the association between apathy and lesion severity, because the association remained significant even when BCS was included in the model.
The relationship between apathy and abnormal mucous membrane colour was more unexpected, because mucous membrane colour is subjective, and it attained poor inter-observer reliability (Burn et al., 2009). Nevertheless, in the current study, the relationship was significant in all three species, and abnormal mucous membrane colour does appear to give a clinically useful indication of anaemia, including illnesses, such as colic (e.g. Thoefner et al., 2001), diarrhoea (Hillyer, 2004), or babesiosis (Hailat et al., 1997). The current study therefore suggests that illnesses like these are associated with an apathetic behavioural state in working equids, consistent with sickness induced lethargy and/or pain (Aubert, 1999; Millman, 2007; Weary et al., 2009). In previous haematological studies, even apparently healthy equids working in Pakistan, had lower concentrations of haemoglobin, erythrocytes and
442 443 444
445 446 447 448 449
450 451 452 453 454 455 456 457 458
459 460 461 462 463 464 465 466 467 468
haematocrit than those seen in horses in developed countries, indicating that sub-clinical anaemia is prevalent in these working equids (Gul et al., 2007; Pritchard et al., 2009).
The observer reliability of mucous membrane colour assessment requires improvement by including more categories than simply ‘normal’ or ‘abnormal’. For example, it could include standardised colour descriptors as in the study by Thoefner and colleagues (2001), as well as an ordinal score indicating whether the abnormality was mild, moderate or pronounced.
Other physical problems that were significantly associated with apathy or unresponsiveness to the human-interaction tests in more than one species were faecal soiling (indicative of diarrhoea) and older age (Table 4). Eye abnormalities also more than doubled the chance of a horse appearing apathetic; eye closure formed part of the classification of an animal as apathetic, but this result may suggest that many eye abnormalities could be painful, in horses at least. It should be noted that other physical problems not reaching significance in the current study might also have detrimental effects on equine welfare, such as acute, localised pain, or general anxiety, which we did not attempt to measure here.
The only positive welfare indicator in the current study was a friendly response to the observer approach. This shows promise, as it was significantly associated with a younger age and better BCS. More ambiguously, however, there was a non-significant trend towards a higher likelihood of faecal soiling, indicating diarrhoea, in friendlier donkeys. This may be a Type I error, but is worth mentioning speculatively because some owners or tourists may hand-feed the animals certain inappropriate foods, making the animals more friendly but also inadvertently giving them diarrhoea. Other positive welfare indicators could help identify additional subtle effects of the physical conditions on welfare. Few positive welfare indicators have yet been validated in animal welfare science (Boissy et al., 2007; Yeates & Main, 2008),
469 470
471
472 473 474 475 476 477 478 479 480 481 482 483 484 485 486 487 488 489 490 491
492 493
494 495
but it would be worth incorporating such measures into a field assessment protocol once that becomes practicable in the future.
Summary
In summary, behavioural unresponsiveness correlated across the behavioural measures in the current study, and was associated with more numerous or severe physical conditions. The strongest associations were found between an apathetic general attitude and lower BCS, abnormal mucous membrane colour, older age, and (in horses) eye abnormalities; apathy/alertness may therefore provide a useful – if non-specific –indicator for rapidly identifying animals most in need of welfare interventions. Behaviours that were proposed to indicate aversion to humans correlated across the four human-interaction tests, but showed no significant relationships with physical problems that might suggest injury by humans. Further research will be necessary to investigate fear of humans in these animals, since 21% of equids avoided the observer. Many of the measurements taken here should be refined for future, more in-depth welfare assessments, especially alertness and mucous membrane colour, which showed poor inter-observer agreement. Nevertheless, our results suggest that the behaviours included in this welfare assessment show promise as working equine welfare indicators, and deepen our understanding of the relationships between behaviour and physical health in these animals. The associations found here are correlational, so experimental research will be required to understand their causal relationships, and to develop effective
interventions to improve working equine welfare.
Acknowledgements
This study was supported and funded by the Brooke Hospital for Animals.
Many thanks to all the owners who kindly permitted their animals to be used in this study, and to the observers who collected the data. We are grateful for Dr Joy C.
496 497 498
499 500
501 502
503 504 505 506 507 508 509 510 511 512 513 514 515 516 517 518 519 520 521 522 523 524 525 526 527 528 529 530 531 532 533 534 535
Pritchard’s constructive comments on the manuscript. We would also like to thank the Kenya Network for Dissemination of Agricultural Technologies, Equinos Sano para El Pueblo (ESAP, Guatemala), Gambia Horse and Donkey Trust, and the Aga Khan
Rural support programme (Chitral, Pakistan) for their collaboration; the Afghanistan data were collected in association with the Committee for Rehabilitation of Aid to
Afghanistan; also, in 2003 Help in Suffering and The Blue Cross assisted with the Jaipur and the Hyderabad welfare assessments in India, respectively.
References
Ashley, F.H., Waterman-Pearson, A.E., Whay, H.R., 2005. Behavioural assessment of pain in horses and donkeys: application to clinical practice and future studies. Equine Vet. J.37, 565-575.
Aubert, A., 1999. Sickness and behaviour in animals: a motivational perspective. Neurosci. Biobehav. Rev.23, 1029-1036.
Bender, R., Lange, S., 2001. Adjusting for multiple testing--when and how? J. Clin. Epidemiol.54, 343-349.
Benjamini, Y., Hochberg, Y., 1995. Controlling the false discovery rate: a practical and powerful approach to multiple testing. J. Roy. Stat. Soc. B.57, 289-300. Boissy, A., Manteuffel, G., Jensen, M.B., Moe, R.O., Spruijt, B., Keeling, L.J.,
Winckler, C., Forkman, B., Dimitrov, I., Langbein, J., Bakken, M., Veissier, I., Aubert, A., 2007. Assessment of positive emotions in animals to improve their welfare. Physiol. Behav.92, 375-397.
Broster, C.E., Burn, C.C., Barr, A.R.S., Whay, H.R., 2009. The range and prevalence of pathological abnormalities associated with lameness in working horses from developing countries. Equine Vet. J.41, 474-481.
Burden, F.A., Du Toit, N., Hernandez-Gil, M., Prado-Ortiz, O., Trawford, A.F., in press. Selected health and management issues facing working donkeys presented for veterinary treatment in rural Mexico: some possible risk factors and potential intervention strategies. Trop. Anim. Health Prod.
Burn, C.C., Pritchard, J.C., Whay, H.R., 2009. Observer reliability for working equine welfare assessment: problems with high prevalences of certain results. Anim. Welf.18, 177-187.
Burn, C.C., Dennison, T.L., Whay, H.R., in press. Environmental and demographic risk factors for poor welfare in working horses, donkeys, and mules in developing countries. Vet. J.
Dantzer, R., Kelley, K.W., 2007. Twenty years of research on cytokine-induced sickness behavior. Brain. Behav. Immun.21, 153-160.
Dawkins, M.S., Donnelly, C.A., Jones, T.A., 2004. Chicken welfare is influenced more by housing conditions than by stocking density. Nature427, 342-344. de Aluja, A.S., 1998. The welfare of working equids in Mexico. Appl. Anim. Behav.
Sci.59, 19-29.
536 537 538 539 540 541 542 543
de Passille, A.M., Rushen, J., 2005. Can we measure human-animal interactions in on-farm animal welfare assessment?: Some unresolved issues. Appl. Anim. Behav. Sci.92, 193-209.
Dunn, A.J., Swiergiel, A.H., Beaurepaire, R.d., 2005. Cytokines as mediators of depression: What can we learn from animal studies? Neurosci. Biobehav. Rev. 29, 891-909.
FAOSTAT. (2006). FAO statistical database website. Food and Agricultural Organisation of the United Nations. Retrieved 7 July 2008, from http://faostat.fao.org/site/409/default.aspx 544 545 546 547 548 549 550 551 552 553 554 555 556 557 558 559 560 561 562 563 564 565 566 567 568 569 570 571 572 573 574 575 576 577 578 579 580 581 582 583 584
Gul, S.T., Ahmad, M., Khan, A., Hussain, I., 2007. Haemato-biochemical
observations in apparently healthy equine species. Pak. Vet. J.27, 155-158. Hailat, N.Q., Lafi, S.Q., Al-Darraji, A.M., Al-Ani, F.K., 1997. Equine babesiosis
associated with strenuous exercise: clinical and pathological studies in Jordan. Vet. Parasitol.69, 1-8.
Hart, B.L., 1988. Biological basis of the behavior of sick animals. Neurosci. Biobehav. Rev.12, 123-137.
Hausberger, M., Roche, H., Henry, S., Visser, E.K., 2008. A review of the human-horse relationship. Appl. Anim. Behav. Sci.109, 1-24.
Hemsworth, P.H., 2003. Human-animal interactions in livestock production. Appl. Anim. Behav. Sci.81, 185-198.
Hillyer, M., 2004. A practical approach to diarrhoea in the adult horse. In Pract.26, 2-11.
Kelley, K.W., Bluthé, R.-M., Dantzer, R., Zhou, J.-H., Shen, W.-H., Johnson, R.W., Broussard, S.R., 2003. Cytokine-induced sickness behavior. Brain. Behav. Immun.17, S112-S118.
Millman, S.T., 2007. Sickness behaviour and its relevance to animal welfare assessment at the group level. Anim. Welf.16, 123-125.
Paul, E.S., Harding, E.J., Mendl, M., 2005. Measuring emotional processes in
animals: the utility of a cognitive approach. Neurosci. Biobehav. Rev.29, 469-491.
Pritchard, J.C., Whay, H.R., 2003 (unpublished). Guidance notes to accompany working equine welfare assessment. Bristol: University of Bristol. Pritchard, J.C., Whay, H.R., 2004 (unpublished). Guidance notes to accompany
working equine welfare assessment. Bristol: University of Bristol.
Pritchard, J.C., Lindberg, A.C., Main, D.C.J., Whay, H.R., 2005. Assessment of the welfare of working horses, mules and donkeys, using health and behaviour parameters. Prev. Vet. Med.69, 265-283.
Pritchard, J.C., Barr, A.R.S., Whay, H.R., 2006. Validity of a behavioural measure of heat stress and a skin tent test for dehydration in working horses and donkeys. Equine Vet. J.38, 433-438.
Pritchard, J.C., Barr, A.R.S., Whay, H.R., 2007. Repeatability of a skin tent test for dehydration in working horses and donkeys. Anim. Welf.16, 181-183. Pritchard, J.C., Burn, C.C., Barr, A.R.S., Whay, H.R., 2008. Validity of indicators of
dehydration in working horses: a longitudinal study of changes in skin tent duration, mucous membrane dryness and drinking behaviour. Equine Vet. J. 40, 558-564.
Pritchard, J.C., Burn, C.C., Whay, H.R., 2009. Haematological and serum biochemical reference values for apparently healthy working horses in Pakistan. Res. Vet. Sci.87, 389-395.
585 586 587 588 589 590 591 592 593 594 595 596 597 598 599 600 601 602 603 604 605 606 607 608 609 610 611 612 613 614 615 616 617 618 619
Regan, F.H., 2009a. Behavioural indicators of pain in working donkeys. Unpublished PhD thesis, University of Bristol, Bristol.
Regan, F.H., 2009b. Behavioural responses to the provision of a non-steroidal anti-inflammatory drug (meloxicam) (Chapter 4) In: Behavioural Indicators of Pain in Working Donkeys. Unpublished PhD thesis, University of Bristol, Bristol. Rushen, J., Taylor, A.A., de-Passille, A.-M., 1999. Domestic animals' fear of humans
and its effect on their welfare. Appl. Anim. Behav. Sci.65, 285-303. Rutherford, K.M.D., Langford, F.M., Jack, M.C., Sherwood, L., Lawrence, A.B.,
Haskell, M.J., 2009. Lameness prevalence and risk factors in organic and non-organic dairy herds in the United Kingdom. Vet. J.180, 95-105.
Saul, C., Siefert, L., Opuda-Asibo, J., in press. Disease and health problems of donkeys: a case study from eastern Uganda. In Donkeys and donkey technology: Animal Traction Network for Eastern and Southern Africa. Tadich, N., Mendez, G., Wittwer, F., Meyer, K., 1997. Valores bioquímicos
sanguíneos de equinos que tiran carretones en la ciudad de Valdivia (Chile) (Blood biochemical values of loadcart draught horses in the city of Valdivia (Chile)). Arch. Med. Vet.29, 45-53.
Tesfaye, A., Curran, M.M., 2005. A longitudinal survey of market donkeys in Ethiopia. Trop. Anim. Health Prod.37, 87-100.
Thoefner, M.B., Ersbøll, A.K., Jensen, A.L., Hesselholt, M., 2001. Factor analysis of the interrelationships between clinical variables in horses with colic. Prev. Vet. Med.48, 201-214.
Vollmayr, B., Henn, F.A., 2003. Stress models of depression. Clin. Neurosci. Res.3, 245-251.
Waiblinger, S., Boivin, X., Pedersen, V., Tosi, M.-V., Janczak, A.M., Visser, E.K., Jones, R.B., 2006. Assessing the human-animal relationship in farmed species: A critical review. Appl. Anim. Behav. Sci.101, 185-242.
Waters, A.J., Nicol, C.J., French, N.P., 2002. Factors influencing the development of stereotypic and redirected behaviours in young horses: findings of a four year prospective epidemiological study. Equine Vet. J.34, 572-579.
Weary, D.M., Huzzey, J.M., von Keyserlingk, M.A.G., 2009. Using behavior to predict and identify ill health in animals. J. Anim. Sci.87, 770-777.
Yeates, J.W., Main, D.C.J., 2008. Assessment of positive welfare: A review. Vet. J. 175, 293-300.
Table 1
620621
Variable Possible categorisations Brief definition
General
Age <5 / 5-15 / >15 (Assessed by observing the teeth) Sex stallion / gelding / mare N/A
Work type Tourism (riding)/ Tourism (carriage)/ Human transport (carriage)/ Human
transport (riding)/ Goods transport (cart)/ Goods transport (pack)/ Agriculture/
Brick kiln (cart)/ Brick kiln (pack)/ Ceremonial/ Foal of working mother/ or Other
N/A
Behaviour
General
alertness alert / apathetic / depressed (apathetic and depressed were combined in the current study)
Responding to surroundings e.g. ears moving and often forward, eyes open, feet may be moving, tail swishing, head up unless sniffing or eating/ passive response to surroundings e.g. small ear movements, some tail swishing, feet may be moving, eyes may be half-closed, head may be lowered/ Unresponsive to surroundings, e.g. ears still and lowered, eyes closed or half-closed, no tail-swishing or foot movement, head lowered.
Observer
approach moves away / turns head away / no response / friendly/ aggressive (moves away and turns away were combined in the current study)
Moves or attempts to move away/ turns head away/ no obvious response/ Turns head towards, ears forward / Attempts to bite, rear, kick or strike with foreleg; ears held back or flattened
Walk-beside no response / signs of
attention No obvious response/ signs of attention e.g. ears turn towards, head turns towards, moves towards or away, attempts to kick
Tail-tuck (donkeys only)
no response/ tail-tuck Tail remains relaxed/ clamps down tail or tucks in hindquarters
Chin-contact accepts / avoids Shows no response chin-contact/ Moves its head to avoid or reject contact
General health
Body
condition 1 – 5 (including half-scores) Ribs, spine and hips prominent, neck topline concave, hollow pelvis/ Ribs, spine and hips visible, flat pelvis/ Spine just visible, neck topline straight, slightly rounded pelvis/ Spine not visible, neck topline slightly convex, rounded pelvis/ neck topline distinctly convex, rounded pelvis with ‘gutter’ along spine Faecal soiling faecal soiling present /
absent Spattered faecal matter, dried or fresh, on inner thighs or back of hocks/ absent e.g. no staining or staining from mud, grass or other materials
Ectoparasites present / absent Ticks, mites, bot eggs, lice, or lice eggs anywhere on
the body/ none observed
Eyes no abnormalities / abnormal Healthy eyes/ At least one eye with wet eyelashes, discharge, redness, swelling, opacity or injury Mucous
membranes normal colour / abnormal Pink/ Abnormal e.g. yellowish, pale, reddish, greyish or purpleish Teeth missing yes / no (only assessed
during 2003-2004) At least one tooth missing/ All teeth present
Skin lesions
General lesions
Severity score (0, 1, 2, 3) x number of affected locations on body
Severity scores: <2x2 cm / superficial / broken skin / deep
Locations of lesions: breast,and shoulders, ears, forelegs, girth and belly, head, hindlegs, hindquarters, knees, lips, neck, point-of -hock, ribs, flank, tail and tailbase, withers and spine
Firing lesions Severity score (0, 1, 2, 3) Severity scores: 0 - 2x2 cm / superficial / broken skin / deep
Limb and foot pathology
Swollen tendons and joints
yes / no Cannon bone, suspensory ligament, flexor tendons and fetlock joint are clearly visible and distinct from each other in all four legs/ In one or more legs, the distinction between the suspensory ligament, tendons and joint become unclear; the lower part of the tendon and the back of the fetlock joint may look bulgy, lumpy or square in shape
Hoof horn
quality normal / abnormal Healthy / abnormalities e.g. broken hoof wall, cracks, ridges, wavy or non-parallel rings Hoof shape normal / abnormal Medio-laterally symmetrical, coronary band
horizontal, and toe and heel wall slopes parallel / Medio-laterally asymmetrical, coronary band slanted, and toe and heel not parallel (e.g. toe overgrown or excessively short)
Sole shape
and structure normal / abnormal Round in horses; keyhole-shaped in donkeys; symmetrical, with intact frog, distinct bars and slightly cupped sole / asymmetrical, cracked, oval or pear-shaped; frog narrow, hard, atrophied or missing; bars missing; sole flat; or sheared heels
Gait normal / abnormal Normal and even / any reluctance to put weight on a limb, asymmetrical dropping or raising of hip, uneven nodding of head, short or uneven stride length 622
623 624 625 626 627
Brief descriptions of the behavioural and physical measures taken as part of a working equine welfare assessment. More detailed descriptions can be found in a 102-page, illustrated guidance booklet (Pritchard & Whay, 2003 (unpublished); 2004
(unpublished), available upon request from the authors). The protocol and sequence in which these measurements were taken are described in the text.
Table 2
628Behavioural response Donkeys (%) Horses (%) Mules (%)
General alertness - Apathetic/ depressed 13.1 13.7 13.4 Observer approach - No response 64.6 68.7 61.5 Observer approach - Avoidance 25.9 14.2 23.0 Observer approach - Aggression 0.3 1.7 0.7 Observer approach - Friendly 11.3 15.5 14.8 Walk-beside - Signs of attention 91.2 86.6 90.0
Tail-tuck 21.2 N/A N/A
Chin-contact - Avoidance 16.4 20.6 15.4 629
630 631 632 633 634
The percentages of each working equine species displaying the behaviours recorded here. The percentages are compiled from 5481 donkeys, 4504 horses, and 858 mules across nine developing countries. In the general alertness measurement, apathy and depression were combined, and in the observer approach test, moving and turning away were summed as ‘avoidance’.
Table 3
635Behaviour Predictor Species Odds ratio ± SE P-value
General alertness -
Apathetic/ depressed Observer approach - No response Donkey 1.361 ± 1.110 0.0030 Horse 1.401 ± 1.124 0.0042 Walk-beside - No
response
Donkey 3.177 ± 1.124 <0.0001
Horse 2.307 ± 1.126 <0.0001 Mule 3.815 ± 1.298 <0.0001 Observer approach -
Avoidance
Chin-contact - Avoidance
Donkey 2.408 ± 1.091 <0.0001
Horse 2.214 ± 1.104 <0.0001 Mule 3.022 ± 1.234 <0.0001 Walk-beside - Signs of
attention
Donkey 1.931 ± 1.140 <0.0001
Mule 3.130 ± 1.527 0.0071 Observer approach -
No response Walk-beside - No response Donkey 2.361 ± 1.129 <0.0001 Horse 2.344 ± 1.125 <0.0001 Mule 4.183 ± 1.411 <0.0001 Chin-contact - Accepts Donkey 1.982 ± 1.088 <0.0001 Horse 1.859 ± 1.089 <0.0001 Mule 2.012 ± 1.240 0.0012 Observer approach -
Aggression Chin-contact - Avoidance Donkey 3.158 ± 1.428 0.0012 Horse 5.104 ± 1.244 <0.0001 Observer approach -
Friendly Walk-beside - Signs of attention Donkey 2.377 ± 1.251 0.0001 Horse 2.678 ± 1.182 <0.0001 Mule 3.180 ± 1.692 0.0281† Chin-contact - Accepts Donkey 1.377 ± 1.156 0.0268† Walk-beside - No
response Chin-contact - Accepts Horse 1.445 ± 1.138 0.0043 Tail-tuck Observer approach -
Avoidance
Donkey 2.257 ± 1.087 <0.0001
Walk-beside - Signs of
attention Donkey 2.416 ± 1.181 <0.0001
Chin-contact -
Avoidance
Donkey 1.623 ± 1.096 <0.0001
636 637 638 639 640 641 642 643 644 645
Statistically significant associations between behaviours recorded as part of a working equine welfare assessment, split by equine species. Five behavioural measurements were made: general alertness, observer approach, walk-beside, tail-tuck (in donkeys only), and chin-contact. Because the study was correlational, the associations between the behaviours in the first and second columns could be stated either way around, but the way they are reported in the table reflects the statistical models. The effect sizes are presented as odds ratios (± SE), and the alpha level was set at a P-value of 0.016 to adjust for the false discovery rate; †indicates trends for which P <0.05, but which failed to meet the adjusted significance level.
Table 4
646Behaviour Predictor Species Odds ratio ±
SE
P-value
General alertness -
Apathetic/ depressed Lower body condition score Donkey 2.570 ± 1.093 <0.0001 Horse 1.859 ± 1.094 <0.0001 Mule 2.654 ± 1.271 0.0001 More severe lesions Donkey 1.166 ± 1.046 0.0006 Horse 1.133 ± 1.058 0.0258† Mule 1.350 ± 1.146 0.0275† Abnormal mucous membranes Donkey 1.279 ± 1.097 0.0085 Horse 1.379 ± 1.115 0.0031 Mule 1.786 ± 1.259 0.0120 Faecal soiling Donkey 1.224 ± 1.103 0.0403†
Horse 1.283 ± 1.108 0.0156 Older age Donkey 2.052 ± 1.071 <0.0001
Horse 1.310 ± 1.080 0.0005 Ectoparasites Donkey 1.300 ± 1.130 0.0320† Abnormal gait Horse 2.034 ± 1.433 0.0485† Eye abnormalities Horse 2.356 ± 1.256 0.0002 Teeth missing Horse 2.492 ± 1.586 0.0479† General alertness - Alert Abnormal hoof shape Donkey 1.527 ± 1.163 0.0051 Sole abnormalities Donkey 1.944 ± 1.307 0.0131 Observer approach - No
response Lower body condition score Donkey 1.504 ± 1.067 <0.0001 Horse 1.156 ± 1.064 0.0194† Mule 1.571 ± 1.192 0.0103 Older age Donkey 1.225 ± 1.054 0.0001 Horse 1.339 ± 1.064 <0.0001 Abnormal mucous membranes Mule 1.636 ± 1.213 0.0112 Observer approach -
Avoidance Higher body condition score Donkey 1.328 ± 1.070 <0.0001 Fewer tendon/joint swellings Donkey 1.310 ± 1.117 0.0144 Normal gait Horse 2.004 ± 1.208 0.0002 Observer approach -
Aggression Higher body condition score Donkey 2.509 ± 1.297 0.0004 Younger age Mule 3.963 ± 1.586 0.0029 Observer approach -
Friendly
Younger age Donkey 1.324 ± 1.083 0.0004
Horse 1.537 ± 1.077 <0.0001 Higher body condition score Donkey 1.358 ± 1.097 0.001
Mule 1.632 ± 1.221 0.0148 Faecal soiling Donkey 1.357 ± 1.140 0.0204† Walk-beside - No response Older age Donkey 1.212 ± 1.082 0.0147
Horse 1.252 ± 1.078 0.0027 Lower body condition score Donkey 1.347 ± 1.103 0.0023 Mule 1.933 ± 1.278 0.0073 Tail-tuck Younger age Donkey 1.150 ± 1.061 0.0186† Chin-contact - Accepts Faecal soiling Mule 1.974 ± 1.269 0.0043 More severe lesions Horse 1.099 ± 1.046 0.0383† Younger age Horse 1.363 ± 1.102 <0.0001 647
648 649 650 651
Statistically significant associations between behaviours and physical problems recorded as part of a working equine welfare assessment, split by equine species. Five behavioural measurements were made: general alertness, observer approach, walk-beside, tail-tuck (in donkeys only), and chin-contact. Because the study was
correlational, the associations between the variables in the first and second columns could be stated either way around, but the way they are reported in the table reflects the way they were tested in the statistical models. The effect sizes are presented as odds ratios (± SE), and the alpha level was set at a P-value of ≤0.016 to adjust for the false discovery rate;
652 653 654 655 656 657
†indicates trends for which P <0.05, but which failed to meet the adjusted significance level.