JIEM, 2014 – 7(1): 100-114 – Online ISSN: 2013-0953 – Print ISSN: 2013-8423 http://dx.doi.org/10.3926/jiem.940
Analysis on Predict Model of Railway Passenger Travel Factors
Judgment with Soft-computing Methods
Yan Xi, Li Jing
Beijing Jiaotong University (China)
[email protected], [email protected]
Received: September 2013
Accepted: November 2013
Abstract:
Purpose:
With the development of the transportation, more traveling factors acting on the
railway passengers change greatly with the passengers’ choice. With the help of the modern
information computing technology, the factors were integrated to realize quantitative analyze
according to the travel purpose and travel cost.
Design/methodology/approach:
The detailed comparative study was implemented with
comparing the two soft-computing methods: genetic algorithm, BP neural network. The two
methods with different idea were also studied in this model to discuss the key parameter setting
and its applicable range.
Findings:
During the study, the data about the railway passengers is difficult to analyzed
detailed because of the inaccurate information. There are still many factors to affect the choice
of passengers.
Research limitations/implications:
The model-designing thought and its computing
procession were also certificated with programming and data illustration according to thorough
analysis. The comparative analysis was also proved effective and applicable to predict the railway
passengers’ travel choice through the empirical study with soft-computing supporting.
Originality/value:
The detail form comparative study in this paper could be provided for
researchers and managers and be applied in the practice according the actual demand.
Keywords:
railway passenger, travel choice, genetic algorithm, BP neural network, soft-computing
1. Introduction
Railway is an effective way to solve the rapid transportation problem of large number of passengers on a major thoroughfare. In recent years, along with the accelerating process of urbanization in China, there is increasingly demand for transportation between big cities, and China is stepping into the period of great construction and development of railway. The completion of different transportation modes between cities is increasingly fierce especially railway and aviation. In order to better planning and coordination of the overall transportation system, and better construction and operation of railway network, so that the railway can make a bigger social and economic benefits, and one of the key issues is derived from the understanding of railway passengers’ travel choices. In this paper, the information of railway passengers’ travel choice behavior is used as the data base, and apply two soft computing methods to make models for analysis and prediction of railway passenger’ travel choice. According to comparative study in detail, make a discussion about the application of different soft computing methods, which has important theoretical significance and practical value to improve the scientific and accuracy of predicting for travel choice.
2. Analysis of Present Research
At present applying soft computing method to the research of behavior problems is at the beginning stage. For example, Avineri (2004) built the passenger travel choice psychological fuzzy time parameters model based on Prospect Theory. Qiang, Bin, Rui and Xia (2008) made an empirical comparative analysis between Support Vector Machine Model, Multi-logit Model and Multilayer Feedforward Neural Network. Jin and Jia (2008) applied radial basis function neural network factors and general regression neural network factors to establish a new prediction model for passenger travel problems in traffic modeling. Ma (2007) combined the advantages of neural network in the nonlinear relationship, and proposed the BP neural network model for traffic and travel. Based on the genetic clustering algorithm, Jie, De, Yuan and Quo (2009) proposed a travel behavior analysis method for the effectiveness of K-method clustering algorithm for categorical data clustering, and the good self-organizing, adaptive and self-learning ability of Genetic Algorithm. Based on the survey data for residents travel in Fangshan District of Beijing, Qiu and Wang (2008) tested the feasibility and effectiveness of applying probabilistic neural network to the prediction of residents travel choice.
Based on the above, there are researches for passengers’ travel choices, but because of different starting points, apart from the great differences among the above related research methods, models, experimental conclusions and theoretical details, they are also not suitable for the deep-seated reveal of railway passengers’ travel choice problem. In existing prediction models, quantitative factors are only for the macro data in a specific section (such as certain administrative areas), ignoring some important details of travel choice that would be considered by residents, such as soft factors like comfort, punctuality, safety etc. Thus the problem information can be considered incompletely, missing some important factors, what’s more, not making a scientific and objective analysis for the weight of the factors, and the discussion of the constrains is also very vague in the prediction model. So it is necessary to make comparative research and discussion about the application scope, the relevant parameters and constraints of different soft computing methods. In this paper, Genetic Algorithms and Neural Network are two examples of soft computing methods for a comparative research.
3. Study on Railway Passenger Travel Choice Prediction based on Genetic Algorithm
iteration called a generation. In each generation, the fitness of every individual in the population is evaluated; the fitness is usually the value of the objective function in the optimization problem being solved. The more fit individuals are stochastically selected from the current population, and each individual's genome is modified (recombined and possibly randomly mutated) to form a new generation. The new generation of candidate solutions is then used in the next iteration of the algorithm. Commonly, the algorithm terminates when either a maximum number of generations has been produced, or a satisfactory fitness level has been reached for the population.
Passengers make travel choices will be influenced by some objective, potential factors. Through analyzing the passengers' characteristics and different factors' effects on passengers, we got a flow chart of passenger travel.
3.1. Theoretical Model
The problem was described as: there were m travel modes and n batches of passengers (category) waiting to be distributed.
Before the target allocation, the key considerations of each batch of the target and each travel mode's weight on each target has been evaluated and sorted. J-approved visitors' "travel value" is wj, i-approved travel mode's weight on j-approved target is
p
ij, and each travelmode's "trial" benefit value on each target is
u
ij= w
j*p
ij. Among them,u
ij stands for each batchof the passenger's size of the degree of the effectiveness of the "trial". The purpose is to meet the basic principles of the target allocation and pursuit of the overall effectiveness of the best,
which is seeking
max(
)
1
∑
= n
j ij
u
.3.2. Methods
This paper used binary encoding and the number of individuals was 40. In addition, the max number of generations was 50 and the generation gap was 0.9.
This paper used PN instead of passenger numbers and TV instead of travel value.
Choices for passengers to choose for travel:
①EMUs ②Direct train ③Coach ④Aircraft ⑤MICE
3.2.1. According to the Purpose
Passengers for business always focus on convenience and comfort, but have low sensitivity of the cost, so the weight for the price dimension is 0,for the time dimension is 0.6 and for the environment is 0.4, that is, for the purpose of business, "travel value " is 0.6 * 2.69 + 0.4 * 4.47 = 3.402. Passengers for tourism often focus on comfort and fare levels, and have high sensitivity of the cost, so the weight for the price dimension is 0.3 and for the environment is 0.7, that is for the purpose of tourism, "travel value” is 0.7 * 4.47 + 0.3 * 3.16 = 4.077. Work, school and other commuter passenger traffic often takes fare for the primary consideration, and has certain requirements on punctuality, so the "travel value" for the passengers whose purpose is going to work is 0.6 * 2.69 + 0.4 * 3.16 = 2.878, passengers to school's "travel value " is 0.2 * 2.69 + 0.8 * 3.16 = 3.066. Passengers for home have low requirements for the comfort, often focus on the price level and have high sensitivity for the costs, so the "travel value" is 1 * 3.16 = 3.16. Passengers for transfer have high requirements for time, so the "travel value" is 1 * 2.69 = 2.69. Other passengers' weights are similar, that is, its "travel value" is 0.3 * 2.69 + 0.3 * 4.47 + 0.4 * 3.16 = 3.412.
PN 1 2 3 4 5 6 7
TV (wj) 3.402 4.077 2.878 3.066 3.16 2.69 3.412
Table 1. Travel Value: According to the Travel Purpose
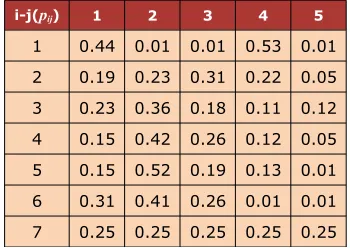
i-j(pij) 1 2 3 4 5
1 0.44 0.01 0.01 0.53 0.01 2 0.19 0.23 0.31 0.22 0.05 3 0.23 0.36 0.18 0.11 0.12 4 0.15 0.42 0.26 0.12 0.05 5 0.15 0.52 0.19 0.13 0.01 6 0.31 0.41 0.26 0.01 0.01 7 0.25 0.25 0.25 0.25 0.25
Table 2. Weights: According to the Travel Purpose
3.2.2. According to the Cost Mode
and high-speed railway. Moreover, they have higher requirements about the frequency of the mode of transportation, departure time and arrival time. And they are less sensitive to the travel cost. So the weight for the time dimension is 0.42 and for the environment dimension is 0.58, that is, the "travel value" is 2.69 + 4.47 * 0.42 * 0.58 = 3.7224. However, passenger traffic at their own expense will have lower requirements for the quality of transport and higher sensitivity for the travel costs because they must pay for themselves. So the "travel value" is 0.8 + 0.2 * 3.16 * 4.47 = 3.422.
PN 1 2
TV (wj) 3.7224 3.422
Table 3. Travel Value: According to the Cost Mode
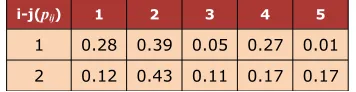
i-j(pij) 1 2 3 4 5
1 0.28 0.39 0.05 0.27 0.01 2 0.12 0.43 0.11 0.17 0.17
Table 4. Weights: According to the Cost Mode
3.2.3. According to the Income
The previous data showed that middle-income and less income stream of passengers have a preference for the traditional existing rail or road. And for the travel costs are the main considerations, they have a relatively low requirement for the transport quality such as comfort, convenience and punctuality. In addition, they have a relatively high degree of sensitivity for the fare level, so the fluctuations in fares will cause great changes in the passenger traffic distribution. So the "travel value" for the lower-income is 0.9 * 3.16 + 0.09 2.69 + 0.01 * 4.47 = 3.1308. And the "travel value" for the low-income passenger is 0.9 * 3.16 + 0.082 * 2.69 + 0.02 * 4.47 = 3.1486.
The "travel value" for the middle-income passenger is 0.5 * 3.16 +0.25 * 2.69 +0.25 * 4.47 = 3.37.
PN 1 2 3 4 5
TV (wj) 3.1308 3.1486 3.37 3.5007 3.6327
Table 5. Travel Value: According to Income
i-j(pij) 1 2 3 4 5
1 0.01 0.37 0.11 0.01 0.01 2 0.01 0.57 0.31 0.02 0.01 3 0.01 0.03 0.41 0.05 0.01 4 0.68 0.02 0.07 0.42 0.43 5 0.28 0.01 0.09 0.50 0.54
Table 6. Weights: According to Income
3.3. Forecast Analysis
Firstly, because the background is under the spring festival, some predictions may not match exactly with the normal. During the spring festival, different passenger may have different considerations with the usual, such as the price, the time and the environmental dimension. Many people may take "as long as arrive the destination" into main consideration in the pessimistic circumstance, but not for the other factors.
3.3.1. According to the Purpose
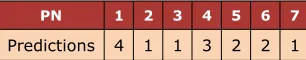
PN 1 2 3 4 5 6 7
Predictions 4 1 1 3 2 2 1
Table 7. Predictions: According to the Travel Purpose
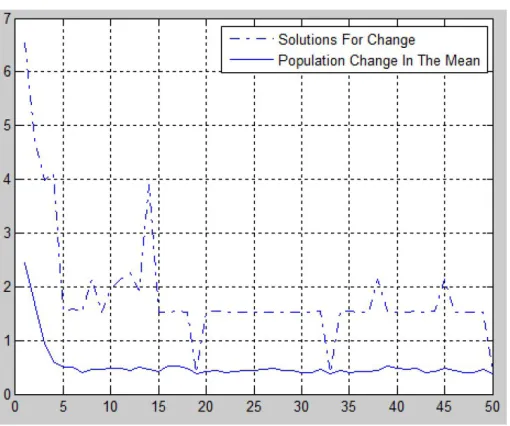
According to Table 7, business travelers will choose plane for the next trip, passengers to tourism and work will choose EMUs for the next trip, passengers to school will choose long-distance bus and passengers to home and transfer will choose direct trains for the next trips. However, the others will choose EMUs.
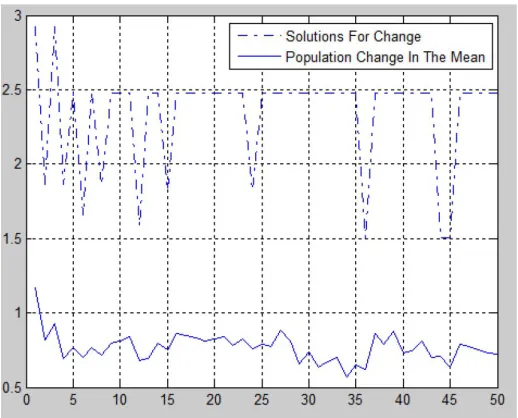
Figure 1. Predictions: According to the Travel Purpose
Figure 1 is the application made by Matlab. It is a change tracking map of the total effective value and the mean of the population.
3.3.2. According to the Cost Mode
PN 1 2
Predictions 4 2
Table 8. Predictions: According to the Cost Mode
According to table 8, passengers who travel at public expense will choose plane next trips and the others who travel at their own expense will take direct trains next trips.
Figure 2. Predictions: According to the Cost Mode
Figure 2 is the application made by Matlab. It is a change tracking map of the total effective value and the mean of the population.
3.3.3. According to the Income
PN 1 2 3 4 5
Predictions 2 2 3 1 4
Table 9. Predictions: According to the Income
According to Table 9, low and lower income passengers will take direct trains as their next trips, middle income passengers will choose long-distance bus, high-income passengers will choose EMU and higher-income passengers will choose planes.
In real life, most low-income passengers will choose direct trains as their travel mode for the price is lower, and this is very beneficial to those low-income passengers. However, middle-income passengers will be on a more balanced consideration of all aspects, so the predictions are more realistic. High and higher income passengers are less sensitivities to the price, what they care about are time, comfort, so the predictions is also close to reality.
Figure 3. Predictions: According to the Income
4. Study on Railway Passenger Travel Choice Prediction based on BP Neural Network
BP neural network for predicting the quality or soundness of the injected plastic parts based on key process variables and material grade variations has been developed. The approach uses a backpropagation 4-2-3 net (BPN) trained based on inputs/outputs data which were taken from simulation works carried out through a CAE software. The system reduces the time required for planning and optimizing of process conditions or operating parameters. When using the BP neural network model to forecast the passengers’ behaviours, two main steps are built including data processing and the neural network establishment. The concrete algorithm is as follows:
Figure 4. Algorithm process of the BP neural network forecast model
Step1: 400 sets of data for training are randomly selected from 503 sets of original data that are effective. The other 103 sets of effective data are used for forecasting. Input represents the input data and output represents the output data.
K = rand(1,503);
input_train = input(n(1:400),:)';
output_train = output(n(1:400),:)';
input_test = input(n(401:503),:)';
output_test = output(n(401:503),:)';
Step2: Normalization of data for training. To normalize the training data can largely improve the Network’s training speed and accuracy. Function mapminmax in Matlab is chosen to normalize the training data.
[inputn,inputps] = mapminmax(input_train);
[outputn,outputps] = mapminmax(output_train);
Step3:Build up the Neural network.
Net = newff(inputn,outputn,5);
Step4: Establishment of neural network parameters. With data normalized, less iteration times are needed when the number of experiment data is not enormous. The learning rate usually is set between 0.01~0.1 according to various models. So do the choice for the goal of accuracy.
The learning rate is chose at 0.05 in this study and iteration times is set at 1000 based on experience. The goal of the training is initially set at 1 e-10.
net.trainParam.lr = 0.05;
net.trainParam.epochs = 1000;
net.trainParam.goal = 1e-10;
Step5: Training for BP neural network. The neural network training's performance depends on choices of transfer function, training function and many other parameters. Here the most commonly used functions in the matlab neural toolbox are taken as the tool for training the BP Neural network.
Net = train(net, inputn, outputn);
Step6: Normalization of the predicted data and the counter-normalization of the BP neural network’s forecast outputs. Because the training data has been normalizd before, the same process should be taken to the data or forecasting. Use the trained neural network to forecast output data and counter-normalize the output data.
an = sim(net, inputn_test);
Bpoutput = mapminmax('reverse', an, outputps);
Step7: Analyze the forecast result and error.
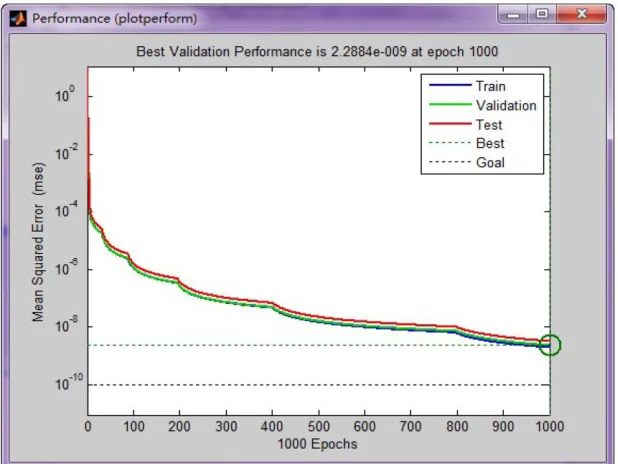
In order to evaluate the forecast result, the survey data was used to conduct a simulation research based on Matlab 6.6. A BP Neural network consisting of four input nodes, one output node and five nodes in the hidden layer was built and trained to forecast the environmental factors’ impacts on High-speed railway passengers’ travel choices, and the result is shown in figure5. Figure 6 represents the forecast error in the training and forecasting process with the neural network. Figure 7 shows the training performance of the network.
Figure 6. The forecast error of the BP neural network model
Figure 7. The training performance of the BP neural network
5. Conclusion
We could prove through the empirical study that the soft computing methods applied above are both effective for predicting the railway passenger travel choice. However, the basic idea, the range applicable and the key parameters set in the model are different.
The basic idea of the genetic algorithm to predict the travel selection methods is that the choice of traveling factors will act on the passengers, whether subjective or subconscious, when passengers choose their travel modes, they will maximize their benefits. Thus, making the fitness function value for the effectiveness of passenger travel, that is, the bigger the value of the fitness function, the greater the benefit of the passenger, and the more satisfied the passengers. So, under the guidance of this thought, we made predictions of various different types of passengers choosing travel modes. Passengers’ choice of travel mode can show whether of such services industry is doing well, and the predictions at least can provide some good advice for those services sectors who have fewer passengers, such as what to improve and how to improve from price, time and environmental comfort, etc.
The specific characteristics of neural network that it has a good simulation of nonlinear operation and can deal with self-organizing and self-learning problems make it unnecessary for us to analyze in detail what distinctive futures like safety and comfort degrees and how big the influence on choosing traveling means each factor has, but simply to choose formats of study samples data and some parameters of learning process for neural network, we can make the neural network learn by itself, thus avoiding the condition that the man-made model that was built according to the traditional methods does not match with the actual situation, which leads to inaccuracy.
But, in terms of the environmental factors affecting traveling, it is certain that the factors we choose might be incomplete, and we can’t eliminate the influences of other factors such as price and time besides the environmental factors on the choices of travel modes. What is more, a better solution of choosing parameters for the established BP neural network may exist. How to establish a more effective neural network model remains a valuable subject. The research is based on the popular topics on environmental factors in recent years, establishing a BP neural network model with a small error and high precision, which could be a beneficial and promising explore in this area. To reiterate, a further experiment and research is expected.
References
Avineri, E. (2004). A Cumulative Prospect Theory Approach to Passengers Behavior Modeling: Waiting Time Paradox Revisted. Journal of Intelligent Transportation Systems, 8(4).
http://dx.doi.org/10.1080/15472450490523856
Denai, M.A., Palis, F., & Zeghbib, A. (2007). Modeling and control of non-linear systems using
soft computing techniques. Applied Soft Computing, 7(3).
http://dx.doi.org/10.1016/j.asoc.2005.12.005
Jin, X., & Jia, W. (2008). Review of Researches on Artificial Neural Network. 65-66.
Ma, Y. (2007). Opinions on the Development of Artificial Neural Network. Journal of Jilin Radio and Television University, 5.
Qiang, Z., Bin, W., Rui, Z., & Xia, X.C. (2008). Genetic Algorithm-Based Design for DNA Sequences Sets. Chinese Journal of Computers [J], 2193-2199.
Qiu, S., & Wang, Q. (2009). Freeway traffic incident detection based on BP neural network.
China Measurement & Test, 48-52.
Journal of Industrial Engineering and Management, 2014 (www.jiem.org)
Article's contents are provided on a Attribution-Non Commercial 3.0 Creative commons license. Readers are allowed to copy, distribute and communicate article's contents, provided the author's and Journal of Industrial Engineering and Management's names are included.