RESEARCH ARTICLE
Study of binding interaction
of rivaroxaban with bovine serum albumin
using multi-spectroscopic and molecular
docking approach
Tanveer A. Wani
1*, Haitham AlRabiah
1, Ahmed H. Bakheit
1, Mohd Abul Kalam
2and Seema Zargar
3Abstract
Background: Rivaroxaban is a direct inhibitor of coagulation factor Xa and is used for venous thromboembolic dis-orders. The rivaroxaban interaction with BSA was studied to understand its PK and PD (pharmacokinetics and phar-macokinetics) properties. Multi-spectroscopic studies were used to study the interaction which included UV spectro-photometric, spectrofluorometric and three dimensional spectrofluorometric studies. Further elucidation of data was done by molecular simulation studies to evaluate the interaction behavior between BSA and rivaroxaban.
Results: Rivaroxaban quenched the basic fluorescence of BSA molecule by the process of static quenching since rivaroxaban and BSA form a complex that results in shift of the absorption spectra of BSA molecule. A decline in the values of binding constants was detected with the increase of temperatures (298–308 K) and the binding constants were in range from 1.32 × 10⁵ to 4.3 × 10³ L mol−1 indicating the instability of the BSA and rivaroxaban complex at higher temperatures. The data of number of binding sites showed uniformity. The site marker experiments indicated site I (sub-domain IIA) as the principal site for rivaroxaban binding. The thermodynamic study experiments were carried at the temperatures of 298/303/308 K. The ∆G0, ∆H0 and ∆S0 at these temperatures ranged between − 24.67 and − 21.27 kJ mol−1 and the values for ∆H0 and ∆S0 were found to be − 126 kJ mol−1 and ∆S − 340 J mol−1 K−1 The negative value of ∆G0 indicating spontaneous binding between the two molecules. The negative values in ∆H0 and ∆S0 indicated van der Waals interaction and hydrogen bonding were involved during the interaction between rivaroxaban and BSA.
Conclusions: The results of molecular docking were consistent with the results obtained from spectroscopic studies in establishing the principal binding site and type of bonds between rivaroxaban and BSA.
Keywords: Bovine serum albumin, Rivaroxaban, Human serum albumin, Fluorescence, Quenching
© The Author(s) 2017. This article is distributed under the terms of the Creative Commons Attribution 4.0 International License (http://creativecommons.org/licenses/by/4.0/), which permits unrestricted use, distribution, and reproduction in any medium, provided you give appropriate credit to the original author(s) and the source, provide a link to the Creative Commons license, and indicate if changes were made. The Creative Commons Public Domain Dedication waiver (http://creativecommons.org/ publicdomain/zero/1.0/) applies to the data made available in this article, unless otherwise stated.
Background
The serum albumin is most abundant protein in plasma and has high affinity to bind drug ligands and metabo-lites, thus, acting as a carrier for them. This capability of serum albumin makes it vital to play a function in cer-tain physiological processes such as distribution and transport of various ligands [1, 2]. The ligands bind to
albumin either weakly or strongly and the type of binding will have impact on the distribution of these ligands as weakly bound ligands will have poor distribution and fast elimination and the strongly bound ligands will decrease the free ligand amount in plasma. To understand the PK/ PD of drug molecules there is a need to investigate the behavior of binding between the drug molecules and albumin [3–11]. Bovine serum albumin (BSA) is struc-turally analogous to the human serum albumin (HSA) [12], and both of them have been widely studied for their interaction with drug ligands. The studies include
Open Access
*Correspondence: [email protected]
1 Department of Pharmaceutical Chemistry, College of Pharmacy, King
multi-spectroscopic and molecular simulation approach with theoretical calculations [13–15].
Rivaroxaban (chemical name 5-chloro-N -[[(5S)-2-oxo-3-[4-(3-oxomorpholin-4-yl)phenyl]-1,3-oxazolidin-5-yl] methyl]thiophene-2-carboxamide) inhibits coagulation factor Xa directly and is used for venous thromboembolic disorders. It is prescribed for arthroplasty of hip or knee in adult patients. Conversion of prothrombin to throm-bin is catalyzed by factor Xa, thus having a very critical role in the thrombin production. The inhibition of factor Xa by Rivaroxaban is concentration dependent and rivar-oxaban also inhibits its amidolytic activity [16–18]. The affinity of Rivaroxaban is > 10,000 times more towards human factor Xa than factor Xa of any other species. Further it has been demonstrated that during post rivar-oxaban treatment in in vitro studies there is prolongation of initial phase of thrombin production and reduction thrombin production during propagation phase [19].
The interaction between BSA and rivaroxaban has not been studied till date even though several pharmacokinetic and pharmacodynamics studies have been performed on this drug. The study of these interactions (biophysical) help in understanding the behavior of drug molecules in vivo [20–25]. A huge amount of data can be obtained regarding the structural details of drugs and therapeutic capabilities with the help of these interaction studies. The level of bind-ing of drug ligand to the protein is important for studybind-ing its distribution and/or elimination from body.
In this research paper multi-spectroscopic approaches were used to study biophysical interaction of albumin and rivaroxaban. These approaches included spectrofluoro-metric quenching experiments along with molecular dock-ing studies. This study will provide further understanddock-ing regarding the PK/PD behavior of the rivaroxaban.
Results and discussion UV absorption spectra of BSA
To explore the changes in the structure and conforma-tion of rivaroxaban and BSA complex UV absorpconforma-tion
spectroscopy was utilized [26]. The UV spectra for BSA alone and its complex with rivaroxaban are presented in Fig. 1. In Fig. 1a, b two absorption bands exist for BSA in presence of rivaroxaban. The strong band occurs at near 210 (Fig. 1a) and weak band at near 280 nm (Fig. 1b). The conformational framework of BSA is characterized by the absorption band near 210 nm whereas, π → π transition due aromatic amino acids represent the band at 280 nm. With increasing concentration of rivaroxaban the absorp-tion intensities also increased. The development of com-plex between BSA and rivaroxaban is indicated because of red shift at 210 nm and blue shift at 280 nm.
Fluorescence quenching of BSA
Fluorescence quenching studies to explore the binding interaction of drug ligands with proteins is considered as the best methodology [27]. Figure 2 represents the fluorescence spectra of BSA alone as well as in combi-nation with different concentrations of rivaroxaban. The FI showed a decrease with increasing concentrations of rivaroxaban with slight alteration in the λemission. This indicated that there was some alteration in the micro-environment of the fluorophore Trp-213 upon interac-tion of BSA and rivaroxaban [28].
Fig. 1 UV spectra of BSA in the presence of rivaroxaban. a Represents the spectra at 210 nm and b at 280 nm
Analysis of fluorescence quenching and mechanism
The quenching processes can be dynamic quenching and static quenching. In static quenching, the complex formed between the ligand and the albumin is non-flu-orescent. While as in dynamic quenching there occurs a molecular collision amongst the drug ligands and albu-min during the lifetime excited state.
At higher temperatures the dynamic quenching con-stant is increased because of higher diffusion coefficient values. This increased diffusion coefficient augments the electron transfer processes in case of dynamic quench-ing. In static quenching the quenching constant behaves in opposite to that of dynamic quenching at elevated temperatures because of the instability of ground state complex. The mechanism of fluorescence quenching can be evaluated by Stern–Volmer equation:
The FI of BSA in presence and absence of the quencher are designated by F and F0; Ksv is Stern–Volmer
con-stant; [Q] is quencher concentration; Kq is
bimo-lecular quenching rate constant; τ0 is fluorophore’s
lifetime without quencher, and is assigned to be 10−8 for
a biopolymer.
The value for Kq also helps in determination of
mecha-nism of quenching involved. The maximum scattering collision quenching rate constant attained by quencher-BSA complex is 2 × 10¹⁰ M−1 S−1. Table 1 along with
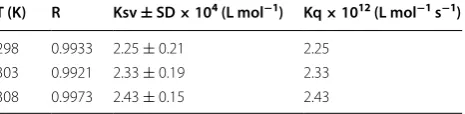
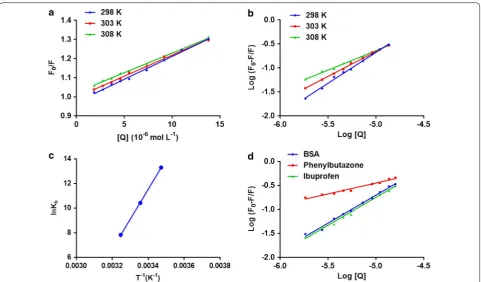
Fig. 3a shows that the Ksv value increases with increased
temperatures indicating a dynamic quenching process. Also, the values obtained for Kq are more than the
val-ues of 2 × 10¹⁰ M−1 S−1 indicating formation of
non-fluorescent complex between rivaroxaban and BSA. The dissimilarity among the different types of quenching behaviors could be explained with changes in the UV– visible spectrum of BSA. The absorption spectra for the quencher is unaffected in case of dynamic quenching as it influences only the excitation state of the quencher. In static quenching the complex is formed among the BSA and ligand, resulting in the change of the absorbance spectra of BSA molecule. As discussed earlier a complex is formed amongst the BSA molecule and rivaroxaban (Fig. 1) inferring that fluorescence quenching is primar-ily due to this complex formation (static quenching) [29].
Binding constant and binding modes
In static quenching it is assumed that several binding sites (n) are available on the BSA for binding the drug. The binding constant (Kb) and n are calculated by using
double log regression curve Fig. 3b [30]. The intercept and slope of the plotted curve is used to calculate Kb and
n Table 2
F F0
=1+Ksv[Q]=1+Kqτ0[Q]
The high Kb suggests a very strong binding interaction
between rivaroxaban and BSA inferring low free plasma concentration of rivaroxaban in vivo. The value of n of BSA at all three studied temperatures is approximately equivalent to 1 as fractional binding sites don’t occur and no < 1 binding site can be present suggesting only one binding site for rivaroxaban. Also, a lowering in binding site number was observed at higher temperature and can be attributed to the fact that at higher temperatures the molecules are disordered and undergo fast vibrations and can have higher diffusion coefficients which may lead to instability of rivaroxaban–BSA complex.
Further, the value of the correlation coefficient (r2) at
temperatures of 298, 303 and 308 K were (> 0.99) sug-gesting that rivaroxaban and BSA interaction precisely followed double logarithm regression based site-bind-ing model. Site specific probes (phenylbutazone and ibuprofen) were used to establish the binding sites of rivaroxaban on BSA. The concentration of BSA and site specific probe were kept constant, and equimolar centration for both of them were used whereas the con-centration of rivaroxaban was varied. The fluorescence spectra were obtained at 25 °C (room temperature) at (λexcitation = 280 nm). The binding constant (Kb) attained under these conditions were 0.63 × 10² for the
rivaroxaban and BSA (with phenylbutazone as probe) and 1.13 × 10⁵ (with ibuprofen). The binding constant
for rivaroxaban and BSA complex was 1.32 × 10⁵. The
results showed a reduction in the binding constants with the presence of probes. The lowest binding constant was obtained with phenylbutazone as site probe suggest-ing site I (sub-domain IIA) as the principal bindsuggest-ing site for rivaroxaban (Fig. 3d). However, some binding also occurred at site II (sub-domain IIIA) with a decrease in the binding constant when ibuprofen was used as a probe specific for site II [31].
Thermodynamic parameters and binding forces
The protein binding of drugs is due to some kind of binding forces which include hydrogen bonding interac-tion, van der Waals forces, electrostatic interaction and
log(F0−F)
F =logKb+nlog [Q]
Table 1 Stern–Volmer quenching constants (KSV) and bimo-lecular quenching rate constant (Kq) for the binding of rivar-oxaban to BSA at three variable temperatures
T (K) R Ksv ± SD × 104 (L mol−1) Kq × 1012 (L mol−1 s−1)
hydrophobic interaction. The type of forces involved in these binding interactions are determined by the signs and amounts of thermodynamic parameters that are cal-culated by following equation (van’t Hoff equation):
where, ∆G0 is change of Gibbs free energy; ∆H0 is change
of enthalpy and ∆S0 is change of entropy; R is gas
con-stant and Kb the binding constant at different
tempera-tures used in this study. The involvement of van der Waals forces and/or hydrogen bonding is suggested by negative (−) values in ∆H0 and ∆S0 whereas positive
val-ues in ∆H0 and ∆S0 suggest a hydrophobic interaction.
lnKb= −H
0
RT + S0
R
G0=H0−TS0= −RTlnKb
∆H0 value approximating zero and (+) ∆S0 suggests
elec-trostatic interaction forces [31, 32]. The BSA rivaroxaban van’t Hoff plot is represented in Fig. 3c and the enthalpy and entropy as well as gibbs free energy values are pre-sented in Table 2. The negative value of ∆G0 suggests that
the rivaroxaban and BSA binding was spontaneous. The negative values for ∆H0 and ∆S0 showed that the
interac-tion of BSA with Rivaroxaban is mainly enthalpy driven. The negative value of entropy suggests unfavorable bind-ing process like van der Waals interactions and hydrogen bonding in interaction of rivaroxaban to BSA.
Synchronous fluorescence spectroscopy of BSA and rivaroxaban complex
The secondary structure formed post BSA–rivaroxaban interaction was studied with help of SF spectroscopy Fig. 3 a The Stern–Volmer curves for the quenching of BSA by rivaroxaban at 298/303/308 K. b The plot of log[(F0− F)/F] versus log[Q] for
quenching process of rivaroxaban with BSA at 298/303/3008 K. c Van’t Hoff plots for the binding interaction of rivaroxaban with BSA. d The plot of log[(F0− F)/F] versus log[Q] for quenching process of rivaroxaban with BSA in presence of site markers phenylbutazone and ibuprofen at 298 K
Table 2 Binding and thermodynamic parameters of binding between rivaroxaban and BSA
T (K) R Log Kb± SD Kb (L mol−1) n ∆G (kJ mol−1) ∆H (kJ mol−1) ∆S
(J mol−1 K−1)
298 0.9914 5.12 ± 0.09 1.32 × 10⁵ 1.1 − 24.67 − 126 − 340 303 0.9818 4.25 ± 0.14 1.82 × 10⁴ 0.98 − 22.97
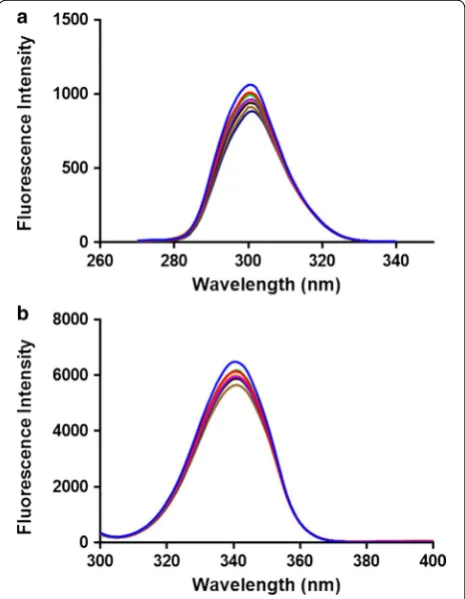
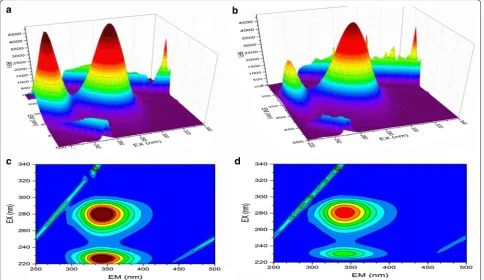
[33]. SF spectroscopy provides us with the evidence about microenvironment surrounding the chromo-phores. The scanning intervals of ∆λ = 15 nm provide specific information about the tyrosine residue and ∆λ = 60 nm provide information about tryptophan resi-dues. In case a shift occurs in the maximum λemission of the BSA, it indicates an alteration in the micro-envi-ronmental polarity of tyrosine or tryptophan or both of them. Different spectra were obtained for BSA alone and with rivaroxaban and the results showed a decreased FI upon addition of rivaroxaban Fig. 4. There was a shift of 1 nm at both ∆λ = 15 nm and ∆λ = 60 nm suggests a modification in the micro-environmental vicinity of tyrosine and tryptophan upon binding to rivaroxa-ban. 3D (3-dimensional) spectra for BSA were also obtained in presence/absence of rivaroxaban [34]. Two peaks were observed in the BSA namely 1 and 2. Peak 2 (λex/λem: 275.0/340.0 nm) is because of existence of tryptophan and tyrosine residues. Figure 5a represents the FI in absence of rivaroxaban and Fig. 5b indicates a decrease in the FI of BSA post addition of rivaroxaban because of quenching of its fluorescence by rivaroxaban. The result (Table 2) indicates lesser polar microenviron-ment of both tryptophan and tyrosine residues and the hydrophobic amino acids might be buried deep within
hydrophobic pockets. Further the less polar environ-ment suggests that rivaroxaban binds to the hydrophobic pocket in BSA and upon addition changes the conforma-tional polarity of the hydrophobic microenvironment of BSA.
The fluorescence spectral features of the polypeptides present in BSA are represented by peak 1 (λex/λem: 225.0/340.0 nm) and are due to π–π* transition of the polypeptide structures (C=O) [35, 36]. There was a steep decline in the intensity of peak after addition of rivaroxa-ban and the FI decreased as indicated in the Table 3. As evident in the contour plot (Fig. 5) the lower portion of the spectra was sparse post addition of rivaroxaban com-pared to BSA alone indicating that there was conforma-tion change BSA post rivaroxaban addiconforma-tion.
Molecular simulation studies
To further understand the BSA rivaroxaban interac-tion the molecular docking studies were performed. The molecular docking studies complimented with the UV spectroscopic and fluorescence results. In the dock-ing analysis the rivaroxaban was docked with BSA to establish the favored binding site and the binding mode. BSA protein has two ligand binding sites (Site I/Site II) and represent the hydrophobic binding grooves of sub-domains IIA IIIA respectively. The best conformation of rivaroxaban and BSA is presented in Fig. 6a. As pre-sented in Fig. 6 the rivaroxaban binds to both site I/II of sub-domain IIA/IIIA pocket in domain II and III of BSA. These docking and spectroscopic results are in agree-ment with each other since the microenvironagree-ment of both amino acid residues (tyrosine and tryptophan) were altered upon addition of rivaroxaban to BSA. Figure 6b demonstrates the hydrogen bonding between rivaroxa-ban and BSA. At site I rivaroxarivaroxa-ban formed hydrogen bonds with ARG-194 and TRP-213 residues and was encircled by ARG- 208, VAL-342, LEU-454, PHE-205, ARG-198, ARG-194, ARG- 217, LYS-350, ALA-209, LEU-197, LEU-346, LEU-480 and VAL-481. On site II rivaroxaban formed hydrogen bonds with LYS-413, TYR-410 and CYS-437 and was encircled by GLN 393, LEU-452, LEU-386, LEU-406, LEU-429, GLY-433, SER-488, THR448, VAL-432, GLN-389 and ARG-409 with the binding energies for the BSA–rivaroxaban complex as
− 32.38 kJ mol−1 at site I and 25.89 kJ mol−1 at site II. The
experimental binding constant value at 300 K was found to be − 24.67 kJ mol−1 and is similar to the binding
con-stant value obtained theoretically.
Conclusion
Rivaroxaban binds mainly to site I (sub-domain IIA) of the BSA and a complex is formed between the two mol-ecules with the inherent fluorescence of BSA quenched Fig. 4 Synchronous fluorescence spectroscopy of BSA at 298 K a
by rivaroxaban. Further, rivaroxaban also binds to the Site II (sub-domain IIIA) as indicated during the molec-ular docking analysis. A single binding site was observed in the BSA–rivaroxaban complex and the binding con-stants indicated that their binding is quite strong to be highly bound in plasma. These results corroborated with site specific probes which indicated site I (sub domain IIA) as the principal binding site for rivaroxaban. The thermodynamic studies showed that interaction between BSA and rivaroxaban is mainly enthalpy driven with involvement of van der Waals interactions and the hydrogen bonding.
Experimantal Chemical and reagents
The BSA was purchased from Sisco Research Labora-tories India, rivaroxaban, phenylbutazone and ibupro-fen was procured by from National Scientific Company; Saudi Arabia. The chemicals used for the study were of analytical grade.
Solutions of BSA, rivaroxaban, phenylbutazone and ibuprofen were prepared according to their molecular weights. The working standards of BSA (1.5 µM) was pre-pared in phosphate buffer (pH 7.40). The stock of rivar-oxaban (2.3 × 10⁻³ M) was prepared with the addition of
suitable amount of standard rivaroxaban in 500 µL dime-thyl sulphoxide with final volume made up by phosphate buffer. The working standards were in the range between 1.6 × 10⁻⁶ and 8 × 10⁻⁶ prepared from the stock.
Simi-larly, the stocks of phenylbutazone and ibuprofen were prepared by dissolving them in methanol with further dilutions in phosphate buffer. Water-IV (Elga Purelab FLEX type-IV; Elga Lab Water UK) was used in prepara-tion of the stocks and all working standards.
UV spectra measurements
The UV spectrophotometer, UV-1800 from Shimadzu, Japan was used for all the spectrophotometric measure-ments. The measurements were done for the BSA alone Fig. 5 Three-dimensional fluorescence (3D) spectra and contour spectra of BSA (a, c) and BSA–rivaroxaban (b, d) complex BSA
Table 3 Three dimensional fluorescence spectra param-eters for BSA and BSA–rivaroxaban complex
System Parameters Peak 1 Peak 2
BSA Peak position (λex/λem,
nm) 226.0/342.0 282.0/342.0 Fluorescence intensity 5527 5573 Stokes shift Äë (nm) 116 60 BSA–rivaroxaban Peak position (λex/λem,
as well as in presence of varying rivaroxaban concentra-tions. All the spectra were obtained at room temperature.
Fluorescence measurements
The fluorescence spectra were obtained from JASCO FP-8200 (Easton, USA) spectrofluorometer at three dif-ferent temperatures (298, 303 and 308 K) at wavelength of 280 and 340 nm for excitation and emission respec-tively. The standard solutions of similar concentration of BSA fixed (1.5 × 10⁻⁶ M) and varying
concentra-tion of rivaroxaban (1.6 × 10⁻⁶ to 8 × 10⁻⁶ M) were
mixed in the 1:1 v/v ratio in different 10 mL volumetric flasks. The final concentration for the analysis were BSA 0.75 × 10⁻⁶ M and rivaroxaban ranged from 0.8 × 10⁻⁶
to 4 × 10⁻⁶ M. The measurements were repeated three
times and the final mean of the three readings were taken. The existence of inner filter effect results in decreased fluorescence intensity. In case, a compound present in the fluorescence detection system shows absorption in the UV region at its excitation or emission wavelength can result in inner filter effect. The fluorescence intensi-ties were corrected for studying the interaction between rivaroxaban and BSA using the following equation [20]:
Fcor (corrected fluorescence), and Fobs (observed fluo-rescence), Aex (rivaroxaban absorption at excitation
wavelength) and Aem (rivaroxaban absorption at emission wavelength).
Fcor =Fobs×e(Aex+Aem)/2
Synchronous fluorescence (SF) measurement
The rivaroxaban and BSA solutions synchronous fluo-rescence spectra were attained using the JASCO spec-trofluorometer at 25 °C (room temperature) with altered scanning intervals of ∆λ (∆λ = λem − λex). The properties
of tyrosine and tryptophan residues residue were charac-terized at ∆λ = 15 nm and at ∆λ = 60 nm respectively.
Molecular docking
The molecular docking analysis were performed to evalu-ate the interaction behavior of rivaroxaban with BSA. The docking was performed on Molecular Operating Envi-ronment (MOE-2014). Chemical structure of rivaroxa-ban was drawn in the MOE software whereas the crystal structure of BSA (PDB ID 4OR0) was imported from Protein Data Bank (http://www.rcsb.org). The resulting structures were minimized using MMFF94x force-field reaction with following electrostatics Din = 1, Dout = 80. To all the atoms a tether (flat bottom) of 10.0 kcal mol−1
and 0.25 Å was applied. RMSD parameters (root mean square deviation) was utilized for the selection of the most appropriate interaction of BSA with rivaroxaban.
Abbreviations
FI: fluorescence intensity; PK/PD: pharmacokinetics and pharmacodynamics; BSA: bovine serum albumin; HSA: human serum albumin.
Authors’ contributions
TW and SZ designed the study. AB, TW, HR participated in conduct of experi-ments. AB carried out the molecular modeling analysis. TW and SZ analyzed
the results and wrote the manuscript. All authors read and approved the final manuscript.
Author details
1 Department of Pharmaceutical Chemistry, College of Pharmacy, King
Saud University, P.O. Box 2457, Riyadh 11451, Saudi Arabia. 2 Nanomedicine
Research Unit, Department of Pharmaceutics, College of Pharmacy, King Saud University, P.O. Box 2457, Riyadh 11451, Saudi Arabia. 3 Department
of Biochemistry, College of Science, King Saud University, PO Box 22452, Riyadh 11451, Saudi Arabia.
Acknowledgements
The authors would like to extend their sincere appreciation to the Deanship of Scientific Research, King Saud University, for funding the research group No. RG-1438-042.
Competing interests
The authors declare that they have no competing interests.
Ethics approval and consent to participate Not applicable.
Publisher’s Note
Springer Nature remains neutral with regard to jurisdictional claims in pub-lished maps and institutional affiliations.
Received: 31 May 2017 Accepted: 14 December 2017
References
1. Sugio S, Kashima A, Mochizuki S, Noda M, Kobayashi K (1999) Crystal structure of human serum albumin at 2.5 Å resolution. Protein Eng 12:439–446
2. Flarakos J, Morand KL, Vouros P (2005) High-throughput solution-based medicinal library screening against human serum albumin. Anal Chem 77:1345–1353
3. Bakkialakshmi S, Chandrakala D (2012) A spectroscopic investigations of anticancer drugs binding to bovine serum albumin. Spectrochim Acta A Mol Biomol Spectrosc 88:2–9
4. Dhar S, Rana DK, Pal A, Bhattacharya SC (2013) Photobehavior and docking simulations of drug within macromolecules: binding of an antioxidative isoquinolindione to a serine protease and albumin proteins. J Photochem Photobiol B 129:69–77
5. Sun H, Wu Y, Xia X, Liu X, Shi Z (2013) Interaction between diethylstil-bestrol and bovine serum albumin. Monatshefte für Chemie-Chemical 144:739–746
6. Wani TA, Bakheit AH, Zargar S, Hamidaddin MA, Darwish IA (2017) Spec-trophotometric and molecular modelling studies on in vitro interaction of tyrosine kinase inhibitor linifanib with bovine serum albumin. PLoS ONE 12(4):e0176015
7. Meti MD, Gunagi SD, Nandibewoor ST, Chimatadar SA (2013) Investiga-tion of the interacInvestiga-tion of the new antiarrhythmic drug procainamide hydrochloride with bovine serum albumin and the effect of some metal ions on the binding: a fluorescence quenching study. Monatshefte für Chemie-Chemical 144(8):1253–1259
8. Shahabadi N, Fili SM (2014) Molecular modeling and multispectroscopic studies of the interaction of mesalamine with bovine serum albumin. Spectrochim Acta A Mol Biomol Spectrosc 118:422–429
9. Shi J-H, Zhu Y-Y, Wang J, Chen J, Shen Y-J (2013) Intermolecular interac-tion of prednisolone with bovine serum albumin: spectroscopic and molecular docking methods. Spectrochim Acta A Mol Biomol Spectrosc 103:287–294
10. Chamani J, Moosavi-Movahedi A (2006) Effect of n-alkyl trimethylam-monium bromides on folding and stability of alkaline and acid-dena-tured cytochrome c: a spectroscopic approach. J Colloid Interface Sci 297:561–569
11. Moosavi-Movahedi A, Gharanfoli M, Nazari K, Shamsipur M, Chamani J, Hemmateenejad B et al (2005) A distinct intermediate of RNase A is induced by sodium dodecyl sulfate at its pK a. Colloids Surf B Biointer-faces 43:150–157
12. He XM, Carter DC (1992) Atomic structure and chemistry of human serum albumin. Nature 358:209–215
13. Rashidipour S, Naeeminejad S, Chamani J (2016) Study of the interaction between DNP and DIDS with human hemoglobin as binary and ternary systems: spectroscopic and molecular modeling investigation. J Biomol Struct Dyn 34:57–77
14. Sharif-Barfeh Z, Beigoli S, Marouzi S, Rad AS, Asoodeh A, Chamani J (2017) Multi-spectroscopic and HPLC studies of the interaction between estradiol and cyclophosphamide with human serum albumin: binary and ternary systems. J Solut Chem 46:488–504
15. Kabiri M, Amiri-Tehranizadeh Z, Baratian A, Saberi MR, Chamani J (2012) Use of spectroscopic, zeta potential and molecular dynamic techniques to study the interaction between human holo-transferrin and two antagonist drugs: comparison of binary and ternary systems. Molecules 17:3114–3147
16. Weinz C, Schwarz T, Kubitza D, Mueck W, Lang D (2009) Metabolism and excretion of rivaroxaban, an oral, direct factor Xa inhibitor, in rats, dogs, and humans. Drug Metab Dispos 1(37):1056–1064
17. Depasse F, Busson J, Mnich J, Le Flem L, Gerotziafas GT, Samama MM (2005) Effect of BAY 59-7939—a novel, oral, direct factor Xa inhibitor—on clot-bound factor Xa activity in vitro. J Thromb Haemost 3(Suppl 1):P1104 18. Perzborn E, Strassburger J, Wilmen A, Pohlmann J, Roehrig S, Schlemmer
KH, Straub A (2005) In vitro and in vivo studies of the novel antithrom-botic agent BAY 59-7939-an oral, direct factor Xa inhibitor. J Thromb Haemost 3:514–521
19. Perzborn E, Roehrig S, Straub A, Kubitza D, Mueck W, Laux V (2010) Rivaroxaban: a new oral factor Xa inhibitor. Arterioscler Thromb Vasc Biol 30(3):376–381
20. Khorsand Ahmadi S, Mahmoodian Moghadam M, Mokaberi P, Reza Saberi M, Chamani J (2015) A comparison study of the interaction between β-lactoglobulin and retinol at two different conditions: spectroscopic and molecular modeling approaches. J Biomol Struct Dyn 33(9):1880–1898 21. Marouzi S, Rad AS, Beigoli S, Baghaee PT, Darban RA, Chamani J (2017)
Study on effect of lomefloxacin on human holo-transferrin in the presence of essential and nonessential amino acids: spectroscopic and molecular modeling approaches. Int J Biol Macromol 97:688–699 22. Chamani J, Heshmati M (2008) Mechanism for stabilization of the molten
globule state of papain by sodium n-alkyl sulfates: spectroscopic and calorimetric approaches. J Colloid Interface Sci 322:119–127 23. Moosavi-Movahedi AA, Chamani J, Ghourchian H, Shafiey H, Sorenson
CM, Sheibani N (2003) Electrochemical evidence for the molten globule states of cytochrome c induced by N-alkyl sulfates at low concentrations. J Protein Chem 22:23–30
24. Chamani J (2006) Comparison of the conformational stability of the non-native α-helical intermediate of thiol-modified β-lactoglobulin upon interaction with sodium n-alkyl sulfates at two different pH. J Colloid Interface Sci 299:636–646
25. Omidvar Z, Asoodeh A, Chamani J (2013) Studies on the antagonistic behavior between cyclophosphamide hydrochloride and aspirin with human serum albumin: time-resolved fluorescence spectroscopy and isothermal titration calorimetry. J Solut Chem 42:1005–1017 26. Shi J-H, Wang J, Zhu Y-Y, Chen J (2014) Characterization of interaction
between isoliquiritigenin and bovine serum albumin: spectroscopic and molecular docking methods. J Lumin 145:643–650
27. Cui F-L, Fan J, Li J-P, Hu Z-D (2004) Interactions between 1-benzoyl-4-p -chlorophenyl thiosemicarbazide and serum albumin: investigation by fluorescence spectroscopy. Bioorg Med Chem 12:151–157
28. Lackowicz J (2006) Principle of Fluorescence spectroscopy, 2006, vol 13. Springer Science and Business Media, LLC, New York, p 978
29. Moriyama Y, Ohta D, Hachiya K, Mitsui Y, Takeda K (1996) Fluorescence behavior of tryptophan residues of bovine and human serum albumins in ionic surfactant solutions: a comparative study of the two and one tryp-tophan (s) of bovine and human albumins. J Protein Chem 15:265–272 30. Lakowicz JR, Weber G (1973) Quenching of fluorescence by oxygen.
31. Hu Y-J, Liu Y, Wang J-B, Xiao X-H, Qu S-S (2004) Study of the interaction between monoammonium glycyrrhizinate and bovine serum albumin. J Pharm Biomed Anal 36:915–919
32. He LL, Wang X, Liu B, Wang J, Sun YG (2010) Interaction between raniti-dine hydrochloride and bovine serum albumin in aqueous solution. J Solut Chem 1(39):654–664
33. Ni Y, Liu G, Kokot S (2008) Fluorescence spectrometric study on the inter-actions of isoprocarb and sodium 2-isopropylphenate with bovine serum albumin. Talanta 76:513–521
34. Ross PD, Subramanian S (1981) Thermodynamics of protein association reactions: forces contributing to stability. Biochemistry 20:3096–3102
35. Albert DH, Tapang P, Magoc TJ, Pease LJ, Reuter DR, Wei R-Q et al (2006) Preclinical activity of ABT-869, a multitargeted receptor tyrosine kinase inhibitor. Mol Cancer Ther 5:995–1006