Ecological Modelling 143 (2001) 1 – 7
Modeling ecological and economic systems with STELLA:
Part III
Abstract
This special issue contains a group of eight modeling studies covering a range of ecological and economic systems and problems. The models were all developed using Stella®, an icon-based software package specifically designed for dynamic systems modeling. Models included in the special issue were built to describe and analyze: communities of organisms under the effects of random variability in disturbance rates and episodic disturbances; a spatially explicit metapopulation of white-tailed deer in a simulated landscape; a parcel level study of landcover change for smallholders in Altamira, Brazil; a discrete-time age structured single species fishery with dynamic total allowable catch limits; a metapopulation with an Alee effect driven to extinction by environmental stochasticity; seasonal deciduous forest growth to compare with remote sensing data (NDVI); herbivorous consumers in the Great Bay Estuary (New Hampshire); and dynamic patterns of deforestation in the Brazilian Amazon in relation to the value of ecosystem services. Most of the models described in this issue are available for download from http:// iee.umces.edu/DMEES/Arch. A run time only version of Stella for Windows or the Macintosh is available for free to run the models from www.hps-inc.com. © 2001 Elsevier Science B.V. All rights reserved.
Keywords:STELLA; Modeling; Economic systems
www.elsevier.com/locate/ecolmodel
1. Introduction
As interest increases in creating sustainable so-lutions to environmental and economic problems, the need for methods to understand and predict the outcomes of policy decisions becomes more urgent. Where long-term studies or experimental manipulations are not possible (as is often the case in complex ecological – economic systems) representative models can help to fill knowledge gaps (Costanza et al., 1993). This special issue of
Ecological Modelling contains a series of models developed by relatively ‘novice’ modelers who built their models in a relatively short period of time to answer a wide range of questions about the ecological and/or economic systems they had
been studying. This is the third in a series of special issues devoted to this topic.1
All of the models were initially constructed during two seminar-style courses at the University of Maryland at College Park in the Fall of 1998 and the Fall of 1999. Participants were first intro-duced to systems thinking, basic modeling con-cepts, and the modeling program Stella®. Then
individuals or groups chose a problem that each would explore over the rest of the term. The remainder of the class was spent in an open format where students provided one another with progress reports and feedback on their projects.
1See Costanza et al. (1998) for the first in the series, and Costanza and Gottlieb (1998) for the second.
Participants continued to work on their models after the course ended.
As one can see in this issue, the problems that concern researchers in the ecological and eco-nomic sciences are quite varied. Nonetheless, rela-tively simple models can provide a great deal of insight into the questions, ‘what is going on?’ or ‘what happens if. . .?’ These models (like all mod-els) obviously should not be considered to be final answers to their associated complex questions, but instead as syntheses of existing information and guides or maps to direct future work.
2. Modeling approaches
Scientists may be led to modeling for a number of reasons. Hall and Day (1977) consider three uses of models: understanding, assessing, and op-timizing. Models can be used to gain a conceptual picture of how a system of interest might work. In many cases, these types of models are generated before any field or laboratory studies have been conducted, and their main purpose is to examine what features are the most critical in determining system behavior. At the next level, after empirical measurements had been taken, models can be used to test assumptions about the system. For example, in nutrient-dosing mesocosm experi-ments, models of the system can help researchers to determine pathways of nutrient flow that result in observed conditions over a period of time. Finally, along the lines of predicting system be-havior, researchers may want to know what con-ditions will lead to an optimal outcome of some property of the system. This type of analysis is essential to informed policy decisions and often cannot be performed without an integrated model of natural and human systems.
Most of the models in this special issue belong to the first category — they are theoretical models built to understand phenomena and processes. This is clearly because of the limited time that was available during the one semester course to de-velop the models. The effort needed to move on to the assessment and optimization type of models is considerably larger, and requires more time, data, and model analysis. Many of the models
presented in this issue will be used as tools in ongoing investigations of the systems they de-scribe. Some may be changed radically in struc-ture or parameter sets after more empirical information about the system has been gathered. An important point about modeling is that it is an evolving process that sometimes requires one to discard early work and go back to the proverbial drawing board. Fortunately, as will be discussed in the next section, the Stella®modeling language
makes this part of the process very easy.
There are a large variety of software tools currently available for simulation modeling. Be-tween the qualitative conceptual model and the computer code, there are many software packages that can help convert conceptual ideas into a running model. Usually, there is a trade-off be-tween universality and user-friendliness. At one extreme are computer languages that can be used to translate any concept and any knowledge into working computer code. At the other extreme are implementations of particular models that are good only for the individual systems and condi-tions for which they were designed. In between there are a variety of more universal tools. Among them we can distinguish betweenmodeling languages, which are computer languages designed specifically for model development, andextendible modeling systems, which are modeling packages that allow specific code to be added by the user if the existing methods are not sufficient for their purposes. In contrast, there are also modeling systems, which are completely prepackaged and do not allow any additions to the methods pro-vided. There is a remarkable range among these packaged and extendible systems in terms of their user-friendliness. In general, the less power the user has to modify the system, the fancier the graphic user interface (GUI) and the easier the system is to learn. Extendible models, are individ-ual models that can be adjusted for different locations and case studies. In these, the model structure is much less flexible, the user can make choices from a limited list of options and it is usually just the parameters and some spatial and temporal characteristics that can be changed.
Stella® was one of the first dynamic modeling
Editorial 3
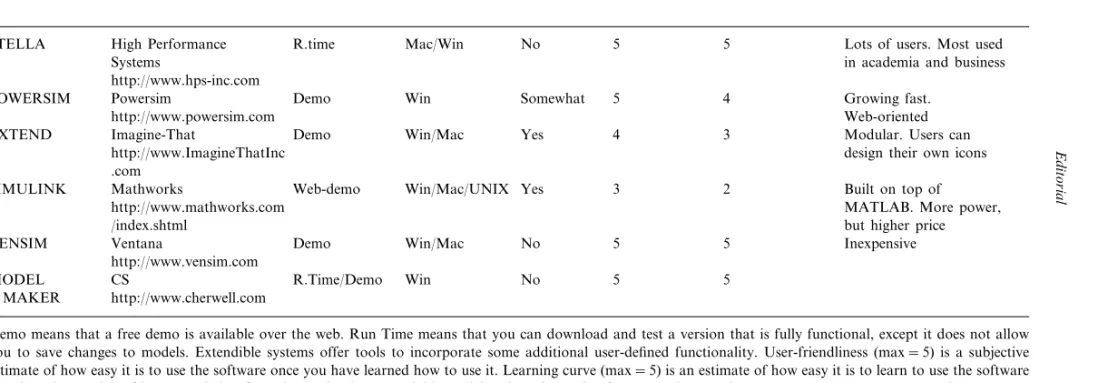
in large part to its user-friendly graphic interface. In the years that followed, a number of competing software packages have appeared. Table 1 presents some general information about eight modeling systems that are currently available. This is not a full list; there are several others available, but these are the ones that are most well known. The point is that sophisticated computer simulation modeling is becoming much more accessible, use-ful, and popular.
3. Brief overview of the Stella modeling package
Stella® is a user-friendly program that uses an
iconographic interface to facilitate construction of dynamic systems models. It includes a procedural programming language that is useful to view and analyze the equations that are created as a result of manipulating the icons. The essential features of the system are defined in terms of stocks (state variables), flows (in and out of the state variables), auxiliary variables (other algebraic or graphical relationships or fixed parameters), and informa-tion flows. Mathematically, the system is geared towards formulating models as systems of ordi-nary differential equations and solving them
nu-merically as difference equations. The user places the icons for each of the stocks in the modeling area and then connects them by flows of material or informational relationships. Next the user defi-nes the functional relationships that correspond to these flows. These relationships can be mathemat-ical, logmathemat-ical, graphmathemat-ical, or numermathemat-ical, and the pro-gram allows quite a bit of flexibility here.
Stella®represents stocks, flows and parameters,
respectively, with the following icons:
Connections between features are defined using ‘information arrows’ with the following icon:
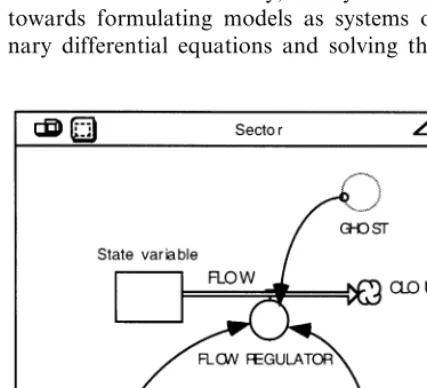
The user generates a complete structure which would resemble the diagram depicted in Fig. 1. Stocks represent a reservoir of material such as population, biomass, nutrients, or money. Mate-rial flows between stocks or into and out of undefined sources and sinks (represented by ‘clouds’ at the ends of flow structures). Flows are affected by auxiliary variables, stocks, and other flows through the use of information arrows. Aux-iliary variables can take the form of constants, mathematical or graphical functions, and data sets. Once created, stocks and variables can be duplicated as ‘ghosts’ and used elsewhere in the model, thus avoiding a jumbled spaghetti of infor-mation arrows in the model. Portions of a larger model can be broken down into sectors which can be run independently or simultaneously to facili-tate debugging. Details about how the user defines initial conditions, functional relationships, and parameter values, generates output, and performs sensitivity analyses are provided in other publica-tions (Costanza, 1987; Hannon and Ruth, 1994; Peterson and Richmond, 1996).
4. Summaries of individual contributions
There are eight contributions included in this special issue, covering a range of ecological and economic systems and time and space scales.
Editorial Table 1
Brief comparison of some of the existing modeling software systems (Voinov, 1999)
Company URL Learning curve
Name Demo/run time Platform Extendable User-friendliness Comments
No 5 5
R.time Mac/Win Lots of users. Most used
STELLA High Performance
in academia and business Systems
http://www.hps-inc.com
5 4 Growing fast.
Powersim Somewhat
POWERSIM Demo Win
Web-oriented http://www.powersim.com
EXTEND Imagine-That Demo Win/Mac Yes 4 3 Modular. Users can
http://www.ImagineThatInc design their own icons
.com
Yes 3 2 Built on top of
SIMULINK Mathworks Web-demo Win/Mac/UNIX
MATLAB. More power, http://www.mathworks.com
but higher price /index.shtml
VENSIM Ventana Demo Win/Mac No 5 5 Inexpensive
http://www.vensim.com
5 5
Win No
R.Time/Demo CS
MODEL
http://www.cherwell.com MAKER
Editorial 5
C. Brassil (this issue) studied a population in which per capita growth rate increases with den-sity — the so-called ‘Allee effect’. He considered the strong Allee effect, which assumes that growth rate is negative at low densities. He starts with a model of a single population and then expands his analysis to a metapopulation, which in this case is a system of nine local populations connected by migration. The model was originally constructed in Stella®. Afterwards, a dedicated C+ + model
was built to do the analysis of single patch and metapopulation dynamics. The Stella model was developed as a ‘scoping’ overview model (Costanza and Ruth, 1998) that could be quickly constructed. It was used to identify the scope of analysis and the areas that needed further detail and more in-depth analysis. More specialized models and code can then be created only if required. In this case compiled C+ + code was essential to perform the numerous model runs and generate statistically significant results about time to extinction in the modeled system.
Another metapopulation model was developed by S. Walters (this issue). In this case the Stella®
software was used in combination with RULE, a landscape modeling software package used for generation and analysis of artificial landscape maps. A seperate Fortran program was written to calculate interpatch distances. After a simulated landscape was created, the ‘Array’ feature in Stella was used to store the variables and parame-ters for ten patches. The effects of landscape characteristics (patch sizes, interpatch distances, patch productivity) and maximal dispersal dis-tance on the dynamics of white-tailed deer were then explored. The deer population was modeled by a Leslie matrix with four age classes. The net primary productivity (NPP) and the size of a patch were the two factors that determined the carrying capacity of a patch. Larger blocks of habitat were shown to be more likely to support larger populations. However, patterns of produc-tivity also had a significant impact on dispersal patterns, turning smaller patches into population sources under higher, or even fluctuating, productivity.
M. Liddel (this issue) also considered a theoret-ical model of population dynamics. In this case
the ‘Array’ feature in Stella® was used to study
the effects of stochastic and episodic disturbances on the competitive interactions between nine spe-cies. Even though the model was based on some field studies of species of encrusting bryozoans, the paper is not intended to be an accurate model of the bryozoan community. For each of the species the model takes into account recruitment, competitive mortality (both as functions of carry-ing capacity, birth rates and competition) and disturbance mortality, which is driven by stochas-tic factors. The author seeks certain theorestochas-tical conclusions, such as that variability can result from stochastic and episodic disturbances. The analysis performed clearly shows that community structure can be dramatically changed by random variations in disturbance rates, especially when combined with major episodic disturbances.
Another theoretical study was performed by A. Birky (this issue) who used a Stella® model of a
deciduous forest to compare its output with re-mote sensing data. The normalized difference veg-etation index (NDVI) is a greenness index that has been proposed to evaluate the leaf area index (LAI) and primary productivity from satellite im-agery. There is still considerable controversy about the utility of this index (Gobron et al., 1997). The Stella model of seasonal carbon dy-namics in deciduous forests was built to make use of data available from six sites in Maryland, and to investigate the relationship between temporal NDVI variations and both productivity rates and leaf biomass. The model could explain only some of the temporal variation in NDVI, which clearly indicates that there are other important factors, primarily atmospheric, climatic and hydrologic ones, that may be essential to include in order to improve the correlations.
I. Dew (this issue) built a Stella®-based
auto-matically adjusted based on the previous TAC, the yield, and a user-selected damping factor. The main purpose of the model is to analyze the relationship between initial TAC, initial fishing effort and the TAC adjustment damping factor. This is an attempt to use the model in an opti-mization context, though it would still require a significant additional effort to apply the model to an actual fishery, calibrate it, and test it for a wide range of conditions.
The paper by Behm and Boumans (this issue) is a more applied study. The populations of herbivo-rous consumers were modeled for the Great Bay Estuary in New Hampshire. In this case detailed temporal and spatial data sets were used to cali-brate the model. Stella was used to build a unit local model of the consumers, which was then embedded into the spatial modeling environment (SME; Maxwell and Costanza, 1997; http://
iee.umces.edu/SME3/) to further investigate the spatial dynamics of the ecosystem. Depending on the time needed to travel from one location to another, three types of consumers were consid-ered: fast movers, slow movers, and sedentary. Food availability and competition determined the movement. For the local model, results indicated that metabolic activity had a significant impact on consumption. In the spatial implementation the consumers were shown to aggregate in areas of high food biomass. Travel time was the other important factor that determined the growth rate. A major finding of this study was the identifica-tion of gaps in the data and the formulaidentifica-tion of hypotheses to drive future field studies.
The other two papers in this issue are related to land use issues in the Brazilian Amazon. Evans et al. (this issue) analyzed the process of landcover change associated with the construction of the Trans-Amazon Highway. They built a parcel-level model that keeps track of the proportion of the parcel in mature forest, secondary forest, peren-nial crops, annual crops and pasture. Each land-use activity is assigned a specific utility, based on the labor and economic resources available to the household and the expected benefit from that land use. The model includes sectors that represent demography, institutions, economic/household finances, labor allocation and land-use decision
making. The ecological parameters (soil fertility, topography, hydrology, etc.) are assumed to be homogeneous within a parcel. The ability of Stella to quickly create a friendly user interface was exploited to simplify scenario testing. The model showed a rapid reduction in the amount of ma-ture forest in the 30 years following initial settle-ment, after which the parcel is composed of a mosaic of secondary succession, pasture and crops.
Portela and Rademacher (this issue) studied almost the same system, but they focused on the issues of ecosystem services and ecosystem valua-tion. In their model, deforestation is driven by socio-economic processes, which modify the tran-sition rates between the six land-use types they considered. Different land-use patterns greatly im-pact the quality and economic value of ecosystem services. Ecosystem services modeled include the region’s hydrologic cycle, the nutrient cycle, car-bon sequestering capacity, and species diversity. Monetary values were assigned to the ecosystem services to estimate the change in economic value associated with various land-use patterns and policies. In the base case scenario, it was shown that over 100 years, forest area declined to about 44% of the original area with pasture and aban-doned pasture becoming the dominant land uses. The value of ecosystem services declined from $1431/hectare per year for forests to $658 and $781/hectare per year for agriculture and pasture, respectively.
Most of the models described in this issue are available for download from http://iee.umces.edu/
DMEES/Arch. A run time only version of Stella for Windows or the Macintosh is available for free to run the models from www.hps-inc.com.
5. Conclusions
Editorial 7
the danger of its misuse. It is as important to understand the range of uses of models and their limits in these uses as it is to understand the technical details of the models themselves. This collection of models does an admirable job of using new modeling tools in appropriate ways to address important science and policy questions. It also demonstrates how an initial scoping model developed in Stella® can be extended by
addi-tional modeling tools, software packages or com-puter code to cover the areas that cannot easily be dealt with within the framework of Stella®. The
scoping model can be used to understand how the system works, to analyze the relative importance of processes and connections in the system, and to identify the gaps in experimental information. Stella® or other similar modeling packages can
significantly simplify this stage. From the scoping model one can then intelligently and effectively move on to more elaborate research and manage-ment models (Costanza and Ruth, 1998) that involve more real world data and more intensive analysis.
References
Costanza, R., 1987. Simulation modeling on the Macintosh using STELLA. BioScience 37, 129 – 132.
Costanza, R., Gottlieb, S. (Eds.), 1998. Modeling ecological and economic systems with STELLA: Part II. Special Issue of Ecol. Model. Vol 112(2,3), 81 – 247.
Costanza, R., Ruth, M., 1998. Using dynamic modeling to scope environmental problems and build consensus. Envi-ron. Manage. 22, 183 – 195.
Costanza, R., Wainger, L., Folke, C., Ma¨ler, K-G, 1993. Modeling complex ecological economic systems: toward an evolutionary, dynamic understanding of people and nature. BioScience 43, 545 – 555.
Costanza, R., Duplisea, D., Kautsky, U. (Eds.), 1998. Model-ing ecological and economic systems with STELLA. Spe-cial issue of Ecol. Model. 110(1), 1 – 103.
Hall, C.A.S., Day, J.W. Jr, 1977. Systems and models: terms and basic principles. In: Hall, C.A.S., Day, J.W. Jr (Eds.), Ecosystem Modeling in Theory and Practice: An Introduc-tion with Case Histories. Wiley, New York, pp. 6 – 36. Hannon, B., Ruth, M., 1994. Dynamic Modeling.
Springer-Verlag, New York.
Maxwell, T., Costanza, R., 1997. A language for modular spatio-temporal simulation. Ecol. Model. 103, 105 – 113. Peterson, S., Richmond, B., 1996. STELLA Research
Techni-cal Documentation. High Performance Systems, Inc., Hanover, NH.
Gobron, N., Pinty, B., Verstraete, M., 1997. Theoretical limits to the estimation of the Leaf Area Index on the basis of visible and near-infrared remote sensing data. IEEE Trans. Geosci. Remote Sens. 35, 1438 – 1445.
Voinov, A., 1999. Simulation Modeling, Online Course. http://
iee.umces.edu/AV/Simmod.html
Robert Costanza, Alexey Voinov
Uni6ersity of Maryland Center for En6ironmental Science,
Department of Biology, and Institute for Ecological Economics,
Box38, 1 Williams St.,
Solomons,
MD 20688-0038,
USA