Darade. World Journal of Pharmaceutical and Life Sciences
ANALYSIS OF DIFFERENT PARAMETERS OF THE SOIL
Darade Maruti S.*
P.G. Department of Botany Govt. Vidarbha Institute of Science and Humanities, Amravati (M.S.), India.
Article Received on 09/09/2018 Article Revised on 30/09/2018 Article Accepted on 21/10/2018
INTRODUCTION
Soil is abiotic factor of our environment and it is influenced by climatic and biotic factors acting on it. It forms the intermediate zone between the atmosphere and the lithosphere. Soil is the uppermost weathered layer of the earth’s crust in which are found mixed type of organisms and products of their death and decay. The plants are anchored in the soil for their growth. It is complex organization made up of inorganic matter, organic matter, soil organisms, soil moisture, soil solution etc. Soil contains about 50-60 % mineral matter, 25-35% water, 15-25% air and little percentage of organic matter .The productivity of an ecosystem depends upon the quality of soil. The parameters of soil are some above and some below the permissible limit that affect the quality and productivity.[1] The soil quality thus may be defined as the capacity of a specific kind of soil to function within natural or managed ecosystem boundaries to sustain plant and animal productivity, to maintain and enhance water and air quality and also support health and habitation.[2] It possess certain distinctive physical, chemical and biological qualities which permit it to support plant growth.
Plant growth depends on many things such as soil texture, soil pH, nutrients, organic matter, water holding capacity, microorganism, structure, microclimate, irrigation facility, land fragmentations, soil erosion, agricultural system and practices, diseases, insects, consumptions of nutrients by crop, leaching of nutrients etc. The pH of soil is one of the most important parameter.
The pH level of the soil can tell a lot about the potential availability of plant nutrients and on possible toxicities of other elements The soil moisture is the water that is held in the spaces between soil particles. Surface soil moisture is the water that is in the upper 10 cm of soil, whereas root zone soil moisture is the water that is available to plants which is generally considered to be in the upper 200 cm of soil. The electrical conductivity of soil is a measurement of the dissolved material in an aqueous solution which relates to the ability of the material to conduct electrical current through it. Soil salinity is the salt content in the soil, the process of increasing the salt content is known as salinization. Salts occur naturally within soils and water. Salination can be caused by natural processes such as mineral weathering or by the gradual withdrawal of an ocean. It can also come about through artificial processes such
World Journal of Pharmaceutical and Life Sciences
WJPLS
www.wjpls.org SJIF Impact Factor: 5.008
*Corresponding Author: Darade Maruti S.
P.G. Department of Botany Govt. Vidarbha Institute of Science and Humanities, Amravati (M.S.), India.
ABSTRACT
The soil analysis with respect to different parameters was carried out in the campus of institute. The parameters like pH, electrical conductivity, moisture, salinity and water holding capacity of soil were analysed. It was observed that the soil parameters were fluctuating in different localities of the campus of the institute. The soil samples were collected from different locations of the campus of the institute. In the analysis of samples it was found that the pH of soil samples ranged between 5 to 7.5. The lowest pH (5.0) was found in sample E (acidic soil) and highest (7.5) noted in the sample C, D and F (basic soil). The sample A and B had showed neutral type of soil. The values of electrical conductivity were found in the range from 569.7µS/cm to 727.2µS/cm. The lowest electrical conductivity value (569.7µS/cm) was noted in sample A, whereas the sample B showed highest electrical conductivity (727.2 µS/cm) .The lowest soil moisture was found (0.18 %) in sample D, while it was shown highest (2.48%) in sample F. The salinity of different soil samples were determined and it was noted, it ranged from 520.40 g/liter to 676.57 g/liter. The lowest salinity value was noted (520.40 g/liter) in sample B, whereas the sample F showed highest salinity value (676.57 g/liter). The water holding capacity was found to be varied from 0.58 % to 8.57 %. The Sample D has shown lowest percentage (0.58%) and highest (8.57%) water holding capacity was recorded in sample E.
as irrigation. Salinity in dry land can occur when the water table is between two and three metres from the surface of the soil. The soil water holding capacity is the amount of water that a given soil can hold for crop use. The soil holds considerable amount of water called water holding capacity of soil. The soil can take in water and will keep doing so until they are full, or until the rate at which they can transmit water into and through the pores is exceeded. Some of this water will steadily drain through the soil via gravity and end up in the waterways and streams, but much of it will be retained, despite the influence of gravity. Much of this retained water can be used by plants and other organisms, thus contributing to land productivity and soil health.
To know different parameters and the status of soil in the campus of our institute, present research work is attempted.
MATERIALS AND METHODS
Location of study area
Amravati district is situated between 20 ° 32 and 21.46 north latitude and 76° 37 and 78° 27 east longitude. Amravati city is located at 20.93 ° N 77.75 ° E. It has a tropical wet and dry climate with hot, dry summers and mild to cool winters, Summer lasts from March to June, Monsoon season from July to October and Winter from November to March.
Selection of Site
Govt. Vidarbha Institute of Science and Humanities (G.V.I.S.H.) is a premier educational institute in Vidarbha region of Maharashtra state in India. It is located in Amravati city in the district of Amravati .The campus of the institute is constituted by non agricultural land having different types of soil and lush of vegetation with grasses, climbers, herbs, shrubs and trees .The soil samples for analysis were collected from the campus of institute itself. The sample - A constituted of surrounding area of auditorium hall, The sample - B from apsara garden, The sample - C from Botany departmental rearch field area .The sample - D from play ground of physical education. The sample - E from botanical garden of botany department and sample - F collected from Yog bhawan area.
Collection of soil sample
The soil samples from different localities of the campus of institute were collected in the month of January to March 2018. At the outset the land surface was cleared by removing surface debris of the soil. The clumps of soil was grinded to particulate. The air dry soil was passed through 2 mm sieve to remove stones and other unnecessary matter of the soil. Soil samples were collected in the depth of 5-20 cm by digging with trovel. Total Six replicates of representative soil samples were collected. The replicates of same samples were mixed thoroughly. The samples were brought separately to the laboratory and then shade dried. The soil samples was
packed separately in polythene bags by proper labeling and stored for further analysis.
Soil analysis
100 gm soil samples were taken for analysis of different parameters of the soil .The soil analysis is done with the help of soil analysis kit. The soil analysis kit was offered by Plasti Surge Industries Pvt. Ltd. PSI-503.This soil test was carried out in the research laboratory. The soil sample was used for the analysis of the microelement and macroelements. The soil analysis kit constituted of the reagents like Phosphorus reagents , potash reagents, organic carbon reagents, Nitrogen reagents, Boron reagents, Ammonia reagents, Dil. NaOH, Hydrochloric acid, Distilled water, pH indicator, polythene, glass beakers, test tubes etc.
Determination of soil pH
10 gram of soil sample were taken in 10 ml distilled water in a 100 ml glass beaker. The solution was stirred thoroughly with the help of poly rod for 15 minutes. The mixture was kept standstill for half an hour .It was then filtered through filter paper .The supernent was taken into a glass beaker. 6 ml soil extract was taken in a clean test tube .The mixture was shaked vigourously very well and the colour developed was compared the universal pH indicator and pH of soil samples were noted in different soil samples.
Determination of electrical conductivity of soil 20 gm of air dried soil sample were taken in a 250 ml borosil glass beaker and 40 ml of distilled water was added .The mixture was shaked vigorously on rotary shaker make of Toshiba. It was kept standstill for 10 to15 minutes. The mixture was filtered through what man filter paper No.1 and a clear solution was obtained. The electrical conductivity of the clear solution was measured using the micro processor based the digital electrical conductivity meter.The electrical conductivity is measured by using the the Elico Conductivity Meter CM 180.
Determination of soil moisture contents
100 gm of composite soil sample was taken in borosil watchglass It was preweighed The weight with soil sample was taken .The same sample was kept in hot air oven for 24 hours at 1050 C. Dry weight of the sample was taken till it showed its constant weight. The percentage of soil moisture was determined with the help of following formula.
(W1-W2) X 100 Moisture % = --- W1-W
Determination of salinity of soil
The salinity parameters of the soil samples were measured by the Erma Hand Refracto meter was used. The chloride value was calculated with grams per litre of the soil by using formula Salinity g/lit. = 0.03 + 1.805 X chlorinity of soil.
Determination of water holding capacity of soil A square tin box was taken and preweighed. The soil samples were crushed to fine and sieved through 0.5 mm sieve. Then box was filled 100 gm. soil sample .The care was taken to fill the box uniformly with soil. The box was kept in petri plate in which water is added slowly to a depth of soil. The assembly was left for over night, after standing the soil in water for 12 hours the soil became fully saturated. The box was kept in an oven at 100 0C .The dry weight of the soil was recorded after 24 hours until the constant weight is achieved.
RESULTS AND DISCUSSION
Soil pH refers to the acidity or alkalinity of the soil. It is a measure of the concentration of free hydrogen ions (H+) that are in the soil. The most significant property of soil is its pH level it affects on different parameters of soil. To analyse the kind of soil, pH is an important factor. If the pH is less than 6 then it is said to be an acidic soil, the pH ranges from 6 - 8.5 then it is a normal soil and if it is greater than 8.5 then it is said to be alkaline soil. Different parameters of soil samples was studied. The pH of soil is one of the most important physicochemical parameter. It affects quality and activity of soil dwelling microorganisms.The value of pH were found varied in different locations of the campus .The pH values of samples were found in the range 5.0 to 7.5. The pH with value of 7.0 being neutral. Soil with pH greater than 7.0 are considered to be alkaline soils. The ideal soil pH range for most of the agricultural crops is between 5.8 and 6.5 The pH value of different soil samples collected from different area of the campus of institute were recorded (Table 1).
Table 1: Determination of soil pH.
Sr.
No. Soil samples pH
Normal
range Type of soil
1. A 7.0 7 neutral
2. B 7.0 7 neutral
3. C 7.5 7 basic
4. D 7.5 7 basic
5. E 5.0 7 acidic
6. F 7.5 7 basic
The lowest pH was found of sample E while highest value (7.5) was noted of sample C, D, and F. The sample A and B showed the same pH value (7.0) The varied range of pHvalue was also reported.[3] The pH of soils particularly important in determining the availability and uptake of Ferrous.[4] High pH condition of soil reduces the availability of Iorn. Iron may be the limiting factor in a cropping system. If Fe is not soluble then plants exhibit
deficiency symptoms regardless of the amount of the nutrient actually present.[5] The pH range of 6.8 to 8.0 has been recommended optimum for plants growth. The above 7.5 value of pH shows basic nature of soil. pH is an important parameter as it measures availability of nutrients like Fe, Mn, Zn and Cu which are more available in acidic soil than alkaline soil. Soil with pH 6.8 to 7.5 is considered to have most of the nutrients available for plants. Electrical conductivity is also a very important property of the soil, it is used to check the quality of the soil. It is a measure of ions present in solution The electrical conductivity of a soil solution increases with the increased concentration of ions. Electrical conductivity is a very quick, simple and inexpensive method to check health of soils. Electrical conductivity values of different soil samples were recorded in different
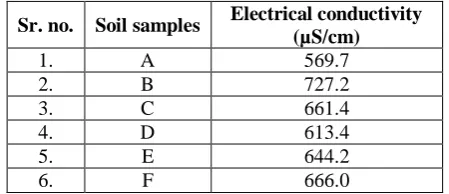
Localities of the campus (Table 2). Electrical conductivity values ranged from 569.7 µS/cm to 727.2 µS/cm. Lowest electrical conductivity value (569.7 µS/cm) was noted in sample A, while sample B showed highest electrical conductivity value (727.2 µS/cm). such type of results regarding electrical conductivity of soil was recorded.[6] The Conductivity study of soil samples shows variation in conductivity values between 0.08 mhos to 1.15 mhos , this value suggest normal soil. The electrical conductivity is one of the simplest ways to assess fertilizer levels in the soil, yield potential and soil salinity status, also suitability for the crop growing on it. Different crops have different tolerance levels to salinity. Above a certain threshold yield will decrease. The yield reduction is proportional to the increase in the electrical conductivity level. The measurement of electrical conductivity is to determine amount of salts soluble in soil.
Table 2: Determination of electrical conductivity of soil.
Sr. no. Soil samples Electrical conductivity
(µS/cm)
1. A 569.7
2. B 727.2
3. C 661.4
4. D 613.4
5. E 644.2
6. F 666.0
Table 3: Determination of moisture contents in soil.
S. N. Soil samples Moisture (%)
1. A 0.60
2. B 1.04
3. C 1.48
4. D 0.18
5. E 2.47
6. F 2.48
Soil salinity is an enormous problem for agriculture under irrigation. In the hot and dry regions of the world the soils are frequently saline with low agricultural potential. Most of the crops are grown under irrigation, inadequate irrigation management leads to secondary salinization that affects 20 % of irrigated land worldwide
[7].
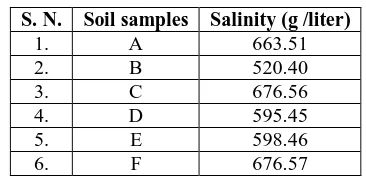
Salinity values for different soil samples were recorded in different areas of institute campus (Table 4). Salinity values ranges from 520 g/liter to 676.57 g/liter. Lowest salinity value was noted in sample B is 520mg/
Liter, whereas in sample F it showed highest (676.57 g/liter). Similar results were noted by.[8] Salinization is recognized as the main threats to environmental resources and human health in many countries, affecting almost 1 billion ha worldwide / globally representing about 7 % of earth’s continental extent, approximately 10 times the size of a country like Venezuela or 20 times the size of France.[9,10] It has been estimated that an approximate area of 7 million hectares of land is covered by saline soil in India.[11]
Table 4: Determination of Salinity of soil.
S. N. Soil samples Salinity (g /liter)
1. A 663.51
2. B 520.40
3. C 676.56
4. D 595.45
5. E 598.46
6. F 676.57
Irrigated agriculture is a major human activity, which often leads to secondary salinization of land and water resources in arid and semi-arid conditions. Salts in the soil occur as ions (electrically charged forms of atoms or compounds). Ions are released from weathering minerals in the soil. They may also be applied through irrigation water or as fertilizers, or sometimes migrate upward in the soil from shallow groundwater. When precipitation is insufficient to leach ions from the soil profile, salts accumulate in the soil resulting soil salinity [12].All soils contain some water-soluble salts. Plants absorb essential nutrients in the form of soluble salts but excessive accumulation strongly suppresses the plant growth.
The percentage of water holding capacity of different soil samples collected from the campus of institute were noted (Table 5). It was found that water holding capacity ranged from 0.58 % to 8.57 %. The soil sample D
showed lowest water holding capacity (0.58%) while highest water holding capacity percentage was noted (8.57%) in sample E.The available water capacity of soil sample ranged from 0 .58 to 8.57 Field capacity is the point where the soil water holding capacity has reached its maximum for the entire field. The goal for agricultural producers is to maintain the field at or near capacity. When there is a deficit in the amount of water in the soil, the soil profile needs to be replenished by precipitation or irrigation. The key is for farmers to understand the nature of soil water holding capacity and how to manage it, so that the farm does not need to irrigate or suffer from a drought.
Table 5: Determination of water holding capacity.
S. N. Soil samples Water holding capacity (%)
1. A 3.29
2. B 4.28
3. C 3.45
4. D 0.58
5. E 8.57
6. F 5.4
The maximum water holding capacity, available water capacity and good water holding capacity indicates the good physical condition of soil. The water holding capacity depends upon clay content and pore size of soil.
CONCLUSION
The conclusion can be drawn that the study of physical and chemical parameters of soil samples showed dissimilar values at different places .The soil of the campus of the institute constitute both acidic and alkaline nature. The percentage of soil moisture content, water holding capacity, electrical conductivity of soil was found to be maximum in sample B. The soil of sample F would be saline in nature. The physicochemical study of different parameters is important to agricultural chemists for plants growth and soil management. The soil samples shows that all the soil parameters found are of variable range with respect to values, showing irregularity in different locality. The monitoring of soil samples is beneficial to know the concentrations of various parameters in the soil. These studies give information about nature of soil, nutrients present .The information of soil parameters would be helpful to the farmers in arranging the amount of fertilizers and nutrients to grow agricultural crops and to solve the problems related to soil nutrients and to judge fertilizer useful.
ACKNOELEDGEMENT
Yevatmal for providing soil analysis kit to determine various parameters of the soil samples.
REFERENCES
1. Saroj Mahajan and Dilip Billore Assessment of physic-chemical characteristics of the soil of Nagchoon pond Khandwa, MP India. In: Res. J Chemsci January, 2014; 4(1): 26-30.
2. Karlen, D.L., M. J. Mousbach, J. W. Doran, R. G. Cline, R. F. Harrisand G. E. Sachuman Soil quality: A concepet, definition and framework for evaluation. In: Soil sci. Am. J., 1997; 61: 4-10. accessed
fromhttp://soilquality.org/basics/definaations.html. 3. Sharrif M. and A. M. Moawad Arbuscular
mycorrhizal incidence and infectivity of crops in North West Frontier of Pakistan. In: World journal of Agricultural sciences, 2006; 2(2): 123-132. 4. Brady, N.C. and R. R. Weil Elements of the Nature
and Properties of soil, 2nd Ed. (Upper Saddle River, N.J. In: Pearson Education, Inc., 2002.
5. Bybordi, A. and G. Mamedov Evaluation of Application Methods Efficiency of Zinc and Iron for Canola (Brassica napus L.) In: Notulae Scientia Biologicae, 2010; 2(1): 94- 103.
6. Rajesh P., Ganorkar P.G., Chinchmalatpure Physico-chemical assessment of soil in Rajura Bazar in Amravti district of Maharastra (India). In: International Journal of Chemical, Environmental and Pharmaceutical Research May to December, 2013; 4(2 & 3): 46-49.
7. Glick, B.R., Cheng Z., Czarny J., Duan J. Promotion of plant growth by ACC deaminase-producing soil bacteria. In: Eur. J. Plant Pathol, 2007; 119: 329–339.
8. Rajesh P. and Ganorkar P.G. Physicochemical Assessment of Soil in Rajura Bazar in Amravati District of Maharastra (India). In: IJECPr, 2013; 4: 46-49.
9. Metternicht, G.I., Zinck, J.A. Remote sensing of soil salinity: potentials and constraints. Remote Sens. In: Environ, 2003; 85: 1–20.
10. Yensen, N.P. Halophyte uses for the twenty-first century. .In: Khan M.A., Weber D. J. editors. Ecophysiology of High Salinity Tolerant Plants. Springer; Dordrecht, 2008; 367–396.
11. Patel, B.B., Bharat. B., Dave R.S. Studies on infiltration of saline–alkali soils of several parts of Mehsana and Patan districts of north Gujarat. In: J. Appl. Technol. Environ. Sanitation, 2011; 1(1): 87–92.