infiSTER CO'!'
JOURNAL OF PLANT NUTRITION, 12(9), 939-972 (1989)BRAGG SOYBEANS GROWN ON A SOUTHERN COASTAL PLAIN SOIL IV. SEASONAL CHANGES IN NODAL N AND P CONCENTRATIONS
R. E. Sojka 1 , D. L. Karlen2 , and R. D. Scott 3 1 Soil Scientist, USDA-Agricultural Research Service
Soil and Water Management Research Unit, Route 1, 3793 N. 3600 E., Kimberly, ID 83341 2Soi1 Scientist, USDA-Agricultural Research Service
National Soil Tilth Laboratory 2150 Pammel Drive, Ames, IA 50011 3Professor of Agronomy, Department of Agronomy University of Arkansas, Fayetteville, AR 72701
In cooperation with the
South Carolina Agricultural Experiment Station Clemson, SC 29631
ABSTRACT
Determinate soybean [Clycine max (L.) Merr.] has been characterized by few detailed nitrogen and phosphorous partitioning studies. Knowledge of the variation in N and P concentrations with plant part, nodal
position, and plant age
is
needed for a better
understanding of plant functions. In this field study, 'Bragg'soybean was grown on an Aquic Paleudult soil (series Goldsboro loamy sand). Plants were sampled at 10 to 14 day intervals beginning 44
939
days after planting (July 7) until harvest. Maximum observed N concentrations were 3.1, 2.8, 5.8, and 5.4% for stem internodes, petioles (+branches), leaf blades, and pods, respectively. Maximum observed P concentrations were 0.34, 0.48, 0.78, and 0.52 for the same respective plant parts. Nodal and temporal mean N and P concentrations varied considerably with plant age and nodal position in all plant parts. These data show that mean N and concentrations in all four plant parts can vary several fold, depending upon plant age and nodal position for the sample. This suggests caution should be exercised in tissue sampling and interpretation of plant analysis. Concentrations of N and P generally decreased with time for stem internode, petioles (+branches), and leaf blades, but increased with time for pods. Except for N concentration in stem internodes, which increases with internode number, the N and P concentrations remain nearly constant throughout the growing season. The relationships provide insight for developing accurate plant models depicting N and P concentrations and translocations over time and among plant parts in determinate soybean.
INTRODUCTION
BRAGG SOYBEANS. IV 941 Effects of plant age and/or morphology on seasonal changes in elemental concentrations and partitioning within field-grown soybean are not thoroughly documented, particularly on a nodally segmented basis. Furthermore, the majority of partitioning studies that have been conducted have evaluated indeterminate cultivars 405.904,8,2 rather than determinate cultivars 23.10 ' 3 . Analysis on a nodal basis, though very labor intensive, allows for estimates of remobilization from vegetative to reproductive plant fractions 12,6,25.15 . Nodal analysis can also be used to validate nutrient modeling concepts 16 and to better understand changes in nutrient concentrations within the plant for diagnostic purposes.
The purpose of this paper is to characterize N and P accumulation and distribution for a determinate soybean cultivar on a nodal basis. Nitrogen and P concentrations are discussed together because N stress has been shown to increase P concentrations 24 . METHODS AND MATERIALS
A detailed description of field layout and operations, experimental design, and plant sampling has been presented by Scott et al. 19 . Briefly, a field study was conducted in 1979 at the Clemson University Research and Education Center near Florence, South Carolina on a Goldsboro loamy sand (Aquic Paleudult). The experiment site, described by Doty and Parsons 5 , was equipped with a combination drainage-subirrigation system. Soil water status was monitored and regulated with tensiometers placed within and between soybean rows.
four sampling locations and four subsamples at each location. Plants in a 0.30-m2 area were counted and severed at the soil surface from 7 July to 17 October at 10- to 14-day intervals. Four representative plants were chosen, brought to the laboratory, and separated by nodes into component parts of stems (main stems only), leaves (leaf blades only), petioles (including' branch stems at that node), and pods. This sectioning scheme was employed to accommodate conceptual requirements of nodally-segmented mineral nutrient uptake models developed by Scott and Brewer" ,18,14 Nodes were numbered and growth stages identified using the conventions of Fehr at 411.2.
Each numbered internodal main stem segment was made up of the identified node (node s) and internodal tissue between it and the next lowest numbered node (node„ -1 ). Throughout the season the partitioned dry matter components were oven dried at 60C, weighed, ground to pass a 0.5 mm stainless steel screen, digested with sulfuric acid and hydrogen peroxide, and analyzed for N using industrial method 334-74 w/B22. Ammonium molybdate -ammonium vanadate reagents were
used for
phosphorous by the method of Jackson 11 . Analysis of N and P were verified periodically using N8S standard tissues.Water pH and prefertilization Mehlich 1 extractable P, K, Ca, and Mg concentrations in mg Kg -1 at the experimental site were 6.1, 73, 105, 68, and 413 for the Ap horizon; 5.8, 12, 64, 32, and 200
for the E horizon (A2 ); and 4.8, 1, 144, 94, and 353 for the 8 t
horizon, respectively. Hicronutrient concentrations in the Ap were "adequate" for soybean production by Clemson University soil test results.tRAGG "SOYBEANS. IV 943
RESULTS AND DISCUSSION
Mean N and P concentration data are grouped and reported sequentially for stem internode, petioles + branches, leaf blades, and pods (pod walls + beans). The data are illustrated by nodal origin (internodes in the case of stems) to show how sampling position influences plant nutrient concentration, by date to show effect of sampling time, and in response surfaces to show the combined statistical effect of those two parameters. Regression equations provide information useful for development of nodally segmented translocation models, such as Sallam et
81. 16 ,
developed for K. The polynomial relationships for calculating N and P statistical response surfaces are presented in Table 1. Polynomial relationships for calculating statistical response surfaces of growth parameters and K, Ca, Mg, Fe, Zn, and Mn concentrations were79,27,20. The LSD's and CV's present previously reported earlier
undetermined variances caused by nodal sampling position and time after planting for N and P concentrations.
Stem internodes
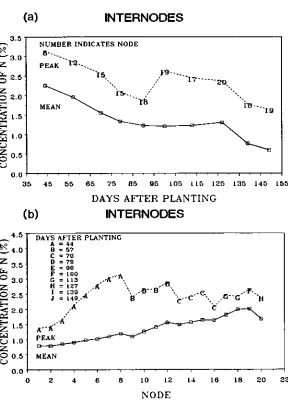
Elemental concentrations are presented in Figures 1-4. Maximum observed concentrations of N and P in internode were 3.13 and 0.34%, respectively, both measured at internode 8 and collected 44 days after planting. Mean internode N concentration (Fig. la) declined nearly linearly from 2.25% at the V8 growth stage on day 44 to about 1.25% at the time of pod set (R2 to R4) 79-90 days after planting, remained constant during the pod fill period and then declined to 0.60% by the end of pod fill (R8) on day 149. When analyzed by nodal position (Fig. 1b), mean internode N concentration rose
TABLE 1.--Mathematical and statistical description of response surface relationships for the named parameters using the equation Y - a + b (node) + c (node) 2 + d (date) + a (date) 2 + £ (node) (date). Factors not
significant at the 0.1 level of probability are indicated as "NS" under the table entry.
Fig No.
Els- Coefficient Combined
R2
ment a a
f
Stem interRpde
2 N 1.062 0.007 -0.008 0.010 -0.000158 0.00162 0.33
NS WS
4 P 0.058 0.00008 -0.00078 0.0032 -0.000025 0.00012 0.50
NS VS
Petiole + Branches
6 N 0.115 0.066 -0.009 0.030 -0.000210 0.000966 0.43 NS
8
P -0.025 0.011 -0.0012 0.0045 -0.000029 0.000081 0.39 NSLeaf Blade
10 N -5.065 0.216 -0.022 0.189 -0.0011 0.0020 0.53 12 P 0.080 0.016 -0.0017 0.0076 -0.000050 0.000141 0.42
NS
Ds!
14 N -12.032 0.480 -0.026 0.203 -0.000754 0.000615 0.36 NS
16 P -0.700 0.048 -0.0024 0.014 -0.000053 0.000005 0.26
(a)
INTERNODES
NUMBER INDICATES NODE
PEAK
15,
• c
• --c z--c El
DAYS AFTER PLANTING
A = 44
▪ = 57 C = 70 D = 79 E = 90 • = 100 G = 113
H = 187 ,A I=139
41.-" ./ = 149,,
A
K-1( PEAK
MEAN
'BRAGG SOYBEANS. IV 945
35 45 55 65 75 85 95 105 115 125 135 145 155
DAYS AFTER PLANTING
(b)
INTERNODES
4.5
3.5
Czr
3.0
0 2.5
< 2.0
C4
Z 1.5
C.,) 1.0
0 0.5
0.0
0 2 4 6 8 10 12 14 16 18 20 22 NODE
%N
CONC 2.00 1.60 1.20 0.80 0.-10 0.00
149 114
DAY AFTER PLANTING NODES
0 44
INTERNODES
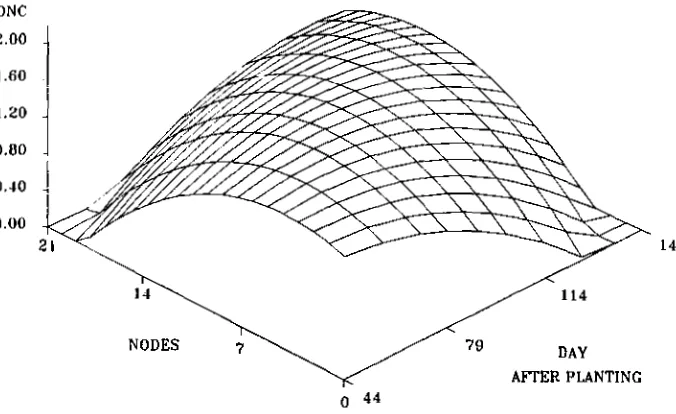
Fig. 2. Internode N X with response surface for node vs time.
nodal positions for a given sampling date. Peak N concentrations varied with internode number (Fig. lb) through the season but generally rose from the low value of 1.37% at internode 1 to a plateau around 2.5% above internode 6. At all nodal positions peak N concentrations were generally associated with the earliest sampling dates for the particular node. The statistical response surface of N (Fig. 2) showed mean internode concentration nearly constant over nodal position and time once node initiation had occurred.
(a)
INTERNODES
0.40
-° 0.35" a..
0.30 -0 Z 0.25 -O F 0.20 ' E- 0.15 ' GWr 13.10' 0.05
0.00
35 45 55 85 75 85 95 105 115 125 135 145 155
(b)
INTERNODES
DAYS AFTER PLANTING A = 44
B a 57 C 70 D =79 S =90 F = 100
▪ = 113 H = 127 = 129 • = 149
BRAGG SOYBEANS. IV 947
DAYS AFTER PLANTING
NODE
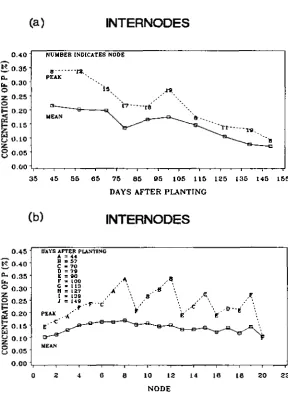
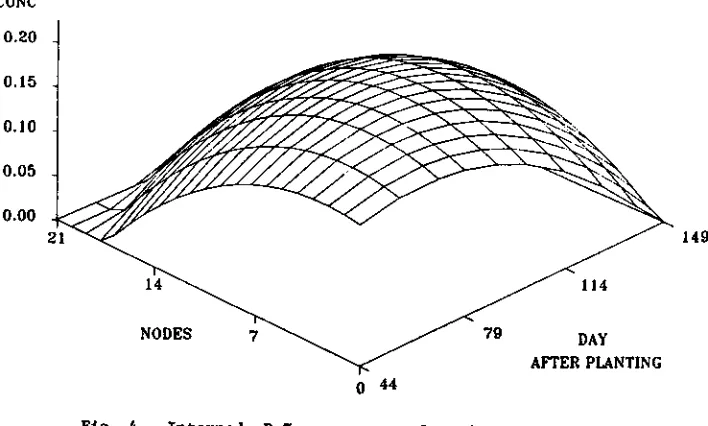
position (Fig. 3b) mean internode P concentration was nearly constant around the mean of 0.14%, though slightly lower at the highest and lowest nodal positions. Peak P concentrations fell nearly linearly with time (Fig. 3a) from a high of 0.34% on days 44 and 57 to a low of 0.08% on day 149. A brief rise in concentration occurred at R5 on day 100. Until the late reproductive stages, concentration peaks occurred in the uppermost nodal positions for those sampling dates but began to be associated with lower nodal positiOns beginning at stage R6 on day 113. Peak P concentrations varied with internode number (Fig. 3b) around a plateau value of approximately 0.23%. Peak P concentrations at all nodal positions tended to occur early in the growing season (before day 100, or stage R5). The statistical response surface (Fig. 4) indicates a tendency for mean internode P concentrations to be near their maximum at mid season and at central nodal positions.
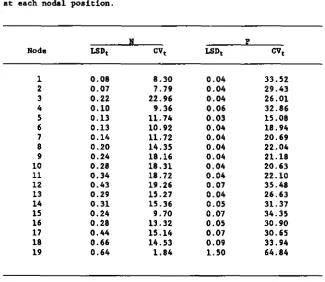
Least significant differences and coefficients of variation for mean concentrations of stem internodes are presented for nodal sources of variance (LSD, and C vin, respectively) and temporal sources of variance (MN and CVt , respectively) for N and P in Tables 2 and 3. These data can help assess the anticipated variation associated with collecting plant tissue from a particular nodal position or at a particular sampling date (or growth stage). Hissing data resulted from the need in some instances to pool tissue samples from more than one replication for elemental analysis or absence of tissue in some positions or dates.
%P CONC
0.20
0.15
0.10
0.05
0.00
149
114
DAY AFTER PLANTING
NODES 79
0 44
BRAGG SOYBEANS. IV 949
INTERNODES
Fig. 4. Internode P % response surface for node vs time.
TABLE 2.--Nodal concentration (%) variance of
sta.
internodes at selected sampling dates.Days
after planting N______
P
LSD, CV, LSD, CV,
44 0.17 7.20 0.02 8.96
57 0.22 10.00 0.03 13.75
70 0.21 14.33 0.04 20.10
79 0.20 16.55 0.04 33.58
90 0.22 21.59 0.04 27.61
100 0.16 13.36 0.06 27.61
113 0.15 8.12 0.04 15.80
127 0.15 7.93 0.05 35.85
139 0.30 27.60 0.03 28.05
TABLE 3.--Temporal concentration (%) variance of stem internodes
at each nodal position.
Node
N P
LSDt CVt LSDt CVt
1 0.08 8.30 0.04 33.52
2 0.07 7.79 0.04 29.43
3 0.22 22.96 0.04 26.01
4 0.10 9.36 0.06 32.86
5 0.13 11.74 0.03 /5.08
6 0.13 10.92 0.04 18.94
7 0.14 11.72 0.04 20.69
8 0.20 14.35 0.04 22.04
9 0.24 18.16 0.04 21.18
10 0.28 18.31 0.04 20.63
11 0.34 18.72 0.04 22.10
12 0.43 19.26 0.07 35.48
13 0.29 15.27 0.04 26.63
14 0.31 15.36 0.05 31.37
15 0.24 9.70 0.07 34.35
16 0.28 13.32 0.05 30.90
17 0.44 15.14 0.07 30.65
18 0.66 14.53 0.09 33.94
19 0.64 1.84 1.50 64.84
central nodal positions for N and for upper nodal positions for P. Generally, time-related P variances were nearly double the N variances. Central nodal positions accounted for the largest proportion of pods set, whereas upper nodal positions are associated with more Juvenile tissue and fewer sampling dates.
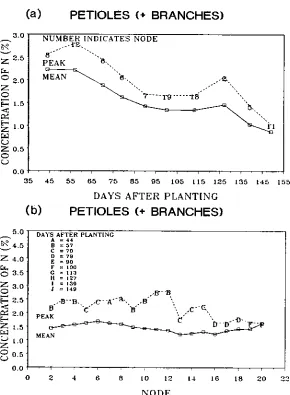
ietioles (+ Branches)
(a)
PETIOLES ( 4. BRANCHES)
75 85 95 105 115 125 135 145 155
5.0
4.5
Z 4.0 -CY., 0 3.5'
C4 2.0'
E-DAYS AFTER PLANTING A = 44
▪ = 57 C =70
▪ = 79 E = F 100 G = 113
II 127
I = 139 = 149
PEAK
T."
MEAN
BRAGG SOYBEANS. IV
951
DAYS AFTER PLANTING
(b)
PETIOLES (+ BRANCHES)
0.5
0.0
2 4 6 8 10 12 14 16 18 20 22
NODE
1.60 _ 1.20 0.80 _ 0.40 _ 0.00
DAY AFTER PLANTING NODES
0 44
PETIOLES (+ BRANCHES)
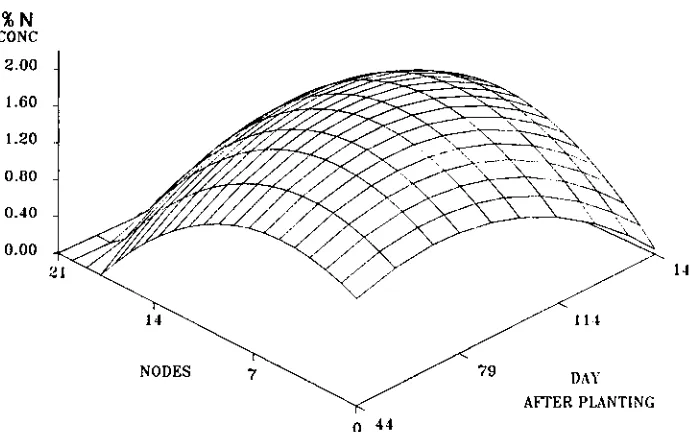
Fig. 6. Petiole (+branches) N % response surface for node vs time.
••
BRAGG SOYBEANS. IV 953
(a)
PETIOLES (+ BRANCHES)
0.55 r -7 0.50
a
0.45 1:1. 0.40 z 0.352 0.30
g
0.25 0.20 4 0.15 c.) Z 0.10 0.05 0.00 ,35 45 55 85 75 85 95 105 115 125 135
145 155
DAYS AFTER
PLANTING
(b) PETIOLES (+ BRANCHES)
0.85
g
0.80 '—' 0.55a.
0.50 0 0.45 Z 0.40 0 p 0.35g 0.30
E—. 0.25
0.20 0.15O
0.10 0.05DAYS Ann PLANTING A = 44 B=57 C = 70 = 79 = 90 F = 100
IL] 127 n I = 139 • , = 149/ • •
a
0.00
0 2 4
6
8
10 12 14 18 18 20 22NODE
% P
CONC 0.25 0.20 0.15 0.10 0.05 0.00
149
114
DAY AFTER PLANTING
NODES 79
0 44
PETIOLES (+ BRANCHES)
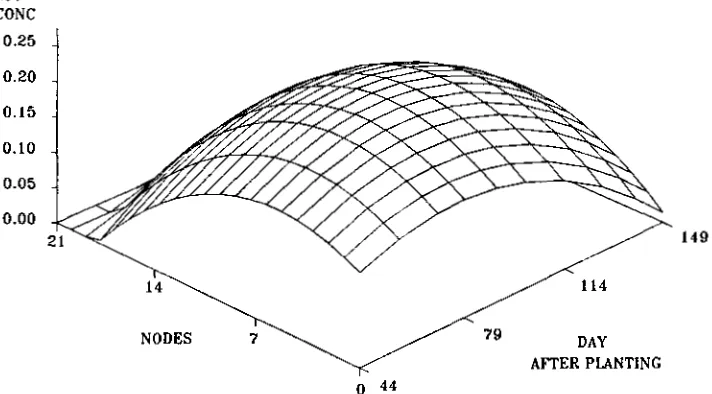
Fig. 8. Petiole (+branches) P % response surface for node vs time.
The statistical response surface for N (Fig. 6) showed higher concentrations for central nodal positions and late season sampling dates.
BRAGG SOYBEANS. IV
955
TABLE 4.--Nodal concentration (%) variance of petiole (+branches)
at selected sampling dates.
Days
N
P
after planting LSD,
CVn
LSD,
CV,
44
0.25
5.77
0.03
7.32
57
0.32
9.79
0.05
12.22
70
0.24
10.76
0.05
19.13
79
0.31
16.15
0.06
32.34
90
0.30
20.51
0.06
31.61
100
0.16
7.45
0.07
20.20
113
0.22
10.36
0.07
28.30
127
0.25
10.99
0.10
48.57
139
0.25
15.58
0.05
47.78
149
0.30
21.13
0.08
37.15
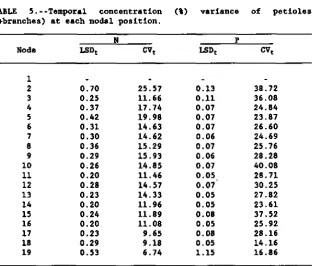
TABLE 5.--Temporal concentration (%) variance
ofpetioles
(+branches) at each nodal position.
N
PNode
LSDt
CVt
LSDt
CVt
1
2
0.70
25.57
0.13
38.72
3
0.25
11.66
0.11
36.08
4
0.37
17.74
0.07
24.84
5
0.42
19.98
0.07
23.87
6
0.31
14.63
0.07
26.60
7
0.30
14.62
0.06
24.69
8
0.36
15.29
0.07
25.76
9
0.29
15.93
0.06
28.28
10
0.26
14.85
0.07
40.08
11
0.20
11.46
0.05_
28.71
12
0.28
14.57
0.07
30.25
13
0.23
14.33
0.05
27.82
14
0.20
11.96
0.05
23.61
15
0.24
11.89
0.08
37.52
16
0.20
11.08
0.05
25.92
17
0.23
9.65
0.08
28.16
18
0.29
9.18
0.05
14.16
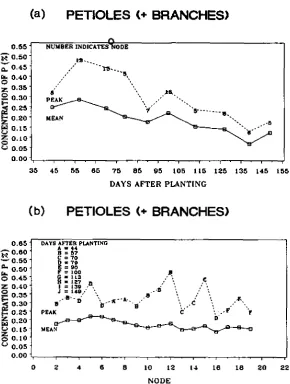
concentrations was variable but was associated with higher nodes early in the season and lower nodes late in the season. Peak P concentrations varied with
nodal origin of
petioles (+branches) (Fig. 7b) and were generally associated with earlier sampling dates. The statistical response surface (Fig. 8) indicates a tendency for higher mean concentrations to occur at mid-season and central nodal positions.Least significant differences and coefficients of variation for mean concentrations of petioles (+branches) are presented in Tables 4 and 5 for nodal sources of variance (LSD„ and CVn , respectively) and temporal sources of variance (LSO t and CVt , respectively) for N and P. Variance of N rose from low to higher levels between the V8 and R4 growth stages (days 44 to 90) and again between R5 and R8 (days 100 to 149) and generally decreased with higher nodal positions. Variance of P generally increased with later sampling dates and growth stages but was nearly unaffected by nodal position and was consistently higher than N variances.
Leaf Blades
(a)
LEAF BLADES
O Z 4.5 CD
H
4.0-1:4
NUMDEVNDICATES NODE
5 PEA
0 2.5 ca
2.0
35 45 55 85 75 85 95 105 115 125 135 145 155
DAYS AFTER PLANTING
(b)
LEAF BLADES
BRAGG SOYBEANS. IV 957
Fig. 9. Leaf blade N % with node or date of peak %.
5.00 4.00 3.00 2.00 1.00 0.00
149
114
DAY AFTER PLANTING
NODES 79
0 44
LEAF BLADES
% P
CONC
Fig. 10. Leaf blade N % response surface for node vs time.
Peak N concentrations at all nodal positions were usually associated with the first half of the growing season. The response surface (Fig. 10) shows a tendency for the highest leaf blade % N to occur at central nodal positions and at mid-season.
(c)
LEAF BLADES
DAYS AFTER PLANTING = 44 B 57 C = 70 D = 79 E = 90 F IOU G 113 H= 127 I =139
▪ 149 •
BRAGG 50YBEANS. IV 959
(a)
LEAF BLADES
0.9
0.8 o..
0.7
0.8
0.5 1:4
0.4
L.) 0.3
0.2
01
35 45 55 65 75 85 95 105 115 125 125 145 155 DAYS AFTER PLANTING
NODE
%P
CONC
0.375
0.300
•
to
• viz
af
t
A
P.'"
-
4#
41)atrZTZ,
,
-Will
h
11
1
1..
1
.n
-
4
k•.
4OP'
21
114
DAY AFTER PLANTING 0 44
0.225
0.150
0.075
0.000
NODES
149
LEAF BLADES
Fig. 12. Leaf blade P % response surface for node vs time.
after planting (R8), except for a pronounced peak on day 57 (V10). Peak P concentrations were from upper nodal positions early in the growing season and from lower nodal positions later in the growing season. Peak leaf blade concentrations (Fig. 11b) were highest at mid-canopy (0.78% at node 12) and were generally associated with early sampling dates for the particular node. The statistical response surface (Fig. 12) showed a tendency for highest mean P leaf blade concentrations at mid-season and central nodal positions.
Bk&GG SOYBEANS. IV 961
TABLE 6.--Nodal concentration (%) variance of leaf blades at selected sampling dates.
Days after planting
44
0.70
8.11
0.06
10.11
57
0.36
4.87
0.05
11.82
70
0.57
10.94
0.06
16.58
79
0.36
7.33
0.06
18.94
90
0.31
6.62
0.04
16.33
100
0.25
3.62
0.10
22.89
113
0.41
6.93
0.06
16.51
127
0.27
4.40
0.07
17.18
139
0.32
7.90
0.06
20.69
149
0.63
5.14
0.38
11.59
TABLE 7.--Temporal concentration (%) variance of leaf blades at each
nodal position.
Node
LSDt
N
CVt
LSD t
P
CV
t1
2
0.86
10.35
0.12
20.81
3
0.68
12.52
0.06
15.52
4
0.56
8.94
0.08
20.33
5
0.55
8.92
0.05
14.00
6
0.66
10.34
0.07
18.53
7
0.30
5.42
0.07
16.41
8
0.41
7.50
0.07
17.95
9
0.41
6.61
0.08
19.51
10
0.49
7.96
0.05
15.50
11
0.46
8.77
0.05
16.88
12
0.32
4.79
0.06
16.19
13
0.24
4.46
0.05
17.00
14
0.21
3.71
0.05
15.50
15
0.37
5.66
0.05
11.88
16
0.46
6.42
0.07
18.27
17
0.46
7.54
0.04
11.91
18
0.32
6.27
0.05
13.99
19
0.73
7.06
0.10
15.78
N P
6) but was somewhat erratic for P concentrations. Variance of P was two to three times greater than for V. Variance of N was somewhat lower for higher nodal positions (Table 7) but was erratic for P concentrations. Again P variances were two to three times greater for P than for N leaf blade concentrations.
Pods
z
DAYS AFTER PLANTING
A = 44
B = 57 C = 70
q = 79 E = 90 F = 100
C = 113
H =127 I = 139
J = 149
X5.0
z
4,5PEAK
Cm..) 4.0
MEAN 0 3.5
L) 3.0
0 2 4 6 8 10 12 14 16 16 20 22
7,5
Z 6.5
6.0 z 0 5.5
BRAGG SOYBEANS. IV 963
(a)
PODS
115 125 135 145 165
DAYS AFTER PLANTING
(b)
PODS
%N co N C
6.00 5.00 4.00 3.00 2.00 1.00 0.00
150 130
110
DAY AFTER PLANTING NODES
90
PODS
Fig. 14. Pod N % response surface for node vs time.
BRAGG SOYBEANS. IV 965
(a)
PODS
105 115 125 135 145
DAYS AFTER PLANTING
(b)
PODS
0.70 '
0. 0.65 '
0. 0.60 ' G.
0.55
-0 -0.5-0 '
g
0.45 ' Z 0.40 -crJ c ) o.ns 0 /..) 0.300.25 -I ,
0
DAYS AFTER PLANTING A = 44
• = 57 C = 70
II = 79 E 90 F 100
C = 113 H = 127
= 1.39 H. 1 = 149
2 4 6 8 10 12 14 16 la 20 22
0.300 0.225 0.150
150
o 100
PODS
Fig. 16. Pod P % response surface for node vs time.
145
105 115 125 135 155
0.55
SP
a. 0.50
c.
0 0.45 0
g 0.40
z 0.35
0
0.30 95
0.70
0 0.65 • 0-• 0.60
0 0.55
0 0.50
g
0,45▪ 0.40 c2.' 0.35 0 L) 0.30
0.25 -I
DAYS AFTER PLANTING A =44 • = 57 C = 79 79 E = 90 F 100 • = 113 = 127 = 139 3 = 149
PEAK 71-MEAN
BRAGG SOYBEANS. IV 965
(a)
PODS
DAYS AFTER PLANTING
(b)
PODS
O 2 4 6 8 10 12 14 16 18 20 22
NODE
150 130
140 120
DAY AFTER PLANTING
% P
CONC 0.450 0.375 0.300 0.225 0.150 0.075
21
14 NODES
110 0 100
PODS
Fig. 16. Pod P % response surface for node vs time.
Least significant differences and coefficients of variation for mean concentrations of pods are presented in Tables 8 and 9 for nodal sources of variance (LSDn and CVn, respectively) and temporal
BRAGG SOYBEANS. IV 967
TABLE 8.--Nodal concentration (I) variance of pods at selected sampling dates.
Days after planting
90 0.64 10.00
100 0.15 2.38 0.08 12.77
113 0.27 4.65 0.11 19.64
127 0.21 2.88 0.06 8.86
139 0.25 3.74 0.07 11.27
149 0.26 3.13 0.08 11.12
TABLE 9.--Temporal concentration (%) variance of pods at each nodal position.
Node LSDt CVt LSDt cvt
1
2 0.61 6.61 0.12 16.11
3 0.28 3.02 0.08 9.07
4 0.42 5.98 0.05 6.95
5 0.33 4.50 0.11 14.49
6 0.30 3.78 0.06 9.45
7 0.24 4.08 0.07 10.78
8 0.20 3.41 0.06 9.89
9 0.22 3.60 0.08 12.32
10 0.25 3.80 0.05 8.81
11 0.21 3.16 0.05 8.51
12 0.32 5.25 0.07 12.95
13 0.24 3.66 0.10 18.22
14 0.18 2.66 0.06 11.78
15 0.18 2.65 0.12 22.63
16 0.20 2.48 0.07 11.54
17 0.26 3.35 0.09 12.61
18 0.29 3.62 0.14 20.07
19 0.72 5.37 0.03 2.03
N
P
0 I I.- I na I n1
.-1 n1
Irs Vr1 CI %C.
• •
I P. 1r.-11,641M
0
.I
trtnalVal-IN01 W 41. c.101mri
... 0,4 I•0Nu1.-1N g-141.
00000000 00000000
:Itt:::
tv:vv
.... F. F.
NNINNNNN2
A
gAVAA
gRnr all
...
it 00000*
omstnim.. 0 .0 0
0mnomo Mirs ono0c4c4,0 0
Om ...
C4,1[41-1C4.
.i0.40c40m0
000000 00
••••••••
00000000
i1 it it it it it Wit
1010W1W-4,14
winnOke.111102i1h M4F0CO34:00M.0
cftennn.0011.14
Widn0141,11-11+0
01001m.-IN .04
.00.410,101-10 0000000c 00000000
0
wd LI ta 0I.
.-4 p b A. 111116'10101V.IWINN4. 0, .-1M41,...1n 0M+47
10M1r... 0d4 .0N
01mr4lelo11 0n 0141...Ammmr1
10.-inc40.No4 ...-....
0
4.7 cq 0c,10 .42000 00.-10010m0
0 1-1
0
MNZNOSNMN mamamaza ea ....
.-...-,
0 0 0 0
4.1
n
.0A 0 0 A00
.00 0 43 0
0 • I0 1:1
0 0 a a
411 0 44 g :fl
001414 0014k
r. 0011: g
OE
tt ::
.-100%.
,92
.0
ww
....0
.0
00
0 4.1 0 0 WI 13 13
00
140000.-1.4
..,00ow.A.-1
00 .-$..4...4A00 A0
00N
r4.-4.-$.0,0
BRAGG SOYBEANS. IV 969
CONCLUSIONS
The data presented here provide a comprehensive description of N and P distribution within the aerial portion of determinate soybean. The results summarize over 6,500 individual plant analyses and provide a nodally-segmented benchmark for comparative analysis of determinate soybean plant tissue. Variance of P concentration was routinely two to three times higher than for N for all plant parts. Concentrations of N and P generally
decreased with time for
stem internode, petioles
(+branches), and leaf blades, but increased with time for pods. Except for N concentration in stem internodes, which increases with internode number, the N and P concentrations remain nearly constant throughout the growing season. Linear regression was used to quantify temporal relationships between N and P concentrations in each plant part (Table 10). The elemental ratio was calculated by dividing the slope of the N concentration line by the slope of the P concentration line. The resulting ratios were dependent upon plant part with the highest ratios in pods and lowest in the petioles (+branches). The ratios of N to P in internodes and leaf blades were similar. The ratios across nodal position also varied with plant part. Due to their linearity N/P ratios were essentially identical for all sampling dates. These elemental concentration trends and the patterns of variances affecting them from both nodal and temporal sources, are worthy of note for the better interpretation of soybean nutrient analysis, for choice of sampling strategies, and for developing nodally segmented model descriptions of determinate soybean growth and nutrient uptake. Together with similar data reported previously for It, Ca, Mg, Fe, 2n, and Mn this information provides an insight to patterns of nutrient uptake, interaction and redistribution within the determinate soybean canopy during a growing season.ACKNOWLEDGEMENTS
the South Carolina Agricultural Experiment Station for providing land resources for this study.
REFERENCES
1. Mention of trademark, proprietary product, or vendor does not constitute a guarantee or warranty of the product by the USDA and does not imply its approval to the exclusion of other products or vendors that may also be suitable.
2. Anderson, L. R. and B. L. Vasilas. 1985. Effects of planting date on seasonal patterns of nitrogen assimilation end partitioning by two soybean cultivars. J. Plant Hutr. 8:657-677.
3. Batchelor, J. T., H. D. Scott, and R. E. Sojka. 1984. Influence of irrigation and growth stage on element concentrations of soybean plant parts. Comm. Soil Sci. Plant Anal. 15:1083-1109.
4. Boist, H. L., and L. E. Thatcher. 1931. Life history and composition of the soybean plant. Ohio Agric. Exp. Stn. Bull. 494.
5. Doty, C. V. and Parsons, J.E. 1979. Water requirements and water table variations for a controlled and reversible drainage system. Trans. ASAE 22:532-536, 539.
6. Egli, D. B., J. E. Leggett, and V. C. Duncan. 1978. Influence of N stress on leaf senescence and N redistribution in soybeans. Agron. J. 70:43-47.
7. Fehr, V. R., Caviness, C. R., Burmood, D. T., and Pennington, J. S. 1971. Stage of development descriptions for soybeans,
Olycine max (L.) Merrill. Crop Sci. 11:929-931.
8. Hanway, J. J., E. J. Dunphy, O. L. Loberg, and R. M. Shibles. 1984. Dry weights and chemical composition of soybean plant parts throughout the growing season. J. Plant Nutr. 7:1453-1475.
9. Runway, J. J., and C. R. Weber. 1971. N, P, and X percentages in soybean plant parts. Agron. J. 63:286-290. 10. Henderson, J. B.. and E. J. Kamprath. 1970. Nutrient and dry
matter accumulation by soybeans. North Carolina Agric. Exp. Stn. Bull. 197.
BRAGG SOYBEANS. IV
971
12.
Kollman, G. E., J. G. Streeter, D. L. Jeffers, and R. B.
Curry. 1974. Accumulation and distribution of mineral nutrients, carbohydrates, and dry matter in soybean plants as influenced by reproductive sink size. Agron. J. 66:549-554. 13. Ioberg, G. L., R. Shibles, D. E. Green, and J. J. Hannay. 1984. Nutrient mobilization and yield of soybean genotypes. J. Plant Nutr. 7:1311-1327.14. Mason, W. K., H. M. Taylor, A C. Reicosky, T. C. Kaspar, J. Jung, and R. L. Yang. 1980. water supply: Their effects relations and mineral uptake. SEA-NC-5, p. 1-59.
. T. P. Bennie, H. R. Rowse, D. A. Stone, A. A. Righes, Y.
S-Soybean row spacing and soil
on growth, development, water
Adv. Agric. Technol. USDA Publ.15. Ohlrogge, A. J. 1960. Mineral nutrition of soybeans. Advances in Agron. 12:229-263.
16. Sallam, A., H., D. Scott, D. V. Brewer, and R. E. Sojka. 1985. Characterization of potassium uptake and translocation in soybeans. Soil Sci. Soc. Am. J. 49:1226-1231.
17. Scott, H. D. and D. V. Brewer. 1980. Translocation of nutrients in soybeans. Soil Sci. Soc. Am. J. 44:566-569. 18. Scott, N. D., and D. W. Brewer. 1982. Characterization of
nutrient transport
coefficients in
field-grown soybeans. Soil Sci. Soc. Am. J. 46:998-1004.19. Scott, H. D., R. E. Sojka, D. L. Karlan, F. B. Arnold, V. L. Quisenberry, and C. W. Doty. 1983. Bragg soybeans grown on a southern coastal plain soil. I. Dry matter distribution, nodal growth analysis, and sample variability. J. Plant Nutr. 6:133-162.
20. Sojka, R. E., D. L. Karlen, and H. D. Scott. 1986. Bragg soybeans grown on a southern coastal plain soil. III. Seasonal changes in nodal Fe, Zn, and Mn concentrations. J. Plant Nutr. 9:1353-1390.
21. Sojka, R. E., H. D. Scott, and D. L. Karlen. 1985. Bragg soybeans grown on a southern coastal plain soil. II. Seasonal changes in nodal K, Ca, and Mg concentrations. J. Plant Nutt. 8:751-785.
22. Tachnicon Industrial Systems. 1977. Industrial method No. 334-74 We. Individual/simultaneous determination of N and/or P in BD acid digests. p. 1-17. Technicon Industrial Systems, Tarrytown, N.Y.
24. Vasilas, R. L., W. M. Walker, and G. E. Ham. 1984. Dry matter and primary nutrient accumulation in soybeans as affected by combined nitrogen levels. J. Plant. Nutr. 7:1731-1743.
25. Zeiher, C., D. B. Egli, J. E. Leggett, and D. A. Reicosky. 1982. Cultivar differences in N redistribution in soybeans.