Sensitivity Analysis of Multiple Control
Intervention Measures of Lassa fever Disease
Model
I. S. Onah1, R. A. Adewoye2, G. C. E. Mbah3
1
Department of Mathematics, University of Nigeria, Nsukka, Enugu State, Nigeria.
2
Department of Mathematics and Statistics, Rufus Giwa Polytechnic, Owo Ondo State, Nigeria.
3
Department of Mathematics, University of Nigeria, Nsukka, Enugu State, Nigeria.
Abstract: A mathematical model is formulated that incorporates the basic and important dynamics of Lassa fever disease transmission under the assumption of a homogeneously mixed population. We extended the model by introducing various control intervention measures, like external protection, isolation, treatment, and rodent control. The extended model called the multiple control intervention measure model, was analyzed and compared with the basic model by appropriate qualitative analysis and numerical simulation approach. We carried out sensitivity analysis of our multiple control model to investigate the impact of our parameters on the persistence or eradication of Lassa fever disease.
2010 Mathematics Subject Classification 37M05 65L07
Keywords: Lassa fever disease, basic reproduction number, stability analysis, sensitivity analysis.
I.INTRODUCTION
Infectious diseases like Malaria, HIV/AIDS, Cholera, Ebola, Zika virus, Chikungunya virus and Lassa fever are prevalent diseases in the 21st century in Africa. This is said to be true due to prevalence of unsafe water supply, poor sanitation, inadequate health facilities and poor hygiene [1, 2]. According to Center for Disease and Control (CDC) and World Health Organization (WHO) report Lassa fever yearly prevalence in west Africa is estimated at 100,000 to 300,000, with approximately 5,000 deaths. The prevalence of Lassa fever in most poor countries or developing countries could be reduced through measures like proper sanitation or cleanliness, provision of adequate health facilities, better hygiene practice and reducing breeding sites for rodents [3, 4]. The best means of ameliorating Lassa fever disease is use of control intervention measures such as external protection, quarantine, isolation, effective treatment of infected individuals and reduction of mastomys rats [5, 6, 7, 8, 9, 10, 11]. Sometimes, even when these control strategies are available, the ability to fund it becomes a vital issue, especially in developing countries where this disease is prevalent. This can be attributed to the fact that the spread of Lassa fever is related to poverty, lack of adequate health facilities, limited resources, uncleanliness and low economic status [46]. Optimal control theory can give insight into the best measure necessary to control the spread of Lassa fever with minimum cost [13, 14].
In trying to understand and discuss the dynamics of Lassa fever, there are some essential factors that must be taken into consideration, and amongst them are, sanitation, transmission medium, rodent control, effective treatment, quarantine, isolation, climatology factors or rainfall, effect of economic background
[5, 6, 7, 8, 9,
10, 11]
. It is a herculean task to understanding how the factors that influence Lassa fever disease are related so as to determine the dynamics of Lassa fever is challenging. In view of this, a variety of approaches has been used to model the dynamics of Lassa fever [15, 16, 17, 18, 19, 20, 21, 22]. However, from literature we have not seen a work that considered multiple transmission pathways and incorporating all the control measures in one model and carrying out an optimal control analysis on the multiple control intervention strategies. Our work tend to fill this long existed vacuum..II.LASSAFEVERDISEASEMODELWITHITSANALYSIS
A. Formulation of the Control free Model
In the formulation of this model, we considered the standard SIR model and we assumed a constant human and rodent population sizes 𝑁(𝑡) and 𝑍(𝑡). We partitioned the total human population 𝑁(𝑡) into classes like susceptible humans 𝑆(𝑡), infected humans 𝐼(𝑡) and recovered humans 𝑅(𝑡 which gives that, the total population of humans becomes 𝑁 𝑡 = 𝑆 𝑡 + 𝐼 𝑡 + 𝑅(𝑡) and the total rodent population 𝑍(𝑡). Partitioned as susceptible rodents 𝑃(𝑡) and infectious rodents 𝑄(𝑡) such that 𝑍 𝑡 = 𝑃 𝑡 + 𝑄(𝑡.. Humans are recruited into the susceptible class 𝑆(𝑡) by birth at a rate 𝜇. Susceptible humans 𝑆(𝑡) get infected with Lassa fever or enters the infected class through either contact with infected humans 𝐼(𝑡) or through contact with infectious rodents 𝑄(𝑡) at rate 𝛽 and 𝛼. Infected humans 𝐼(𝑡) recover at a rate 𝜌. We considered both direct human-to-human contact and human-to-rodent contact, because research has shown that Lassa fever transmission in most cases is as a result of contact between human and the mastomy-natalensis (rodent) and also between humans [21, 23]. Rodents on the other hand are recruited into the susceptible class by birth at a rate 𝜉. Susceptible rodents proceed to the infected class or become infected with the Lassa virus due to contact with another infected rodent
𝑄(𝑡) at a rate ∅ . Natural death in all human and rodent classes occurs at rate 𝜇 and 𝜉 respectively. Putting all these assumptions and descriptions together we obtain
𝑑𝑆
𝑑𝑡 = 𝜇𝑁 𝑡 − 𝛽𝑆 𝑡 𝐼 𝑡 − 𝛼𝑆 𝑡 𝑄 𝑡 − 𝜇𝑆(𝑡)
𝑑𝐼
𝑑𝑡= 𝛽𝑆 𝑡 𝐼 𝑡 + 𝛼𝑆 𝑡 𝑄 𝑡 − 𝜇 + 𝜌 𝐼(𝑡)
𝑑𝑅
𝑑𝑡 = 𝜌𝐼 𝑡 − 𝜇𝑅(𝑡)
𝑑𝑃
𝑑𝑡 = 𝜉𝑍 𝑡 − ∅𝑃 𝑡 𝑄 𝑡 − 𝜉𝑃(𝑡) 𝑑𝑄
𝑑𝑡 = −∅𝑃 𝑡 𝑄 𝑡 − 𝜉𝑄(𝑡)
where 𝛽 stands for the rate of interaction between susceptible humans 𝑆 and infectious humans 𝐼, 𝛼 is the rate of interaction between susceptible humans 𝑆 and infectious rodents 𝑄 and ∅ is the rate of interaction between susceptible rodents 𝑃 and infectious rodents 𝑄.
Our model (1) is in the form of the model considered by Abdullahi et al [27] that carried out sensitivity analysis of a Lassa fever deterministic mathematical model. There is no difference between the two models as they considered infections in human to be generated through both contact with infected humans and also infected rodents which we also considered. Our intention is to compare the same model with multiple control strategy model. Therefore the analysis of our model will help understand the dynamics of Lassa fever for the case of double transmission pathway on humans and also single transmission pathway on rodents as well as determine the optimal use of the multiple control strategy to reduce the spread of Lassa fever and reduction of the infectious rodents with minimum cost thus complementing the work of Abdullahi et al [27] who did not compare his model with any other model. We assume that all our chosen parameters are positive and the initial conditions of the variables are assumed as follows:
𝑆 0 > 0, 𝑃 0 > 0, 𝐼(0) ≥ 0, 𝑄(0) ≥ 0, 𝑅(0) ≥ 0.
All the solution of model (1) will enter the feasible region
𝛷 = 𝑆, 𝑃, 𝐼, 𝑄, 𝑅 ∈ ℝ+5: 𝑆 + 𝐼 + 𝑟 = 𝑁, 𝑃 + 𝑞 = 𝑍, 𝑆, 𝐼 ≤ 𝑁, 𝑅 ≤ 𝜌𝑁
𝜇 , 𝑃, 𝑄 ≤ 𝑍 .
By considering a continuously differentiable function 𝑉 𝑥 = 𝑉𝑎, 𝑉𝑏 = (𝑆 + 𝐼 + 𝑟, 𝑃 + 𝑞) and applying the
local invariant set theorem [24, 25], we have that the region 𝛷 is positively invariant. Thus model (1) is mathematically and epidemiologically well posed in the region 𝛷.
B. Basic Reproduction Number
The control-free model (1) has a unique disease-free equilibrium (DFE) given by
𝑆0, 𝐼0, 𝑅0, 𝑃0, 𝑄0 = (𝑁, 0, 0, 𝑍, 0)
We determined the basic reproduction number ℛ0 of our control free model (1) by the next generation matrix
method approach [26] and is given by
ℛ0= max{ℛℎ, ℛ𝑟},
1
2
3
4
where ℛℎ=𝜇+𝜌𝛽𝑁 is the reproduction number associated to humans and ℛ𝑟 =∅𝑍𝜉 is the reproduction number
associated to rodents.
C. Stability Analysis of the Disease-free Equilibrium
In describing the short term dynamics of Lassa fever disease, we investigated the stability about its disease-free equilibrium (DFE) [46]. In determining the short term dynamics of Lassa fever, it is important to investigate the stability of the DFE (Van Den Driessche and Watmough [26]).
Constructing the Jacobian matrix 𝐽0 of model (1) evaluated at the DFE (4), it agrees with the theorem below, as
Theorem 2.1: The DFE of the control-free model (1) is locally asymptotically stable if ℛ0< 1 and unstable if
ℛ0> 1.
From Theorem (2.1) above, it implies that Lassa fever disease can be eradicated from the entire population if
ℛ0< 1 and if the the initial size of the infected population is in the region of attraction of the DFE (4).
Alternatively the disease will persist in the population if ℛ0> 1. We need also to investigate the global stability
at DFE to show that eliminating the disease from the population is independent of the initial size of the infected population. In doing this, we will invoke the global stability result by Castillo-Chavez et al. [28]
.
Theorem 2.2: The DFE of the control-free model (1) is globally asymptotically stable if ℛ0< 1.
D. Stability Analysis of the Endemic Equilibrium
In a given dynamical system, to investigate the long-term dynamics, we study the endemic equilibrium point and analyse the stability around that point [24].
In relation to our model, this can be done by investigating the stability of model (1) at the endemic equilibrium (EE) so as to determine the dynamics of this system over a long period of time. When ℛ0> 1, a unique EE
occur in the model and is given by
𝑆𝑒, 𝐼𝑒, 𝑃𝑒, 𝑄𝑒 = 𝜇𝑁 𝛽𝐼𝑒+𝛼𝑄𝑒+𝜇,
−𝑏± 𝑏2−4𝑎𝑐
2𝑎 , 𝑍 ℛ𝑟,
𝜇
∅ ℛ𝑟− 1
Computing the jacobian of equation (1), we have
Theorem 2.3: The unique EE (6) is locally asymptotically stable whenever ℛℎ =𝑆𝑁𝑒 > 1 and ℛ𝑟 > 1. Suppose, ℛ0= 1, i.e, ℛℎ= ℛ𝑟 = 1, then from
𝑄𝑒 =𝜉(𝑍 − 𝑃𝑒)
∅𝑃𝑒 =
𝜉
∅(ℛ𝑟− 1)
𝑄𝑒= 0 and also we have
𝑏 = 𝜇 𝜇 + 𝜌 − 𝛽𝑁 = 0
which implies that when ℛℎ = ℛ𝑟 = 1 then 𝑄𝑒 = 𝐼𝑒 = 0. This means that when the threshold parameter i.e,
ℛ0= 1, Lassa fever can be eradicated from both the human population and also the rodent population.
Therefore, the interest will be to make ℛ0= 1, then we are sure to have a Lassa fever free population.
III. MULTIPLE CONTROL INTERVENTION STRATEGY MODEL
In this section, we intend to introduce some possivle control measures that will help in possibly eradicating Lassa fever disease. First we consider a way of reducing direct contact from human to human through contaminated medical equipment or through direct contact as a result of skin break [5, 6]. This is to say that Lassa fever can be transmitted even through sex, so we refer to any protection against exchange of body fluids as external protection. This protection can be in the form of use of condom or personal protection equipment (PPE) worn by medical practitioners. So we introduce a new class in our population, which is class of humans using external protection 𝐸(𝑡). So we assume that susceptible humans use condom or PPE at the rate 𝜏 with the efficiency of the condom or PPE given as 𝑒 and contact rate of infectious humans and susceptible humans using condom or PPE is also ∅ℎ1. Also, it is of a truth that for effective control of emerging and re-emerging diseases,
vaccination and isolation must be considered [8, 9, 10, 11]. In using it in models, we first investigate the availability of vaccine, if there exists vaccine for such infectious disease, then it is important to create a
6
vaccinated or an isolated class to enable one do a good study on its impact [11]. In our study, we describe isolation as the removal patients that have been detected to show clear sign of the infection so as not to infect other persons and for possible and effective treatment. When humans are isolated, one can regulate their treatment and ensure that there is minimal contact with other humans in the population. With this information, it comes to mind that isolation will be a good control measure in curbing the spread of Lassa fever. In doing this, we introduce isolation in our control-free model (1) with the assumption that infected humans are isolated at a rate 𝜎 (where 0 ≤ 𝜎 ≤ 1) and isolated humans recover at rate 𝜌𝑓. Most infectious diseases are highly reduced if
there is an effective treatment. Lassa fever shares similar symptoms with many other known viral hemorrhagic fevers, including that of Ebola virus, Dengue fever, malaria, and typhoid fever [33]. From literature it is seen that treatment of humans or patients infected with Lassa fever have been to a large extent been symptomatic and supportive; specific treatment has been attempted in a small number of patients to whom Lassa-immune plasma was administered, with equivocal success [7]. The antiviral drug that has been proven to be effective when administered at the early stage of the disease is Ribavirin [33]. Interestingly, infected human when they recover from illness they acquire permanent immunity (they are prone to the disease again in their life time). With this information, it comes to mind that effective treatment will be a good control strategy, hence it is important to investigate how to decrease the spread of Lassa fever by applying treatment as a control intervention strategy. In doing this, we introduce treatment in the control-free model (1) we assumed that infected humans are treated at rate 𝜂 (where 0 ≤ 𝜂 ≤ 1) and treated humans 𝑇(𝑡) recover at rate 𝜌𝑡. According to report from center for
disease control [35], Lassa fever is transmitted through contact between humans and infected rodents of the genus Mastomys known as rat, which is as a result of poor hygiene, poor sanitation and unhealthy human practices. Lassa fever cases can be reduced if there is a drastic reduction in the rat population, which also will lead to rare contact between human and rats through proper and regular sanitation and better hygiene practices. To determine the effects of rodent control as a control intervention strategy, we extend model (1) by assuming that the control rate of infected rodents as 𝑐. The multiple control intervention strategy, that is combining all the control intervention strategies earlier discussed. So, we introduce the control strategies into the model (1) simultaneously and obtain
𝑑𝑆
𝑑𝑡= 𝜇𝑁 𝑡 − 𝛽𝑆 𝑡 𝐼 𝑡 − 𝛼𝑆 𝑡 𝑄 𝑡 − (𝜇 + 𝜏)𝑆(𝑡) 𝑑𝐸
𝑑𝑡 = 𝜏𝑆 𝑡 − 1 − 𝑒 𝛽𝐸 𝑡 𝐼 𝑡 − 𝜇𝐸(𝑡) 𝑑𝐼
𝑑𝑡= 𝛽𝑆 𝑡 𝐼 𝑡 + 𝛼𝑆 𝑡 𝑄 𝑡 + 1 − 𝑒 𝛽𝐸 𝑡 𝐼 𝑡 − 𝜇 + 𝜌 + 𝜂 + 𝜎 𝐼(𝑡)
𝑑𝐹
𝑑𝑡 = 𝜎𝐼 𝑡 − 𝜇 + 𝛿 + 𝜌𝑓+ 𝜈 𝐹(𝑡)
𝑑𝑇
𝑑𝑡 = 𝜂𝐼 𝑡 + 𝜈𝐹 𝑡 − 𝜇 + 𝜌𝑡 𝑇(𝑡) 𝑑𝑅
𝑑𝑡 = 𝜌𝐼 𝑡 + 𝜌𝑡𝑇 𝑡 + 𝜌𝑓𝐹(𝑡) − 𝜇𝑅(𝑡)
𝑑𝑃
𝑑𝑡 = 𝜉𝑍 𝑡 − ∅(1 − 𝑐)𝑃 𝑡 𝑄 𝑡 − 𝜉𝑃(𝑡) 𝑑𝑄
𝑑𝑡 = −∅(1 − 𝑐)𝑃 𝑡 𝑄 𝑡 − 𝜉𝑄(𝑡)
All the solutions of model (7) enter the feasible region
𝛷𝑚= {(𝑆, 𝐸, 𝐼, 𝑇, 𝐹, 𝑅, 𝑃, 𝑄) ∈ ℝ+8: 𝑆 ≤ 𝑆0, 𝐸 ≤ 𝐸0, 𝐼 ≤ 𝑁, 𝑇 ≤ 𝑇0, 𝐹 ≤ 𝐹0, 𝑅 ≤ 𝑅0, 𝑃 ≤ 𝑃0, 𝑄 ≤ 𝑍}
where𝑁 = 𝑆 + 𝐸 + 𝐼 + 𝐹 + 𝑇 + 𝑅, 𝑍 = 𝑃 + 𝑄, 𝑇0=𝜇+𝜌𝜂𝑁 𝑡, 𝐹
0= 𝜎𝑁
𝜇+𝛿+𝜌𝑓+𝜈 , and 𝑅 0=𝜌𝑁
𝜇 + 𝜂𝑁
𝜇 (𝜇+𝜌𝑡) . The
region
𝛷
𝑚 is positively invariant, and by this we can proceed in determining the solution of model (7) in𝛷
𝑚.A. Analysis of the Multiple Control Intervention Strategy Model
The DFE of the multiple control intervention measure model (7) is given as
𝑆𝑚0, 𝐸,𝑚0 , 𝐼𝑚0, 𝐹𝑚0, 𝑃𝑚0, 𝑄𝑚0 =
𝜇𝑁 𝜇 + 𝜏,
𝜏𝑁
𝜇 + 𝜏, 0, 0, 𝑍, 0
7
8
The basic reproduction number is defined as the expected number of secondary infections that result from introducing a single infected individual into an otherwise susceptible population. The basic reproduction number is also defined as the spectral radius (dominant eigenvalue) of the matrix 𝐹𝑉−1, that is
ℛ0𝑚= max
𝛽𝑆𝑚0+ 1−𝑒 𝛽 𝐸𝑚0
𝜇+𝜌+𝜎+𝜂 , ∅ 1−𝑐 𝑍
𝜉
The threshold quantity ℛ0𝑚 represents the number of secondary infections that results from introducing a single
infected individual into an otherwise susceptible population in the presence of external protection, quarantine, isolation, treatment and rodent control. From equation (10), we have that
𝑒, 𝑐, 𝜎, 𝜂 < 1⇔ℛ0𝑚 < ℛ0
To determine the short-term dynamics of Lassa fever in the presence of the multiple control intervention strategy, we investigate the stability of the multiple control intervention strategy model at the DFE.
Theorem 3.1: If ℛ0𝑚< 1, the DFE (9) of model (7) is globally asymptotically stable and unstable if ℛ0𝑚 > 1.
The epidemiological implication or meaning of this is that Lassa fever will be eradicated from the entire population using the multiple control intervention strategy whenever ℛ0𝑚 < 1.
IV. SENSITIVITY ANALYSIS OF THE MULTIPLE CONTROL STRATEGY MODEL
In this section, we carried out sensitivity analysis of the different control parameters, to identify which is more sensitive to the other. To enable us advice policy makers wisely on the most sensitive parameter in trying to eradicate Lassa fever in the population. We tend to do this by carrying out graphical simulations of these parameters, using published date as given in the table below
I. TABLEI
PARAMETERVALUESUSEDFORNUMERICALSIMULATIONS
Parameters Parameter values Source
𝜇 0.0000457 [19]
𝛽 0.00002 [20]
𝛼 0.00001 [20]
𝜌 0.0476 [14]
𝜉 0.2 [19]
∅ 0.002 [16]
𝜏 0.07 [18]
𝑒 0.85 [47]
𝜂 0.005 [16]
𝜎 0.057 [19]
𝛿 0.333 [20]
𝜌𝑓 0.0376 [14]
𝜈 0.03 [20]
𝜌𝑡 0.1184 [47]
𝑐 0.667 [19]
10
Figure 1: Graphical illustration of the sensitivity of the control parameters on the multiple control model (7): (a)
𝜏 = 0.037, 0.067, 𝑎𝑛𝑑 0.097 (b) 𝑒 = 0.3, 0.6, 𝑎𝑛𝑑 0.9
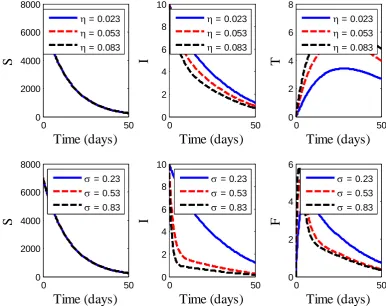
Figure 2: Graphical illustration of the sensitivity of the control parameters on the multiple control model (7): (a)
𝜂 = 0023, 0.053, 𝑎𝑛𝑑 0.083 (b) 𝜎 = 0.23, 0.53, 𝑎𝑛𝑑 0.83
0 50 0 2000 4000 6000 8000 Time (days)
S
= 0.037
= 0.067
= 0.097
0 50 2000 4000 6000 8000 10000 Time (days)
E
= 0.037
= 0.067
= 0.097
0 50 0 2 4 6 8 10 Time (days)
I
= 0.037
= 0.067
= 0.097
0 50 0 2000 4000 6000 8000 Time (days)
S
e = 0.3 e = 0.6 e = 0.9
0 50 2000 4000 6000 8000 10000 Time (days)
E
e = 0.3 e = 0.6 e = 0.9
0 50 0 2 4 6 8 10 Time (days)
I
e = 0.3 e = 0.6 e = 0.9
0 50 0 2000 4000 6000 8000
Time (days)
S
= 0.023 = 0.053 = 0.083
0 50 0 2 4 6 8 10
Time (days)
I
= 0.023 = 0.053 = 0.083
0 50 0 2 4 6 8
Time (days)
T
= 0.023 = 0.053 = 0.083
0 50 0 2000 4000 6000 8000
Time (days)
S
= 0.23 = 0.53 = 0.83
0 50 0 2 4 6 8 10
Time (days)
I
= 0.23 = 0.53 = 0.83
0 50 0 2 4 6
Time (days)
F
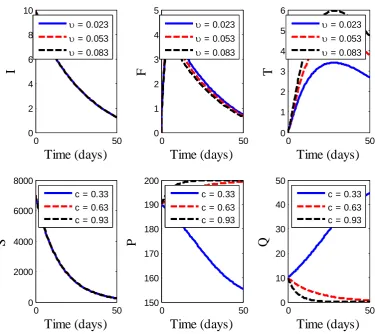
Figure 3: Graphical illustration of the sensitivity of the control parameters on the multiple control model (7): (a)
𝜈 = 0023, 0.053, 𝑎𝑛𝑑 0.083 (b) 𝑐 = 0.33, 0.63, 𝑎𝑛𝑑 0.93
From Figures (1), (2), and (3), we illustrate the sensitivity (impact) of the control parameters. In verifying this, we plot the graph of the control model for various values of the control parameters (𝜏, 𝑒, 𝜂, 𝜎, 𝜈, and 𝑐) while others are fixed. From these figures, we discover that these control parameters (𝜏, 𝑒, 𝜂, 𝜎, 𝜈, and 𝑐) have significant impact in reducing the spread of Lassa fever when they are introduced into the system. For instance, in Figure 1(a), we can see that increase in 𝜏 reduces the humans susceptible to Lassa fever, increases the humans using external protection against Lassa fever and also reduces humans infected with Lassa fever. Also in figure 1(b), we also see that increase in 𝑒 reduces susceptible humans, increases humans using external protection and reduces infected/infectious humans, which is our required target to reduce humans infected by Lassa fever. Next, in Figure 2(a), increase in η keeps the susceptible humans stable, reduces infected humans and increases the treated humans who were infected by Lassa fever. Also, we see that increase in 𝜎 keeps stable the susceptible humans, reduces infected humans and increases the isolated humans, implying that isolation is a good control strategy for Lassa fever. On the other hand, we can see that increase in ν reduces the infected humans, reduces the isolated humans, and increases the isolated humans who have gone for treatment, which means that isolation can help in reducing infectious humans, and thereby making treatment effective. Also, and lastly, we can also see that increase in 𝑐 stabilises the susceptible humans, increases susceptible rodents, but drastically reduces the infected rodents. Which means that reducing the rodents, can be a good control strategy in controlling the spread of Lassa fever in any population.
Furthermore, let us investigate the impact of varying these parameters over a longer period of time, and hence find out which parameter is more sensitive that the others. This can be seen from the graphical illustrations below
0 50
0 2 4 6 8 10
Time (days)
I
= 0.023 = 0.053 = 0.083
0 50
0 1 2 3 4 5
Time (days)
F
= 0.023 = 0.053 = 0.083
0 50
0 1 2 3 4 5 6
Time (days)
T
= 0.023 = 0.053 = 0.083
0 50
0 2000 4000 6000 8000
Time (days)
S
c = 0.33 c = 0.63 c = 0.93
0 50
150 160 170 180 190 200
Time (days)
P
c = 0.33 c = 0.63 c = 0.93
0 50
0 10 20 30 40 50
Time (days)
Q
Figure 4: Graphical illustration of the sensitivity of the control parameters on the multiple control model (7): (a)
𝜏 = 0.037, 0.067, 𝑎𝑛𝑑 0.097 (b) 𝑒 = 0.3, 0.6, 𝑎𝑛𝑑 0.9 over a longer period of time.
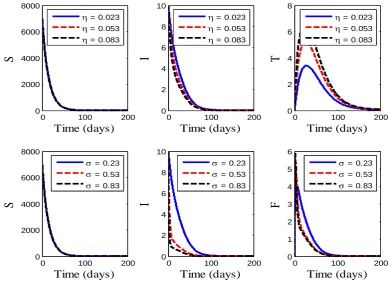
Figure 5: Graphical illustration of the sensitivity of the control parameters on the multiple control model (7): (a)
𝜂 = 0023, 0.053, 𝑎𝑛𝑑 0.083 (b) 𝜎 = 0.23, 0.53, 𝑎𝑛𝑑 0.83 over a longer period of time. 0 100 200
0 2000 4000 6000 8000
Time (days)
S
= 0.037
= 0.067
= 0.097
0 100 200 2000 4000 6000 8000 10000
Time (days)
E
= 0.037
= 0.067
= 0.097
0 100 200 0 2 4 6 8 10
Time (days)
I
= 0.037
= 0.067
= 0.097
0 100 200 0 2000 4000 6000 8000
Time (days)
S
e = 0.3 e = 0.6 e = 0.9
0 100 200 2000 4000 6000 8000 10000
Time (days)
E
e = 0.3 e = 0.6 e = 0.9
0 100 200 0 2 4 6 8 10
Time (days)
I
e = 0.3 e = 0.6 e = 0.9
0 100 200
0 2000 4000 6000 8000 Time (days)
S
= 0.023
= 0.053
= 0.083
0 100 200
0 2 4 6 8 10 Time (days)
I
= 0.023
= 0.053
= 0.083
0 100 200
0 2 4 6 8 Time (days)
T
= 0.023
= 0.053
= 0.083
0 100 200
0 2000 4000 6000 8000 Time (days)
S
= 0.23
= 0.53
= 0.83
0 100 200
0 2 4 6 8 10 Time (days)
I
= 0.23
= 0.53
= 0.83
0 100 200
0 1 2 3 4 5 6 Time (days)
F
= 0.23
= 0.53
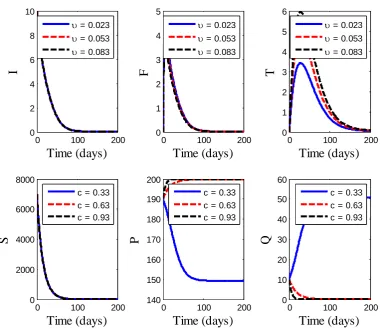
Figure 6: Graphical illustration of the sensitivity of the control parameters on the multiple control model (7): (a)
𝜈 = 0023, 0.053, 𝑎𝑛𝑑 0.083 (b) 𝑐 = 0.33, 0.63, 𝑎𝑛𝑑 0.93 over a longer period of time.
From Figures (4), (5) and (6) when we considered the sensitivity analysis of the different control parameters on the multiple control model (7). We discovered that for a longer period, that the most sensitive parameter is 𝜎 followed by 𝜏 and η. Meaning that by concentrating more on these parameters, Lassa fever can be completely eradicated from the human population. We also observed that for a longer period, the infected rodents can be wiped out of the population, unlike when it was for a shorter period. Meaning, that for rodents to be completely wiped out of the population, using only the control parameter 𝑐, we have to do it for a longer period of time.
V. DISCUSSION
We explored the control intervention measures of the dynamics of Lassa fever in a population of humans and rats that are homogeneous mixed together. Vital information about the Lassa fever dynamics was shown from our analysis, and that choosing an appropriate mathematical epidemiological model will play an important role in giving all possible information on the general dynamics of the disease.
We have been able to show that when there is no proper control intervention measures, that it is still possible for Lassa fever to be eradicated from the entire population, if we can reduce the basic reproduction number ℛ0 to a
value that is less than unity. This can happen if the infected humans begin exhibit healthy living practices, which include keeping off from areas infected by rats, or areas close to waste bin and by keeping their environment clean and tidy, reducing any practice that will attract rats in their places of abode.
We focused on analysing the multiple control model since it is evident from our analyses that it is the best method when compared with the single control and even the control-free models. Firstly, we investigated the effects of control parameters 𝜏, 𝑒, 𝜂, 𝜎, 𝜈, and 𝑐 in decreasing the number of secondary infections in the presence of the multiple control intervention strategy by carrying out sensitivity analysis. The results of the analyses revealed that each of the control parameters decreases the number of secondary infections in the
0 100 200
0 2 4 6 8 10
Time (days)
I
= 0.023 = 0.053 = 0.083
0 100 200
0 1 2 3 4 5
Time (days)
F
= 0.023 = 0.053 = 0.083
0 100 200
0 1 2 3 4 5 6
Time (days)
T
= 0.023 = 0.053 = 0.083
0 100 200
0 2000 4000 6000 8000
Time (days)
S
c = 0.33 c = 0.63 c = 0.93
0 100 200
140 150 160 170 180 190 200
Time (days)
P
c = 0.33 c = 0.63 c = 0.93
0 100 200
0 10 20 30 40 50 60
Time (days)
Q
presence of the multiple control intervention strategy. Furthermore, we discovered that isolation takes the position of been the best control parameter, coming after is the external protection rate, rate of treatment, efficacy rate of external protection, rate at which isolated humans are treated and then rate of control of rodents. The dynamical behavior of our models agrees with the intuitive expectation of Lassa fever dynamics in real life. Thus, the models can be used to predict future evolution of Lassa fever in communities where the disease is endemic. It can also be used to study how to control Lassa fever with minimum cost using control intervention techniques like external protection, isolation, treatment and rodent control.
This study having provided new insights into the dynamics and control intervention strategies for infectious diseases in a homogeneous mixed population setting, but it is important to note that it is not without some evident limitations. Firstly, in our assumption, we studied an assumed constant population. But we know, that this case is not necessarily true, because in real life there are always births and deaths which are not necessarily equal especially also with outbreaks that last for a long period of time. We also assumed homogeneity in disease transmission, but it is not always true since heterogeneity is an essential part of epidemiology and has been shown to have influence on disease transmission [45, 46].
REFERENCES
[1] M.L. Cohen, Changing patterns of infectious disease}, Nature, 406 (2000), 6797, 762.
[2] W.H. Fleming, and R.W. Rishel, Deterministic and stochastic optimal control}, Bulletin of the American Mathematical Society, 82(1976), 869-870.
[3] World Health Organisation (2018) (November, 2018).
[4] World Health Organisation (WHO) (November, 2018).
[5] R.A. Kenlyside, J.B. Mccormic, P.A. Webb, E. Smith, L. Elliot, K.L. Johnson, Case control study of mastomys natalensis and humans in Lassa virus-infected households in Sierra Lone}, Am. Trop. Med. Hyg. 32(1983), 829-37.
[6] M. Bawa, S. Abdulraham, and O.R. Jimoh, Stability Analysis of the Disease-free Equilibrium State of Lassa Fever Disease} Int. J. of
Sci. and Math. Edu, 9(2)(2013), 115-123.
[7] A.J. Clayton, Lassa immune serum, Bull. W.H.O. 55(1977), 435-439.
[8] O. Diekmann, H. Heesterbeek, and T. Britton, Mathematical tools for understanding infectious disease dynamics, Princeton Uni.
Press 7(2012).
[9] I.M. Longini Jr, E. Ackerman, and L.R. Elveback, An optimization model for influenza A epidemics, Math. Biosci., 38(1 -2)(1978),
141-157.
[10] M. Kretzschmar, Ring Vaccination and Smallpox Control Emerging Infectious Diseases, 10(5)(2004), 832-841.
[11] H.S. Rodrigues, M.T.T. Monteiro, and D.F. Torres, Vaccination models and optimal control strategies to dengue, Math. Biosci., 247(2014), 1-12.
[12] S. Lenhart, qnd J.T. Workman, Optimal control applied to biological models, Chapman and Hall/CRC, (2007).
[13] R.L. Miller Neilan, E. Schaefer, H. Gaff, K. Renee Fisher, and S. Lenhart, Modeling optimal intervention strategies for cholera, Bull.
Math. Biol. 72(2010), 2004-2018.
[14] D. Omale, T.E. Edibo, Mathematical Models for Lassa Fever Transmission with Control Strategies, Computing Information Systems,
Development Informatics and Allied Research J. 6(2017), (4).
[15] M. Bawa, S. Abdulraham, and O.R. Jimoh, Stability Analysis of the Disease-free Equilibrium State of Lassa Fever Disease, Int. J. of
Sci. and Math. Edu., 9(2)(2013), 115-123.
[16] R. Okuonghae and D.A. Okuonghae, Mathematical model for Lassa fever, Journal of the Nigeria Association of Mathematical
Physics, 10(2006), 457-464.
[17] M.O. Onuorah, M.S.S. Ojo, D.J. Usman, A. Ademu, Basic Reproduction Number for the Spread and Control of Lassa fever, Int. J. of
Math. Trends and Tech., 30(1)(2016), 1-7.
[18] O.S. Obabiyi, and A.A. Onifade, Mathematical model for lassa fever transmission dynamics with variable human and reservoir
population, Int. J. of Differential Equations and Appl., 16(1)(2017).
[19] M.B. Abdullahi, U.C. Doko, and M. Mamuda, Sensitivity analysis in a Lassa fever deterministic mathematical model, In AIP
Conference Proceedings 1660(1)(2015), 050050. AIP Publishing.
[20] B.I. Eraikhuemen, and O. Eguasa, Lassa fever and its Control Measures, J. of Natural Sc. Research, 7(12)(2017).
[21] T.S. Faniran, A Mathematical Modelling of Lassa Fever Dynamics with Non-drug Compliance Rate, Int J. Math. Trends Technol,
47(5)(2017), 305-317.
[22] I.B. Sule, I.B. Wada, A.A. Abubakar, A.H. Adamu, H.S. Fagge, Y. Mohammed, and P. Nguku, Outbreak of a Highly Virulent Lassa
Fever Virus in Kano State, Nigeria: An Investigation Report 2015-2016.
[23] X. Liao, L.Q. Wang, and P. Yu, Stability of dynamical systems 5(2007), Elsevier.
[24] R. Reiszig, J. LaSalle and S. Lefschetz, Stability by Liapunov's Direct Method with Applications, VII+ 134 S. New York/London
1961. Academic Press. Preis geb. \$5.50. ZAMM-Journal of Applied Mathematics and Mechanics/Zeitschrift für Angewandte
Mathematik und Mechanik, 42(10-11)(1962), 514-514.
[25] P. Van den Driessche, and J. Watmough, Reproduction numbers and sub-threshold endemic equilibria for compartmental models of
disease transmission}, Math. Biosci., 180(1-2)(2002), 29-48.
[26] M.B. Abdullahi, U.C. Doko, and M. Mamuda, Sensitivity analysis in a Lassa fever deterministic mathematical model, In AIP
Conference Proceedings 1660(1)(2015), 050050. AIP Publishing.
[27] C. Castillo-Chavez, S. Blower, P. van den Driessche, D. Kirschner, and A.A. Yakubu, Mathematical approaches for emerging and
reemerging infectious diseases: an introduction, 1(2002), Springer Science and Business Media.
[28] J.H. Tien and D.J. Earn, "Multiple Transmission pathways and disease dynamics in a waterborne pathogen model", Bulletin of Math.
Biol., 72(6)(2010), 1506-1533.
[29] O.C. Collins, and K.J. Duffy, Analysis and Optimal Control Intervention Strategies of a Waterborne Disease Model: A Realistic Case
[30] J. Ma and D.J.D. Earn, Generality of the final size formula for an epidemic of a newly invading infectious disease, Bull. Math. Biol. 68(2006), 679-702.
[31] J.M. Tchuenche, S.A. Khamis, F.B. Agusto, and S.C. Mpeshe, Optimal control and sensitivity analysis of an influenza model with
treatment and vaccination, Acta biotheoretica, 59(1)(2011), 1-28.
[32] P.B. Jahrling, R.A. Hesse, G.A. Eddy, K.M. Johnson, R.T. Callis, and E.L. Stephen, Lassa virus infection of rhesus monkeys: pathogenesis and treatment with ribavirin, J. of Infectious Diseases, 141(5)(1980), 580-589.
[33] T.P. Monath, Lassa fever and Marburg virus disease, (1974).
[34] CDC, Imported Lassa fever, New Jersey, Centres for disease control and prevention 2004, MMWR Morb Mortal WKly Rep 2004,
53(38)(2004), 894-897.
[35] O.C. Collins, and K.S. Govinder, Stability analysis and optimal vaccination of a waterborne disease model with multiple water sources, Natural Resource Modeling, 29(3)(2016), 426-447.
[36] G. Zaman, Y.H. Kang, and I.H. Jung, Stability analysis and optimal vaccination of an SIR epidemic model, BioSystems, 93(3)(2008),
240-249.
[37] T.K. Kar and A. Batabyal, Stability analysis and optimal control of an SIR epidemic model with vaccination, Biosystems, 104(2-3)(2011), 127-135.
[38] K.W. Blayneh, A.B. Gumel, S. Lenhart, and T. Clayton, Backward bifurcation and optimal control in transmission dynamics of West
Nile virus, Bull. of Math. Biol., 72(4)(2010), 1006-1028.
[39] F.B. Agusto, Optimal chemoprophylaxis and treatment control strategies of a tuberculosis transmission model, World J. Model
Simul, 5(3)(2009), 163-173.
[40] H.R. Joshi, Optimal control of an HIV immunology model, Optimal control applications and methods, 23(4)(2002), 199-213.
[41] O.C. Collins, and K.J. Duffy, Optimal control of maize foliar diseases using the plants population dynamics, Acta Agriculturae Scandinavica, Section B—Soil and Plant Science, 66(1)(2016), 20-26.
[42] W.H. Fleming, and R.W. Rishel, Deterministic and stochastic optimal control, Bull. of the American Math. Society, 82(1976),
869-870.
[43] L.S. Pontryagin, V.G. Boltyanskii, R.V. Gamkrelidze, and E.F. Mishchenko [1961], Math. Theory of Optimal Processes {in
Russian}.
[44] S.L. Robertson, M.C. Elsenberg and J.H. Tien, Heterogeneity in multiple transmission pathways: modeling the spread of cholera and
other waterborne disease in networks with a common water source, J. Biol. Dynam 7(2013), 254-275.
[45] O.C. Collins, and K.S. Govinder, Stability analysis and optimal vaccination of a waterborne disease model with multiple water sources, Natural Resource Modeling, 29(3)(2016), 426-447.
[46] S. M. Garba, and A. B. Gumel, Mathematical recipe for HIV elimination in Nigeria, Journal of the Nigerian Mathematical Society,