Research Journal
Volume 9, No. 28, Dec. 2015, pages 153–159
DOI: 10.12913/22998624/60806
Research ArticleReceived: 2015.10.13 Accepted: 2015.11.14 Published: 2015.12.04
VISUAL ANALYSIS OF HEAT TRANSPORT IN A UNIQUE OBJECT
Arkadiusz Urzędowski1, Dorota Wójcicka-Migasiuk1
1 Fundamentals of Technology Faculty, Lublin University of Technology, Nadbystrzycka 38, 20-618 Lublin,
Poland, e-mail: [email protected]; [email protected]
ABSTRACT
The paper presents a visual analysis of heat propagation in selected elements of a unique building structure. Numerous spots of construction deterioration and weaken-ing are exemplary to the presented method and to the procedure of concludweaken-ing for the purpose of combined research and education at the third academic level of edu-cation. The described procedures use a thermographic camera. The most attention has been put to thermal bridges to avoid energy loss in further modernization of the investigated object and how the conclusion process can be supported. The discussion is based on four parallel types of camera imaging: thermal, multispectral, thermal fu-sion and digital. The selected important aspects of measurement conditions have been discussed to justify the reliability of presented measurements.
Keywords: heat transport, thermographic camera, visual methods.
INTRODUCTION
Visualization methods in research can be ap-plied not only to the result presentations but they can form an intermediate stage during the research process itself if they are used with the awareness of properties and possibilities. Image analyses can help in proper procedure selection and to ease the comparative analysis. The relevant equipment and, nowadays obviously together with, appropri-ate software help the visualization to be a must among heat transfer research methods [1, 2].
The presented measurements take advantage of heat propagation obstacles in four selected available techniques: thermal vision, multispec-tral imaging, thermal fusion and digital image. The examples use interior and exterior images to present the opposite conclusion processes.
The mentioned techniques can be generally described as follows:
• Thermal vision – full thermal spectra of actu-ally measured values are allocated to appropri-ate scale of colors and the image shows colors relevant to directly measured temperatures. • Multispectral imaging – involves different but
selected spectra of thermal radiation and
vi-sual light combined in one geometrically uni-form object but the spectra can be sifted one
from another. This enables to detect the influ -ence of geometry into the thermal behavior. But the researcher has to decide which thermal spectra are of minor importance.
Thermal fusion allows to remove the se-lected regions of thermal measurements and replace them by digital images. The selection is performed by means of color scale alloca-tion in a limited range in comparison to the full thermal vision.
Digital images do not show any thermal mea-surement values but can point out selected spots and regions related to the ones marked in thermal images. They provide optical clarity of the inves-tigated area.
METHODS AND RESULTS
All image versions presented in figures are
of appropriate measurement conditions result-ing from surface properties is very important to obtain correct results in thermal imaging. Such
surface properties as reflectance, smoothness,
transparency and emissivity are the most impor-tant as they can increase image attractiveness and at the same case can blunt measurement reliabil-ity. The following should be avoided while taking
such measurements: reflections of a camera itself (and its users), reflections of light from smooth or
glossy surfaces and, which is very substantial to the process – transparent obstacles – glass surfac-es, in particular, are to be measured with precise knowledge of measurement conditions [7].
Building interior measurements
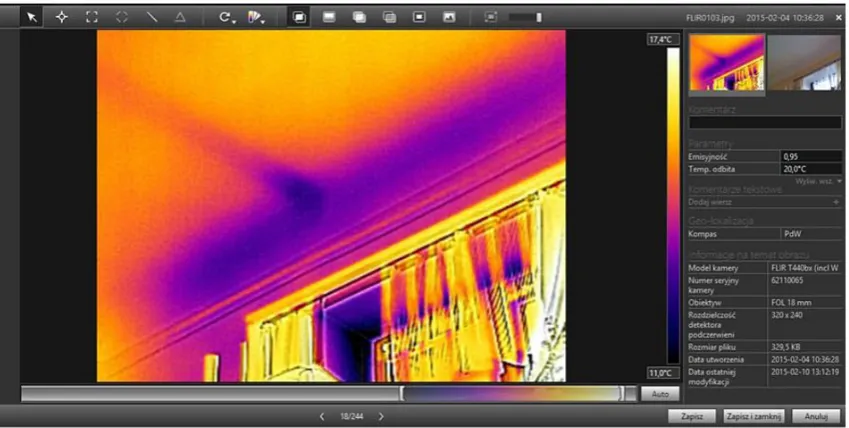
The example presented in Figure 1 shows the selected part of a building interior. The
col-ors reflecting measurements are allocated in natural coincidence with heat flux propagation
direction, i.e.: from blue at lowest temperature values to red at the highest ones. This method is usually recommended if the measurements are taken for the purpose to persuade the observer to prevent from heat losses. The assumed surface emissivity has been established at 0.95, which is appropriate for a painted wall and the tem-perature distribution is properly recognized by the camera. The only source of misunderstand-ing can occur for the observer lookmisunderstand-ing at a cur-tain, partially shading the surface behind. This
figure additionally presents the software screen
features enabling some extra read outs from the device. The measurement distance is 3 m, room
ambient air temperature 20 °C and air relative humidity is 50%. It is also possible to compare with the report given in Figure 5. The particular recommendation for this procedure is to reduce the distance and this could help to increase the measurement precision and avoid curtains in this distance. Concluding from this image, the mini-mal temperature is about 11 °C, which is likely to result from a gap in layers in consequence of
the combined influence of worn – weak internal
construction and poor thermal insulation outside the wall. The adjacent digital view on the dis-cussed element does not show the presumed gap
which confirms the reliability of presented mea
-surements as visible gaps could give light reflec -tions and even lower the clarity of measurements by thermal vision methods [2, 4].
Another detail that can be analyzed in this fig -ure is a darker band of about 14 °C. This tempera-ture is lower of about 4 C deg. than in the most of the presented ceiling area. This is a typical ther-mal bridge, resulting from improper wall struc-ture. In the contrary, the upper left window corner does not show any weakness in a wall structure but poor window frame air-tightness.
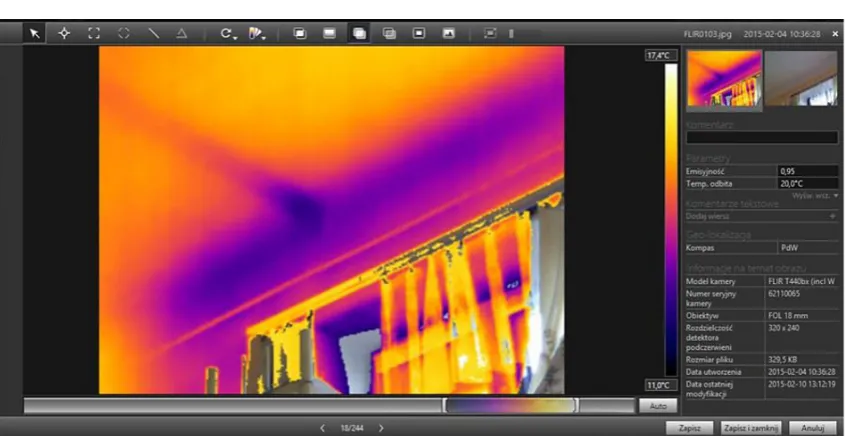
Moreover the perpendicular dark line is the most probably the result of improper scaffolding support during previous modernizations of this part of the building dated almost 100 years now. This multispectral image gives us more details than a typical thermal-vision image (compare Figure 2). This detail is a brighter lines over the
window: the first one is definitely the curtain rod (reflecting the light from its shiny surface but not
the temperature), the second one (of higher
perature) is probably an electric cable in its tube cover [6]. The additional horizontal line appears because the multispectral thermal image is shifted from the digital one. This is the most reliable in-terpretation as no system documentation is avail-able. The vertical bright element is supposed to be a part of air bleeding pipeline in their space heating system.
Typical errors in imaging, but unavoidable here, are visible on the window glass panels. The
bright colors are not reliably reflecting the glass panel temperature but the light reflected from a part
of blinds and the curtain falling in folds. This is important to know during such measurements. The blinds are visible behind this curtain not because it is transparent material but because it is not folded and the vision comes out through the lace fabric.
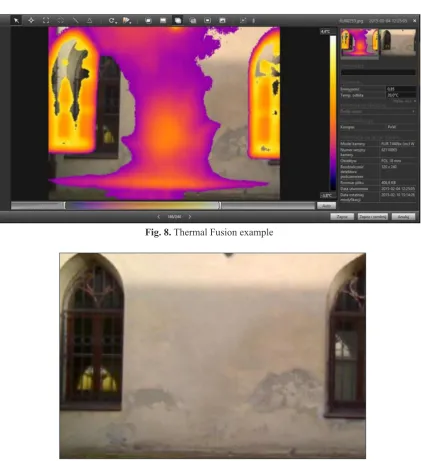
The additional image is presented in Figure 3 in the form of thermal fusion, however, in this case it brings no additional information (in con-trary to the exterior images in Figure 6) it is op-tically more distinctive. The fusion is composed of thermal and digital images. The only digital image of this selected area is presented for com-parisons in Figure 4. Shades on the surface in-form us of improper conditions in the area where they occur but the real information is delivered in this case from Figure 1.
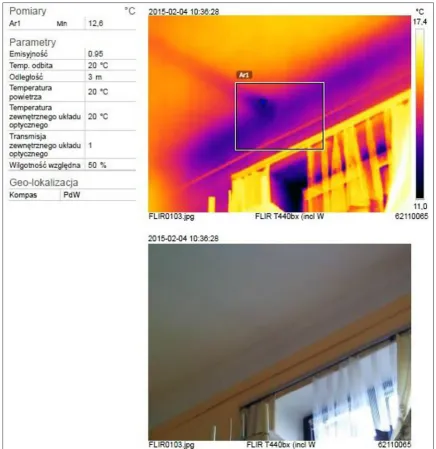
If one considers the method in aspects of didactics, it is important to use additional visu-alization convenient for evaluations. These can be performed on the basis of report forms. The example is presented in Figure 5. From the view of evaluators, it is important that, beside images,
Fig. 2. Thermal-vision image for the analyzed interior area
Fig. 4. Digital image of the interior area
temperature and other conditions are indicated
as numbers specified in relevant units.
The required information is provided as in-dicated in the beginning of this chapter up to the decision of the researcher.
Building exterior measurements
Similar but reverse method of concluding from exterior images is applied to the Figures 6 – 9. The selected example refers to the other part of the building to exhibit interesting aspects of concluding.
The emissivity of the analyzed area is 0.85 and thus it is lower than in interior examples.
It is justified by the fact of higher exposition
to daylight from one point of view and by the rough gray surface from the other one. The ambient air temperature is about –4 °C and the distance is closer than previously – that is 1 m
which helps to reduce reflections. The direction
of taking the measurements is important espe-cially in the case of exterior images because of possible sunlight exposition. In this case it is south-west direction which is usually
advanta-geous because it helps avoid reflections natu -rally. In this example of a patio, the direction is not so meaningful.
It is visible that in between the two windows the area of higher temperature appears. There are some symptoms visible in Figure 9 but not
sufficiently justifying the temperature difference
of 8 °C [5]. Again, there is no technical docu-mentation to this part of the building and only the owners recall a former back door entrance
to the building in this place. Definitely, the work
performed was not of high quality and the inte-rior heat leaks out from the corridor there. More-over, the horizontal bright line in the bottom of the wall suggests there is no proper soil insula-tion and there is a heat leakage spot too. Addi-tionally, some moisture can remain in this place without proper removal.
Thermal vision presented in Figure 7.
con-firms the multispectral effect but does not con -tain meaningful surface details. In the multispec-tral image, these details are shifted geometrical-ly from the thermal indication but this does not harm the conclusion. The visible deterioration of the façade shows that it has already become infested by wet rot. This image shows the area
of sunlight reflection from the parts of window
frames, especially in this case – from the left vertical one. Thermal fusion (Fig. 8) brings this information but at the same time removes parts of important temperature distribution, which shows that it is not always useful method of ther-mal imaging.
Moreover, the windows also show their se-crets. Generally, the technique of installment of the new type of windows is well known and properly performed but the details which are not so common are often poorly performed. This is the case of cone-shaped details more visibly pre-sented in multispectral shift – the brighter frame area is wider there and thus the heat leaks more
through the wider section. Definitely, this ther -mal contact resistance could be analyzed in mi-cro scale and the results could help to improve the performance of similar elements.
Fig. 8. Thermal Fusion example
Fig. 9. Digital image of the wall in the analyzed patio
CONCLUSIONS
On the basis of the presented examples one can formulate a list of damages occurring in building facades and improper thermal insulation in the investigated object elements. The refur-bishment seems necessary and at the time the pa-per is formulated it really happens. But the main idea to formulate the paper is to analyze different aspects of thermal visualization at research and/or during the doctoral stage of academic education (so called the third level). The indirect
measure-ment methods require high proficiency in theory
and need practicing to acquire high level of per-formance. It should be stressed that exclusively
optical verification is not appropriate in this visu -alization method.
The quantitative temperature analysis has been included in the range of about 25 °C, in between –5°C and 20°C that is typical for the most of the heating season in the region where the measurements are performed – it is represen-tative then [3].
Some of the points seem most important for the authors. This thermal-visual method is es-pecially appropriate for unique building objects with poor provision of technical documentation and can substitute it in a form. The adapted pro-cedure based on applied particular four ways of imaging proved to be useful, complementary and appropriate. The indication on micro scale ther-mal analysis of therther-mal contact resistance in se-lected elements is meaningful for the predicted series of further research.
REFERENCES
1. Albatici R., Tonelli A.M., Chiogna M., A com-prehensive experimental approach for the valida-tion of quantitative infrared thermography in the evaluation of building thermal transmittance. Ap-plied Energy, 141(1), 2015, 218–228, http://dx.doi. org/10.1016/j.apenergy.2014.12.035.
2. Kylili A., Fokaides P.A., Christou P., Kalogi-rou S.A., Infrared thermography (IRT) applica-tions for building diagnostics: A review. Applied Energy, 134(12), 2014, 531–549, http://dx.doi. org/10.1016/j.apenergy.2014.08.005.
3. Lehmann B., Wakili K.G., Frank Th., Collado B.V., Tanner Ch., Effects of individual climatic parameters on the infrared thermography of build-ings. Applied Energy, 110(10), 2013, 29–43, http:// dx.doi.org/10.1016/j.apenergy.2013.03.066. 4. Ohlsson K.E.A., Olofsson T., Quantitative infrared
thermography imaging of the density of heat flow
rate through a building element surface. Applied Energy, 134(12), 2014, 499–505, http://dx.doi. org/10.1016/j.apenergy.2014.08.058.
5. Wai-Lok L.W., Ka-Kin L., Chi-Sun P., Validation of size estimation of debonds in external wall’s
composite finishes via passive Infrared thermog -raphy and a gradient algorithm. Construction and Building Materials, 87(7), 2015, 113–124, http:// dx.doi.org/10.1016/j.conbuildmat.2015.03.032. 6. Zou H., Huang F., A novel intelligent fault
diagno-sis method for electrical equipment using infrared thermography. Infrared Physics and Technology, 73(11), 2015, 29–35, http://dx.doi.org/10.1016/j. infrared.2015.08.019.