COMBUSTION AND EMISSIONS CHARACTERISTICS OF
METHANE-AIR MIXTURES IN CATALYTIC MICRO-COMBUSTORS: A
COMPUTATIONAL FLUID DYNAMICS STUDY
Junjie Chen
*, Baofang Liu, Longfei Yan, Deguang Xu
Department of Energy and Power Engineering, School of Mechanical and Power Engineering, Henan Polytechnic University, Jiaozuo, Henan, 454000, China
A
BSTRACTThe combustion and emissions characteristics of methane-air mixtures in high-temperature catalytic micro-combustors were studied numerically. Both the heterogeneous and homogeneous chemistry were modeled simultaneously using detailed reaction mechanisms in order to better understand the role of each pathway in determining the product distributions. Computational fluid dynamics simulations were performed at a variety of pressures, temperatures, compositions, and combustor dimensions to determine their effects on the combustion and emissions characteristics. Comparisons were made between the results obtained for a purely heterogeneous case, a purely homogeneous case, and a coupled homogeneous-heterogeneous case. It was shown that homogeneous and homogeneous-heterogeneous chemistry take place on similar time-scales with each predicting complete conversion of methane in the system. The contribution of homogeneous and heterogeneous reactions depends strongly upon the operating conditions. The heterogeneous chemistry significantly inhibits the homogeneous chemistry due in part to the radical quenching occurring on the catalytic surfaces, which results in lack of homogeneous chemistry. The inhibiting effect also accounts for the low emissions of nitrogen oxides, as these species are formed by a homogeneous reaction pathway. Nitric oxide is the main nitrogen pollutant formed under lean-burn conditions.
Keywords: Micro-combustion; Combustion characteristics; Pollutant formation; Catalytic combustion; Reaction pathway; Computational fluid
dynamics.
* Corresponding author. Email: [email protected]; [email protected]
1. INTRODUCTION
Micro-combustors, typical dimensions in the sub-millimeter range, have become the topic of intense research due to the many interesting novel possibilities they offer. They have emerged as a powerful tool for portable production of energy (Ju and Maruta, 2011; Kaisare and Vlachos, 2012). Due to the high energy density of hydrocarbons, micro-combustion may eventually replace expensive and environmentally non-benign lithium batteries in portable energy devices (Chou et al., 2011; Walther and Ahn, 2011). Furthermore, due to their inherently higher heat-transfer coefficients, micro-combustors can serve as efficient heat sources for endothermic reactions, such as steam reforming (Pan et al., 2016) and ammonia decomposition (Sengodan et al., 2018), in thermally integrated micro-chemical systems for the production of hydrogen for fuel cell applications.
Recent efforts have attempted to utilize homogeneous combustion of hydrocarbon fuels in portable energy devices to directly produce heat or power (Chou et al., 2011; Ju and Maruta, 2011; Kaisare and Vlachos, 2012; Walther and Ahn, 2011). A major disadvantage of homogeneous combustion is that operating temperatures are necessarily very high (Karvountzis-Kontakiotis and Ntziachristos, 2016; Yousefi-Asli et al., 2018). These high temperatures greatly limit the choice of materials for device fabrication, require efficient thermal insulation, and result in increased emissions of pollutants (Lipatnikov, 2017). They also present significant challenges for many practical applications (Langille et al., 2006; Zeng et al., 2017). Another disadvantage of homogeneous
combustion is the susceptibility of gaseous flames to thermal and radical quenching, arising from confining flames in small device dimensions (Jainski et al., 2017; Mann et al., 2014).
Given the small scales of these devices and the high surface-area-to-volume ratios, catalytic combustion appears to be a promising alternative to conventional homogeneous combustion (Ju and Maruta, 2011; Kaisare and Vlachos, 2012). The lower temperatures generated through catalytic combustion can significantly widen the operating window of these devices (Norton et al., 2004, 2006). Additionally, catalytic combustion systems are typically easier to start (Norton et al., 2004), more robust to external heat losses (Kaisare et al., 2008), and self-sustained at leaner fuel-air ratios (Merotto et al., 2016a; Tolmachoff et al., 2015). Low temperature, fuel-lean catalytic operation can eliminate the formation of both nitrogen oxides and carbon monoxide, without coking of the catalyst (Pfefferle and Pfefferle, 1987; Prasad et al., 1984). Furthermore, these systems can potentially be designed into more compact geometries than homogeneous systems (Goralski and Schmidt, 1999; Zanfir and Gavriilidis, 2003), since catalytic combustion can be sustained in smaller dimensions (Norton et al., 2004). They can also be designed with very simple geometries and no moving parts (Merotto et al., 2016b; Xiao et al., 2013), which can dramatically reduce cost and can simplify miniaturization (Chou et al., 2011; Walther and Ahn, 2011). Finally, high energy efficiency can be attained by stable combustion of lean fuels (Norton et al., 2004).
Catalytic micro-combustors show great promise in many applications (Goralski and Schmidt, 1999; Zanfir and Gavriilidis, 2003). Using this type of combustor, complete conversion can be achieved at
Frontiers in Heat and Mass Transfer
residence times as short as several milliseconds (Goralski and Schmidt, 1996; Schmidt and Goralski, 1997). Therefore, there is a growing interest in developing a better understanding of catalytic combustion phenomena and processes. The basic principles of catalytic combustion have been addressed in past reviews (Pfefferle and Pfefferle, 1987; Prasad et al., 1984). At higher temperatures, there is a significant contribution from homogeneous reactions to the overall reaction-rate in parallel to heterogeneous reactions (Chattopadhyay and Veser, 2006; Stefanidis and Vlachos, 2009). In most cases, the occurrence of homogeneous reactions is an undesired feature, because it complicates the fundamental understanding of reaction mechanisms and results in selectivity losses (Goralski and Schmidt, 1999).
Catalytic micro-combustors can safely operate both within the lower homogeneous flammability limits as well as leaner than the lower flammability limits for hydrocarbon fuels (Norton et al., 2004, 2006). The presence of a catalyst will improve performance outside the flammability limits. However, it is less clear what effect the catalyst will have in the operating regime where both homogeneous and heterogeneous reactions can take place simultaneously. Experimental results have demonstrated that the presence of a catalyst can significantly reduce exhaust emissions, even when operating within the flammability limits (Basini, 2006; Choudhary et al., 2002). It is therefore of great interest to model the chemistry that takes place under these conditions in order to better understand the roles of heterogeneous and homogeneous reaction pathways in these systems.
Modeling these catalytic micro-combustors is useful both to better understand what governs the product distributions and to predict operation in regimes where experiments are difficult or dangerous (Ju and Maruta, 2011; Kaisare and Vlachos, 2012). To provide an accurate description of the operation of these combustion systems as well as better understand the interaction of transport and chemical kinetics, a two-dimensional model with detailed heat and mass transfer is necessary (Kim and Park, 2018; Li et al., 2017). Unfortunately, due to the numerical complexity involved in solving the resulting partial differential equations, simplified reaction mechanisms are often used to describe the chemistry in order to reduce the number of unknowns in the system (Norton and Vlachos, 2003, 2004). Many of the models assume that homogeneous chemistry is negligible in the system being modeled (Hayes et al., 1992; Kaisare et al., 2008). Other models have used simplified heterogeneous reaction mechanisms to avoid solving the highly non-linear surface-species balances (Deshmukh and Vlachos, 2007; Federici et al., 2009). However, simplified kinetic mechanisms provide little understanding of the actual chemistry taking place in the system, because the mechanisms themselves contain assumptions regarding the product distributions. In contrast, detailed kinetic mechanisms for the modeling of catalytic combustion phenomena are essential to accurately capture the underlying physics and develop predictive models for design (Deutschmann et al., 2000).
The present work addresses issues related to combustion and emissions characteristics in high-temperature catalytic micro-combustors in the regime where both heterogeneous and homogeneous reactions can occur simultaneously. The high temperatures observed in short-contact-time catalytic micro-combustors renders it important to model simultaneously both the homogeneous and heterogeneous chemistry using detailed reaction mechanisms to better understand the role of each pathway in determining the product distributions. This interest is motivated by the need to improve the performance and efficiency of currently operating micro-combustors and reduce the emissions of pollutants generated in the combustion processes.
In an attempt to address the issues involved in these catalytic combustion systems, a two-dimensional computational fluid dynamics model with detailed chemistry and transport was developed. Various combustion processes were proposed to model the chemistry that was actually taking place in the system. Computational fluid dynamics simulations with detailed reaction mechanisms were performed to gain insight into the interplay between homogeneous and heterogeneous chemistry. The objective of this paper is to understand how catalytic
combustion aids in reducing pollutant emissions from micro-combustors over a wide range of operating conditions. Of special interest is to understand the role of each of homogeneous and heterogeneous reaction pathways in determining the product distributions in these small-scale catalytic combustion systems.
This introduction represents Section 1 of the paper. The numerical methodology and the adopted parameter ranges are presented in Section 2. The governing equations and the chemical kinetics of both heterogeneous and homogeneous reactions are also described in detail in Section 2. Next, the results obtained from the computational fluid dynamics simulations are presented in Section 3, while some discussion of the results are presented in Section 4. Model limitations are discussed in detail in Section 4, and suggestions for further research are also presented. Finally, the conclusions that can be drawn from the study are summarized in Section 5.
2. GENERAL GUIDELINES
Due to the nature of the experiments involved, it is very difficult to determine the combustion and emissions characteristics internal to these small-scale catalytic combustion systems (Ju and Maruta, 2011; Kaisare and Vlachos, 2012). In contrast, detailed modeling can be an effective tool for revealing the combustion phenomenon and improving the designs to achieve the desired performance (Bucci et al., 2016; Lei et al., 2016). Detailed, multi-dimensional modeling is necessary to understand the complex interaction of transport and kinetics in the performance of these catalytic systems, resulting in a deeper understanding of the combustion process (Kraus and Lindstedt, 2017; Miyata et al., 2015). In the following sections, a two-dimensional computational fluid dynamics model with detailed chemistry and transport is developed in order to provide a quantitative description of the coupling between homogeneous and heterogeneous chemistry in these small-scale catalytic combustion systems.
2.1 Physical Model
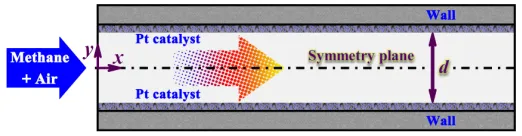
The catalytic micro-combustor used in the present work consists of two parallel, infinitely wide plates of length 8.0 mm and thickness 0.2 mm, separated by a gap distance 0.8 mm between them, unless otherwise specified. Premixed methane-air mixtures at room temperature are fed to the combustor. A schematic diagram of the combustion system is illustrated in Figure 1. Due to the aspect ratio, the combustor is modeled as a two-dimensional system, and the plane of symmetry between the two plates allows simulations of only half of the system. To identify the key physics underlying a particular phenomenon, a simpler combustion system could provide valuable insights.
Fig. 1Schematic diagram of the catalytic micro-combustor. Symmetry
allows the simulation of only half of the combustion system.
washcoat, a mean pore diameter of 20 nm, together with a porosity of 0.5 and a tortuosity factor of 3 are considered. These values are typical for the combustion catalyst (Pfefferle and Pfefferle, 1987; Prasad et al., 1984). The thickness of the catalyst washcoat is 0.08 mm.
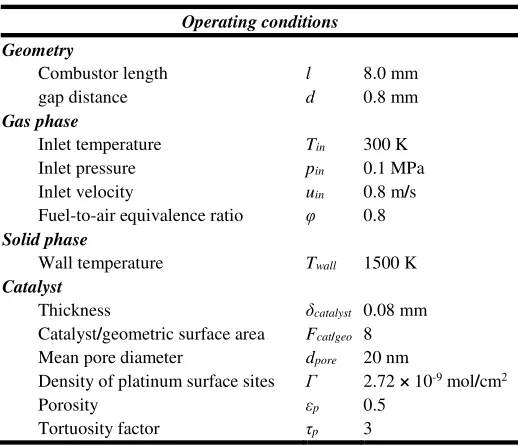
Table 1 Nominal values of simulation variables that are used for base
case computations.
Operating conditions
Geometry
Combustor length l 8.0 mm
gap distance d 0.8 mm
Gas phase
Inlet temperature Tin 300 K
Inlet pressure pin 0.1 MPa
Inlet velocity uin 0.8 m/s
Fuel-to-air equivalence ratio φ 0.8 Solid phase
Wall temperature Twall 1500 K
Catalyst
Thickness δcatalyst 0.08 mm
Catalyst/geometric surface area Fcat/geo 8
Mean pore diameter dpore 20 nm
Density of platinum surface sites Γ 2.72 × 10⁻⁹ mol/cm2
Porosity εp 0.5
Tortuosity factor τp 3
In order to establish a reference point, a “base case”, for which a typical set of operating conditions is considered, is given in Table 1. It can be expected that a more meaningful evaluation could be made by comparing a few well-chosen operating conditions representing different types of valuable physical and chemical information. The conditions selected in the present work range from 1200 to 2000 K in wall temperature, 0.1 to 2.0 MPa in pressure, 0.3 to 2.0 mm in combustor dimension, and 0.2 to 1.0 in methane-air equivalence ratio.
2.2 Mathematical Model
Modeling of the catalytic combustion of methane at conditions of interest is complex due to both mass-transfer effects and chemical kinetics that can vary with operating conditions (Carroni et al., 2002). These effects may result in enhancement or inhibition of the combustion reaction (Stefanidis and Vlachos, 2009). Additionally, detailed modeling of both the computational fluid dynamics and the chemical kinetics in the system is required (Deutschmann, 2015). Reaction mechanisms are also required to provide a detailed description of the chemical processes occurring in the system (Ju and Maruta, 2011; Kaisare and Vlachos, 2012). Furthermore, they must contain sufficient detail to adequately describe the formation of pollutants during the catalytic combustion process (Deutschmann et al., 2000).
Since the characteristic length scale of the system is still significantly larger than the molecular mean free path, the standard hypotheses of thermofluids will still apply. The Reynolds number is computed to be less than 680, which is well within the laminar flow region. A two-dimensional numerical model is developed by using ANSYS Fluent® Release 16.0, which is coupled to the external subroutines that model detailed homogeneous and heterogeneous reaction mechanisms. The Fluent software implements a finite-volume discretization scheme. The conservation equations for continuity, momentum, energy and species are solved in the gas phase.
Continuity equation:
(
)
( )
0 u v x y ρ ρ ∂ ∂∂ + ∂ = (1)
Momentum equations:
(
)
(
)
22 0
3
uu vu p u u v u v
x y x x x x y y y x
ρ ρ
µ µ µ
∂ ∂ ∂ ∂ ∂ ∂ ∂ ∂ ∂ ∂
∂ + ∂ +∂ -∂ ∂ - ∂ +∂ -∂ ∂ +∂ = (2)
(
)
(
)
22 0
3
uv vv p v u v u v
x y y x x y y y x y
ρ ρ
µ µ µ
∂ ∂ ∂ ∂ ∂ ∂ ∂ ∂ ∂ ∂
∂ + ∂ +∂ -∂ ∂ +∂ -∂ ∂ - ∂ +∂ = (3) Energy equation:
(
)
(
)
, , 1 1 0 g g K Kk k k x g k k k y g
k k
uh vh T T
Y h V Y h V
x y x x y y
ρ ρ ρ λ ρ λ = = ∂ ∂ ∂ ∂ ∂ ∂
∂ + ∂ +∂
- ∂ +∂
- ∂ = (4)Gas phase species equation:
(
)
(
)
(
)
(
)
, , 0
k k
k k x k k y k k
uY vY
Y V Y V W
x y x y
ρ ρ
ρ ρ ω
∂ ∂ ∂ ∂
∂ + ∂ +∂ +∂ -ɺ = , k=1,…,Kg (5) The diffusion velocity of species k is computed using mixture-averaged diffusion (Kee et al., 1998):
(
)
, ln ln
T
k k
k k m
k k
Y W D W
V D T
W ρY W
∇ ∇ = - + (6)
The ideal gas and caloric state laws are used: RT
p W ρ
= and
( )
,o
T o
k k o p k
T
h =h T +
c dT (7)The surface species coverage equations are given by
0 m m s σ Γ = ɺ
, m=Kg+1,…,Kg+Ks (8)
The fluid-washcoat interfacial boundary conditions for the gaseous species are written as
(
ρY Vk k y,)
interface+ηF Wc g/ k( )
sɺk interface=0, k=1,…,Kg (9) The catalyst/geometric surface area, Fc/g, is defined as follows(Deutschmann, 2015): catalyst c g geometric A F A ′ ′
/ = (10)
Internal mass transport limitations are accounted for by introduction of the effectiveness factor, η, which is defined as
( )
, tanh i eff i s s Φ η Φ = = ɺ ɺ (11)The dimensionless Thiele modulus, Φ, in the above equation can be defined as
, ,
i catalyst
i eff i interface s
D C
γ
Φ=δ ɺ (12)
The catalytically active surface area per washcoat volume, γ, is computed using the following equation:
c g catalyst F γ δ / = (13)
The effective diffusion coefficient, Di,eff, of the i-th species in the
catalyst washcoat can be estimated by using the following equation:
, , ,
1 p 1 1
i eff p i molecular i Knudsen
D D D
τ ε
= + (14)
The Knudsen diffusion coefficient, Di,Knudsen, of the i-th species can
be expressed as
, 8 3 pore i Knudsen i d RT D W π = (15)
To completely decouple kinetic effects from thermal effects, isothermal surface conditions are considered for the energy boundary conditions at the fluid-solid interface, where the wall temperature is the controlled parameter. Since the primary focus of this study is on understanding the chemical effect within the combustion system, the energy equation in the solid phase is not accounted for.
2.3 Chemical Kinetics
Table 2 Heterogeneous reaction mechanism for methane catalytic combustion over platinum.
No. Reactions A s β Ea εi, μi
(1) H2 + 2Pt(s) => 2H(s) 0.046 μPt(s) = -1
(2) 2H(s) => H2 + 2Pt(s) 3.70 × 10+21 0.0 67.4 μ
H(s) = 6
(3) H + Pt(s) => H(s) 1.00
(4) O2 + 2Pt(s) => 2O(s) 1.80 × 10+21 -0.5 0.0
(5) O2 + 2Pt(s) => 2O(s) 0.023
(6) 2O(s) => O2 + 2Pt(s) 3.70 × 10+21 0.0 213.2 μ
O(s) = 60
(7) O + Pt(s) => O(s) 1.00
(8) H2O + Pt(s) => H2O(s) 0.75
(9) H2O(s) => H2O + Pt(s) 1.0 × 10+13 0.0 40.3
(10) OH + Pt(s) => OH(s) 1.00
(11) OH(S) => OH + Pt(s) 1.0 × 10+13 0.0 192.8
(12) H(s) + O(s) <=> OH(s) + Pt(s) 3.70 × 10+21 0.0 11.5 (13) H(s) + OH(s) <=> H2O(s) + Pt(s) 3.70 × 10+21 0.0 17.4 (14) OH(s) + OH(s) <=> H2O(s) + O(s) 3.70 × 10+21 0.0 48.2
(15) CO + Pt(s) => CO(s) 0.84 μPt(s) = +1
(16) CO(s) => CO + Pt(s) 1.00 × 10+13 0.0 125.5
(17) CO2(s) => CO2 + Pt(s) 1.00 × 10+13 0.0 20.5
(18) CO(s) + O(s) => CO2(s) + Pt(s) 3.70 × 10+21 0.0 105.0
(19) CH4 + 2Pt(s) => CH3(s) + H(s) 0.01 μPt(s) = +0.3
(20) CH3(s) + Pt(s) => CH2(s) + H(s) 3.70 × 10+21 0.0 20.0 (21) CH2(s) + Pt(s) => CH(s) + H(s) 3.70 × 10+21 0.0 20.0 (22) CH(s) + Pt(s) => C(s) + H(s) 3.70 × 10+21 0.0 20.0 (23) C(s) + O(s) => CO(s) + Pt(s) 3.70 × 10+21 0.0 62.8 (24) CO(s) + Pt(s) => C(s) + O(s) 1.00 × 10+18 0.0 184.0
The rate constant of the forward reaction r are written in the form
1
exp exp
s
i r
r r
r
K
i i r
f r i
i Ea
k A T
RT RT
µ
β ε Θ
Θ
=
∏
-= . The units of A are given in
terms of [mol, cm, s]. The units of Ea and εi are in [kJ/mol]. Reactions (4) and (5) represent alternative competing pathways.
The homogeneous chemistry employed in the present work is the GRI-Mech Version 3.0 methane combustion mechanism (Smith et al., 2000). The mechanism contains elementary reactions with nitrogen. The inclusion of relevant nitrogen chemistry is important for the system operation in the fuel-lean regime where the formation of nitrogen oxides is observed during the combustion process (Bashtani et al., 2018; Hill and Smoot, 2000). The mechanism comprises 53 chemical species and 325 elementary reaction steps (Smith et al., 2000).
The heterogeneous chemistry is modeled using the mechanism proposed by Deutschmann et al. (2000). The mechanism consists of 24 elementary reactions, involving 9 gaseous species and 11 surface-adsorbed species. The reaction steps with their associated rate expressions are summarized in Table 2. Note that the Deutschmann mechanism does not include any nitrogen chemistry (Deutschmann et al., 2000), whereas the nitrogen chemistry is present in the GRI-Mech Version 3.0 methane combustion mechanism (Smith et al., 2000). Additionally, the Deutschmann mechanism assumes hydrogen adsorption is first order in surface sites even though hydrogen adsorbs dissociatively (Deutschmann et al., 2000). In the mechanism, hydrogen adsorbs as a diatomic species and then dissociates, with the rate-limiting step as the hydrogen adsorption. The Deutschmann mechanism also assumes that methane is irreversibly adsorbed and that carbon monoxide adsorption is second order in platinum sites (Deutschmann et al., 2000). This mechanism allows interaction with the homogeneous reaction mechanism through the molecules such as hydrogen, oxygen, methane, carbon monoxide, carbon dioxide, and water, as well as the radical species such as hydrogen, oxygen, and hydroxyl radicals (Deutschmann et al., 2000). Radical adsorption and desorption are also accounted for. The adsorption rate constant kad,k of the k-th gaseous
species are modeled using a modified Motz-Wise correction available in the literature (Dogwiler et al., 1999).
,
2
2 2
k
ad k m
k free k
RT k
W γ
γ θ Γ π
−
= (16)
The correction factor embedded in the above equation is important in reactions involving species with large sticking coefficients and surfaces with low free site availability (Dogwiler et al., 1999). The total available site density for the platinum catalyst is 2.72 × 10⁻⁹ mol/cm2 (Deutschmann et al., 2000). The square root term denotes the collision frequency of the k-th gaseous species with the surface.
The kinetic data of the above reaction mechanisms are taken from the literature (Deutschmann et al., 2000; Smith et al., 2000), and thermodynamic data are obtained from the above provided kinetic schemes (Deutschmann et al., 2000; Smith et al., 2000). The transport properties are evaluated using the CHEMKIN transport database (Kee et al., 1998). The homogeneous and heterogeneous reaction rate expressions are handled with the CHEMKIN (Kee et al., 1996) and Surface-CHEMKIN (Coltrin et al., 1996), respectively.
2.4 Computation Scheme
yield no obvious advantage. The fluid specific heat, viscosity, and thermal conductivity are computed from a mass fraction weighted average of the species properties, and the species specific heat is computed as functions of temperature using a piecewise polynomial representation. Multicomponent diffusion is considered, and the binary diffusion coefficients are determined from kinetic theory.
The boundary conditions are as follows. At the inlet, an imposed flat velocity profile is used, and Danckwerts boundary conditions are applied for the temperatures and species. No-slip boundary conditions are applied for both velocity components at the fluid-washcoat interface. A symmetry boundary condition is used to reduce the computational domain in half. At the exit, a fixed pressure is specified, and the transverse gradients of temperature and species are set to zero. The conservation equations are solved implicitly through a two-dimensional steady-state segregated solver using an under-relaxation factor control method. A second-order upwind scheme is used for discretization and the SIMPLE algorithm is used for the pressure-velocity coupling. The segregated solver first solves the momentum equations, then solves the continuity equation, and updates the pressure and mass flow rate. The energy and species equations are subsequently solved and convergence is checked. The solution is deemed converged as the residuals of the conservation equations are less than 10-6. Numerical convergence is in general difficult due to the inherent stiffness of the chemistry. Parallel computing with the message passing interface is used.
3. RESULTS
Computational fluid dynamics simulations are carried out using the model developed above at a variety of operating conditions to gain insight into the actual reaction occurring in the system. To gain a better understanding of the system, three different computing methods are carried out in the following sections. The first computing method is for a purely homogeneous case such as a typical thermal or homogeneous combustion process. The combustion system is then modeled for a purely heterogeneous case by taking only heterogeneous reactions into account, in which the homogeneous reactions have been artificially “switched off”. While it is impossible “to switch off” homogeneous chemistry in a real combustion system, these computations for this case can give insight into the rate at which the heterogeneous processes take place during combustion, and the products formed by the heterogeneous reactions. More details about this method can be found in previous studies (Chattopadhyay and Veser, 2006; Stefanidis and Vlachos, 2009). The final computing method is for the coupled homogeneous-heterogeneous case where both homogeneous-heterogeneous and homogeneous chemistry are allowed to occur within the system. Comparisons are then made between the results obtained for these cases. Additionally, the effects of pressure, temperature, combustor dimension, and feed composition on the combustion and emissions characteristics are investigated to determine the relative importance of each of these reaction pathways under the conditions similar to those found in high-temperature, small-scale catalytic combustion systems.
3.1 Purely Homogeneous Cases
Computational fluid dynamics simulations are carried out for the purely homogeneous case. The conversion contour plot of methane within the system is shown in the panel (a) of Figure 2. Near the entrance to the combustor, the wall temperature is significantly higher than the fluid temperature. This is duo to the upstream heat transfer from the post-combustion region through the walls (Norton and Vlachos, 2003, 2004). Therefore, energy is transferred from the wall to the fluid. Since the mixture warms up from the wall towards the centerline, ignition occurs near the wall. Very low fuel conversion takes place in the first few millimeters of the combustor. Then, the mixture combusts rapidly, releasing heat, and conversion is nearly complete in a very small region. This ignition delay occurs in the system because gas-phase radical species must accumulate in the gas phase before the start of combustion. These radical species go on to react with methane and initiate the
chain-branching combustion reactions that then proceed at a very fast rate (Miller et al., 1990; Westbrook and Dryer, 1981). This delay in ignition followed by a steep increase in fuel conversion is typical of homogeneous chemistry. Despite the small scale of the system, there are still steep concentration gradients in the transverse direction until nearly the end of the reaction region. After the reactants have been consumed, the combustion reaction stops. There are no significant concentration gradients within this post-combustion region. It can be expected that in non-adiabatic cases, both the fluid and the wall would eventually reach room temperature in sufficiently long combustors.
Fig. 2 Contours of (a) conversion, (b) carbon monoxide mass fraction,
(c) nitric oxide mass fraction, and (d) hydroxyl radical mass fraction for the purely homogeneous case.
nearly the end of the reaction region for the purely homogeneous case. These gradients necessitate the use of a two-dimensional computational fluid dynamics model, since diffusion of the species in the gas phase cannot be ignored in the axial direction.
3.2 Purely Heterogeneous Cases
To gain a better understanding of the system, computational fluid dynamics simulations are performed for the purely heterogeneous case. The conversion contour plot of methane within the fluid is shown in the panel (a) of Figure 3. Methane begins to react immediately upon entering the combustor and continues to react at a nearly constant rate until all of the reactants are completely consumed. The rate of the reaction is fast on the surface of the catalyst, resulting in to near-complete conversion in the vicinity of the catalytic region. Mass-transfer limitations, typical of heterogeneous combustion, within most of the reaction region can be found under the conditions studied here, despite the small length scales involved. The plot of conversion as a function of axial distance is similar to that of a first-order chemical reaction occurring in a plug-flow tubular reactor (data not shown). This is because the rate of the reaction for the purely heterogeneous case is simply the net flux of methane to the surface of the catalyst, which is first order in the partial pressure of methane. This is because methane is assumed to adsorb irreversibly, as discussed in the reaction mechanism proposed by Deutschmann et al. (2000).
Fig. 3 Contours of (a) conversion, (b) carbon monoxide mass fraction,
(c) methane mass fraction, and (d) carbon dioxide mass fraction for the purely heterogeneous case.
The concentration contour plot of the partial-oxidation product carbon monoxide within the fluid is shown in the panel (b) of Figure 3. Carbon monoxide is initially formed at the entrance to the combustor and then is gradually burned out to form carbon dioxide along the length of the combustor. Consequently, the final amount of carbon monoxide formed during combustion is insignificant. The concentration
contour plot of the fuel within the fluid is shown in the panel (c) of Figure 3. The methane concentration continues to decrease along the length of the combustor until the fuel is almost completely depleted. The concentration contour plot of the complete oxidation product carbon dioxide is shown in the panel (d) of Figure 3. The contour plot clearly shows that the mass fraction of carbon dioxide has almost the same change trend as the conversion of methane, as would be expected. This is because carbon dioxide is the main product produced during the combustion processes. There are no nitrogen-containing products, as shown in Figure 3. This is because homogeneous reactions are dominating nitrogen chemistry.
3.3 Coupled Homogeneous-Heterogeneous Cases
Computational fluid dynamics simulations are carried out for the coupled homogeneous-heterogeneous case. The conversion contour plot of methane within the fluid is shown in the panel (a) of Figure 4. Combustion occurs very rapidly, consuming most of the fuel in a very small region. Complete conversion is achieved for the coupled homogeneous-heterogeneous case, slightly faster than for the purely heterogeneous case, near the entrance to the combustor. The concentration contour plot of carbon monoxide within the fluid is shown in the panel (b) of Figure 4. The concentration of carbon monoxide in the gas phase is initially at a relatively high level and decreases quickly to rather insignificant magnitude.
Fig. 4 Contours of (a) conversion, (b) carbon monoxide mass fraction,
(c) nitric oxide mass fraction, and (d) hydroxyl radical mass fraction for the coupled homogeneous-heterogeneous case.
purely homogeneous case. The panel (d) of Figure 4 shows that the concentration of hydroxyl radical in the gas phase reaches a peak just prior to the completion of methane conversion. The peak occurs much sooner than for the purely homogeneous case where the peak in concentration is just after complete methane conversion is achieved. Note that the peak concentration of hydroxyl radical in the gas phase is much lower for the coupled homogeneous-heterogeneous case than for the purely homogeneous case. The results obtained for the fractional coverages of each surface species indicate that the surface of the catalyst is primarily covered with oxygen with the remainder of the surface sites vacant (data not shown). The only other species with an appreciable coverage is the hydroxyl radical, but its coverage is low. The coverage of all hydrogen-containing species remains constant after complete methane conversion is achieved. In contrast, since the carbon monoxide formed early is gradually burnt out, the coverages of carbon monoxide and carbon dioxide continue to decrease.
3.4 Effect of Pressure
It has been found that pressure can affect the reaction pathways (Chattopadhyay and Veser, 2006; Veser, 2001) and the product distributions during the catalytic combustion process (Benedetto et al., 2012; Forzatti, 2003). Due to the interest in high pressures for most applications, there is considerable interest in determining the effect of pressure on the pollutant emissions in catalytic combustion systems. Varying pressure in a catalytic combustion system alters the process in several ways. Pressure can affect heat and mass transfer to the surface of the catalyst (Deutschmann, 2015). Furthermore, entirely new reaction paths are possible if only homogeneous reactions are allowed to occur (Chattopadhyay and Veser, 2006; Veser, 2001). Homogeneous reactions typically scale with the square of the pressure due to the dominance of bimolecular reaction steps (Chattopadhyay and Veser, 2006; Dietz III and Schmidt, 1995). In contrast, heterogeneous reactions are typically limited by the mass transfer rate of limiting reactant to the surface of the catalyst, which is usually first order in the partial pressure of limiting reactant. It can be expected that as the pressure is increased, homogeneous chemistry should become more prevalent. Consequently, the interplay between homogeneous and heterogeneous reactions can be strongly affected by pressure and needs to be evaluated for different pressure conditions.
0 2 4 6 8
0 20 40 60 80 100
0.1 MPa 0.5 MPa 1.0 MPa 1.5 MPa 2.0 MPa
Axial distance (mm)
C
o
n
v
e
rs
io
n
(
%
)
0.0 0.5 1.0 1.5 2.0 0
20 40 60 80 100
C
o
n
v
er
si
o
n
(
%
)
Axial distance (mm)
Fig. 5 Effect of pressure on the methane conversion for pressures
ranging from 0.1 to 2.0 MPa, keeping all the other parameters at their base case values shown in Table 1.
Figure 5 shows the methane conversion profiles for different pressures at a constant inlet velocity, keeping all the other parameters at their base case values shown in Table 1. In the present work, special attention is paid to the system operated at the pressure below 2.0 MPa. The conversion shown in Figure 5 has been integrated over the channel
in the transverse direction. As the pressure is increased from 0.1 to 0.5 MPa, initially the conversion profile is slightly concave up, but then essentially first-order reaction behavior can be found. This phenomenon becomes clearer, when the pressure is increased to a higher level such as 1.5 and 2.0 MPa. This has a similar feature as the ignition delay obtained for the purely homogeneous case, indicating that the homogeneous chemistry becomes more important. For a constant inlet velocity, the mass transfer coefficient decreases inversely with increasing pressure, allowing free radical species to build up in the center of the system, which makes homogeneous chemistry more likely. The heat transfer coefficient does not change much with pressure, and thus any heat produced by increased homogeneous reactions will be transported away from the center less efficiently, which in turn increases the potential for homogeneous chemistry. The overall rate of the reaction also increases with increasing pressure. This can be observed at high pressures where complete methane conversion is achieved near the entrance to the combustor.
0.5 1.0 1.5 2.0
1500 K 1600 K 1700 K 1500 K
1600 K 1700 K
1500 K 1600 K 1700 K
Pressure (MPa) 0.1
Carbon monoxide
Nitric o xide
Nitroge
n dioxid
e
1E-9 1E-8 1E-7 1E-6 1E-5 1E-4
S
p
ec
ie
s
m
a
ss
f
r
a
ct
io
n
Fig. 6 Effect of wall temperature on the mass fractions of nitric oxide,
nitrogen dioxide, and carbon monoxide in the exhaust gas for pressures ranging from 0.1 to 2.0 MPa. All the other parameters are kept at their base case values shown in Table 1.
Figure 6 shows the concentrations of nitric oxide, nitrogen dioxide, and carbon monoxide in the exhaust gas at different wall temperatures for pressures ranging from 0.1 to 2.0 MPa, keeping all the other parameters at their base case values shown in Table 1. As the pressure is increased from 0.1 to 2.0 MPa, there is an increases in the amount of nitric oxide in the exhaust gas. This increase, with two orders of magnitude, for the coupled homogeneous-heterogeneous case is still significantly less than that for the purely homogeneous case. When the wall temperature is increased from 1500 to 1700 K, the amount of nitric oxide in the exhaust gas increases, indicating that higher temperatures favor the formation of nitrogen oxides. A similar trend can be found for the concentration of nitrogen dioxide. The concentrations of carbon monoxide in the exhaust gas suggest that higher pressures tend to inhibit the formation of carbon monoxide.
3.5 Effect of Temperature
increases to 100% thereafter. Furthermore, as the wall temperature is increased, the rate of conversion increases and the curve maintains the general shape obtained for a first-order reaction.
1200 1400 1600 1800 2000
Wall temperature (K) Nitric oxide
Nitrogen dioxide
Carbon monoxide
Conversion
1E-9 1E-8 1E-7 1E-6 1E-5 1E-4
S
p
ec
ie
s
m
a
ss
f
ra
c
ti
o
n
40 60 80 100
C
o
n
v
er
si
o
n
(
%
)
Fig. 7 Mass fraction profiles of nitric oxide, nitrogen dioxide, and
carbon monoxide in the exhaust gas at a pressure of 0.5 MPa at different wall temperatures, keeping all the other parameters at their base case values.
Figure 7 also shows semi-log plots of the nitric oxide, nitrogen dioxide, and carbon monoxide exhaust compositions as a function of wall temperature. It is shown that the amount of nitric oxide produced during the combustion process always increases with increasing wall temperature, including the situation where methane conversion is incomplete. After the temperature reaches 1400 K and complete methane conversion is achieved, the amount of nitric oxide in the exhaust gas increases with wall temperature at a higher rate than that when methane conversion is incomplete. At a wall temperature of 2000 K, the mass fraction of nitric oxide in the exhaust gas has increased to 2
× 10-5, the amount that is formed homogeneously at a wall temperature of 1500 K at a pressure of 0.5 MPa. On the other hand, the mass fraction of nitrogen dioxide in the exhaust gas increases initially from 6
× 10-9 to 2 × 10⁻⁸ as the wall temperature is increased from 1200 to 1280 K, and then decreases to 6 × 10⁻⁹ at a wall temperature of 1500 K. As the wall temperature is then raised from 1500 to 2000 K, the mass fraction of nitrogen dioxide in the exhaust gas increases to 2 × 10⁻⁸ again. The carbon monoxide mass fraction profile in Figure 7 shows how the amount of carbon monoxide in the exhaust gas varies with wall temperature. This amount falls rather rapidly, when the wall temperature is increased from 1200 to 1400 K as the conversion of methane goes to completion. The rate of decrease then falls when the wall temperature is increased from 1400 to 1700 K where the amount of carbon monoxide in the exhaust gas reaches a minimum at 2 × 10⁻⁵. The amount of carbon monoxide in the exhaust gas then increases steadily as the wall temperature is increased from 1700 to 2000 K, where it reaches 2 × 10⁻⁴. Within this temperature range, the amount of carbon monoxide produced are higher at higher temperatures.
3.6 Effect of Combustor Dimension
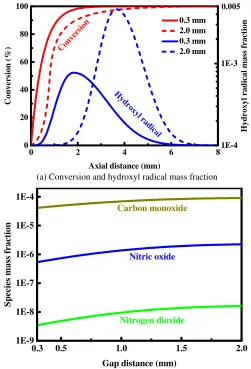
The effect of combustor dimension is evaluated for a constant inlet flow velocity, modifying accordingly the inlet flow rates and keeping all the other parameters at their base case values. Figure 8 shows the results obtained at a pressure of 0.5 MPa for gap distances ranging from 0.3 to 2.0 mm. The panel (a) of Figure 8 is a plot of conversion and hydroxyl radical mass fraction as a function of axial distance for the two limiting combustor dimensions of 0.3 and 2.0 mm. On the basis of conversion profiles, comparison of this plot to Figures 2(a) and 3(a) indicates that the results obtained for a 2.0 mm combustor dimension behave qualitatively more similar to those for the purely homogeneous case shown in Figure 2(a), while the results obtained for a 0.3 mm combustor dimension more closely resemble those for the purely
heterogeneous case shown in Figure 3(a). The mass fraction of hydroxyl radicals as a function of axial distance for the 0.3 and 2.0 mm cases is also shown in the panel (a) of Figure 8. Note that the peak radical concentration obtained in the 2.0 mm case comes later in the combustion system and shows a higher peak value than that obtained in the 0.3 mm case. The panel (b) of Figure 8 shows the concentrations of nitric oxide, nitrogen dioxide, and carbon monoxide in the exhaust gas as a function of the dimension of the combustor. The plot shows that there exists a maximum in the carbon monoxide concentration in the exhaust gas for the 2.0 mm case. Additionally, the gaseous concentration of carbon monoxide in the exhaust gas decreases with decreasing the combustor dimension. The plot also shows that the amounts of both nitric oxide and nitrogen dioxide in the exhaust gas decrease with decreasing combustor dimension.
0 2 4 6 8
0 20 40 60 80 100
0.3 mm 2.0 mm 0.3 mm 2.0 mm
Axial distance (mm)
C
o
n
v
e
rs
io
n
(
%
)
1E-4 1E-3 Con
vers ion
H
y
d
r
o
x
y
l
ra
d
ic
a
l
m
a
ss
f
r
a
ct
io
n
0.005
H ydro
xyl r ad
ical
(a) Conversion and hydroxyl radical mass fraction
0.5 1.0 1.5 2.0
Gap distance (mm) 0.3
1E-9 1E-8 1E-7 1E-6 1E-5 1E-4
Carbon monoxide
S
p
ec
ie
s
m
a
ss
f
ra
ct
io
n
Nitric oxide
Nitrogen dioxide
(b) Nitric oxide, nitrogen dioxide, and carbon monoxide mass fraction
Fig. 8 Effect of combustor dimension on the methane conversion and
various species mass fraction at a pressure of 0.5 MPa, keeping all the other parameters at their base case values. Panel (a) indicates the methane conversion and hydroxyl radical mass fraction profiles as a function of axial distance for the two limiting combustor dimensions of 0.3 and 2.0 mm. Panel (b) indicates the mass fraction profiles of nitric oxide, nitrogen dioxide, and carbon monoxide in the exhaust gas as a function of the dimension of the combustor.
3.7 Effect of Feed Composition
at leaner fuel-air ratios than homogeneous combustion systems (Merotto et al., 2016a; Tolmachoff et al., 2015). Recent experiments and simulations have demonstrated that feed composition has a significant effect on the operating temperature but only a moderate effect on the thermal uniformity (Kaisare et al., 2008; Norton et al., 2004, 2006). It may therefore be of interest to discuss how the results presented above are affected by the feed composition. For this purpose, computational fluid dynamics simulations are carried out for the coupled homogeneous-heterogeneous case for a wide range of methane-air equivalence ratios. The stoichiometric composition in a complete combustion reaction is approximately 9.5% methane in air. A pressure of 0.5 MPa is considered at different equivalence ratios, while keeping all the other parameters at their base case values.
0.2 0.4 0.6 0.8 1.0
Methane-air equivalence ratio 1E-9
1E-8 1E-7 1E-6 1E-5 1E-4
S
p
ec
ie
s
m
a
ss
f
ra
c
ti
o
n
99.90 99.92 99.94 99.96 99.98 100.00
Conversion
Carbon monoxide
Nitric oxide
Nitrogen dioxide
C
o
n
v
er
si
o
n
(
%
)
Fig. 9 Methane conversion and exhaust concentrations at a pressure of
0.5 MPa at different methane-air equivalence ratios, keeping all the other parameters at their base case values.
Figure 9 shows the methane conversion and the concentrations of nitric oxide, nitrogen dioxide, and carbon monoxide in the exhaust gas at various inlet methane-air equivalence ratios. The conversion obtained in the small-scale catalytic system is a measure of efficiency, and its control is an important optimization goal (Kaisare et al., 2008; Norton et al., 2004, 2006). Despite the low residence time for the system, nearly complete conversion of methane can be achieved for all but the very fuel-lean and near-stoichiometric mixtures. This behavior allows the combustor to be incorporated into a larger device that has a low upper temperature limit, such as a polymer-based or composite-based structure, while operating at high efficiencies. Very low temperatures are obtained for the catalytic combustion reaction under fuel-lean conditions, because the available energy achieved upon complete combustion decreases; consequently, both reaction and transport rates are decreased simultaneously. This decreased conversion at lower fuel-air equivalence ratios is consistent with the results obtained for other micro-combustion systems (Kaisare et al., 2008; Norton et al., 2004). When the concentration of methane in the feed is increased, i.e., as the composition of the feed becomes richer, the distribution of products is varied accordingly. The amount of carbon monoxide presented in the exhaust gas increases with increasing methane-air equivalence ratio, especially when the methane-air equivalence ratio is higher than 0.5. On the other hand, when the concentration of methane in the feed is increased, the concentration of nitric oxide in the exhaust gas is initially increased. However, when the methane-air equivalence ratio reaches a certain level, which is a function of the type of hydrocarbon fuels used and of the pressure employed, the conversion of methane begins to fall off, and the amount of nitric oxide in the exhaust gas also begins to decrease slightly. When the concentration of methane in the feed is increased, the amount of nitrogen dioxide in the exhaust gas decreases initially and then increases until the methane-air equivalence ratio reaches approximately 0.85. Finally, when the methane-air equivalence ratio is above this moderate range for the composition of the feed, the
amount of nitrogen dioxide in the exhaust gas then drops off quickly as the amount of excess oxygen in the inlet mixture is decreased.
0 2 4 6 8
0 20 40 60 80 100
equi vale
nce rati
o
0.2 0.4 0.6 0.8 1.0
Axial distance (mm)
C
o
n
v
e
rs
io
n
(
%
)
Incr easi
ng
Incr easi
ng
equi vale
nce rati
o
0.0 0.5 1.0 1.5 2.0 0
20 40 60 80 100
C
o
n
v
er
si
o
n
(
%
)
Axial distance (mm)
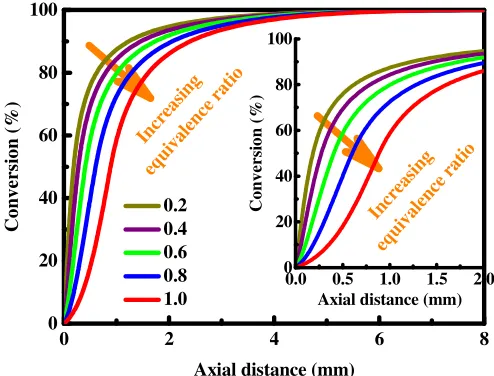
Fig. 10 Methane conversion as a function of axial distance at a
pressure of 0.5 MPa at different methane-air equivalence ratios, keeping all the other parameters at their base case values.
Figure 10 shows the methane conversion as a function of axial distance at different methane-air equivalence ratios, keeping all the other parameters at their base case values. As expected, overall conversion decreases with increasing the concentration of methane in the feed. The results obtained from first-order kinetics indicate that the conversion of methane is independent of initial feed composition. In contrast, the results obtained from homogeneous kinetics indicate that more time is needed to achieve conversion for higher concentrations of methane in the feed. Figure 10 clearly indicates that homogeneous chemistry is significant under the conditions studied here.
4. DISCUSSION
4.1 Reaction Pathways
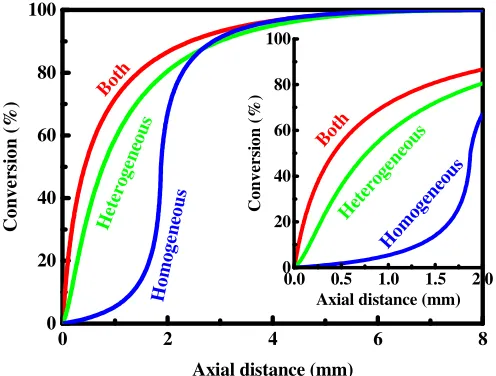
The results shown in Figures 2 and 3 for the purely homogeneous case and for the purely heterogeneous case, respectively, suggest that each mechanism has characteristic features, which can be helpful to analyze the results obtained when both homogeneous and heterogeneous reaction pathways are important. The most noticeable feature is the difference in the shape of the conversion and species concentration contour plots. The results obtained for the purely homogeneous case clearly shows an induction period, followed by a very fast reaction to go to completion. In contrast, the results obtained for the purely heterogeneous case very closely resembles conversion in a first-order reaction in a plug-flow tubular reactor where the fluid is perfectly mixed in the transverse direction but not in the axial direction. The difference in the shapes of these contour plots could potentially be used as an indicator of the type of chemistry that is taking place in the combustion system. Also, by examining the concentrations of gas-phase species, such as fuel-radical species and nitrogen oxides, that are only produced through the homogeneous reaction pathway during combustion, the relative importance of each of homogeneous and heterogeneous reaction pathways can be determined.
the relatively large amount of nitric oxide that is formed for the purely homogeneous case (panel (c) in Figure 2). Closer examination of the methane conversion as a function of axial distance reveals that the rate of methane conversion would be the fastest for the coupled homogeneous-heterogeneous case, as illustrated in Figure 11 where methane conversion as a function of axial distance is shown for three different reaction pathways. This plot indicates that, although the heterogeneous chemistry under the conditions studied here plays a dominant role in performance of the system during the catalytic combustion process, the contribution of homogeneous chemistry cannot be ignored and strongly depends on the operating conditions.
0 2 4 6 8
0 20 40 60 80 100
Hom ogen
eous
Het
erog
eneo
us
Bot
h
Axial distance (mm)
C
o
n
v
e
rs
io
n
(
%
)
Ho mo
gen eou
s
Het ero
gen eou
s
Bot
h
0.0 0.5 1.0 1.5 2.0 0
20 40 60 80 100
C
o
n
v
er
si
o
n
(
%
)
Axial distance (mm)
Fig. 11 Methane conversion as a function of axial distance for the
purely homogeneous case, for the purely heterogeneous case, and for the coupled homogeneous-heterogeneous case.
It can be expected that the rate of the combustion reaction in the gas phase increases with increasing pressure. Plots of conversion as a function of axial distance at various operating pressures (Figure 5) suggest that as the pressure is increased the curves begin to show an ignition-delay or induction feature near the entrance to the combustor, but overall the curves still appear to more closely resemble a heterogeneous or first-order process. In each case, the overall rate of methane conversion increases with increasing pressure. However, the conversion of methane shown in Figure 5 is clearly inconsistent with a rate increase that is dependent upon pressure squared. In fact, the increase in reaction rate is less than what would be expected for a first-order process. Figure 6 also indicates that the amount of nitrogen oxides in the exhaust gas, which can only be formed homogeneously, increases with increasing pressure. Consequently, more homogeneous chemistry is taking place within the system at higher pressures, although the heterogeneous reaction pathway is still apparently dominant.
The dependence of the reaction rate of methane on pressure can be explained by examining the mechanism of homogeneous reactions. While it is true that most homogeneous reactions are bimolecular and thus second order in pressure, homogeneous reactions take place through a chain-branching mechanism where free radical species build up to form a radical pool and initiate the chain-branching reactions. This build-up of radicals causes the ignition delay shown in Figure 2, followed by the very fast chain-branching reactions. The limiting step in ignition is the first-order dissociation of fuel molecules to form a hydrogen radical and fuel radical that then initiate the chain-branching mechanism. Since these dissociation reactions are only first order, the rate of the homogeneous reaction pathway relative to the heterogeneous reaction pathway should increase at roughly the same rate with increasing pressure, resulting in the pressure dependence shown in Figures 5 and 6. In these cases, the heterogeneous reactions take place faster than the homogeneous initiation steps, effectively inhibiting the onset of significant homogeneous reactions. It is clear that increasing
pressure does increase the rate of homogeneous reactions in these catalytic combustion systems, but the crucial homogeneous initiation steps are significantly hindered by the presence of the catalyst that the homogeneous reactions never propagate to a significant degree.
However, a further potential advantage of the above finding has found less attention so far: since the free surface of the catalyst tend to bind radical species which are crucial as chain carriers for homogeneous reactions, the high surface area-to-volume ratio can effectively inhibit the combustion reaction in the gas phase (Norton and Vlachos, 2003, 2004), which results in lack of homogeneous chemistry. This would obviously have a couple of very interesting consequences both for applied processes as well as basic research: the suppression of homogeneous reactions would result in an inherent safety for processes which handle potentially flammable gas mixtures, and it would also allow to investigate the reaction mechanisms and kinetics of high-temperature heterogeneous reactions without influences by parallel homogeneous reactions, i.e. it would become possible to clearly separate homogeneous and heterogeneous contributions to the overall reaction behavior (Chattopadhyay and Veser, 2006; Veser, 2001).
The dependence of the reaction pathway on temperature is subtler than the pressure dependence. It can be expected that the operating temperature plays an important role in the rate of the reaction in the heterogeneous or homogeneous reaction pathways, depending upon the activation energies of the steps of each reaction mechanism. It is clear from Figure 7 that at wall temperatures below 1400 K, complete methane conversion is impossible under the conditions studied here. As the wall temperature is increased, the rate of the overall reaction increases. However, upon closer examination of the methane conversion as a function of axial distance, the conversion of methane still resembles a first-order or heterogeneous process. The plot of nitric oxide concentration as a function of wall temperature indicates that the amount of nitric oxide in the exhaust gas increases with increasing temperature, particularly at temperatures above 1800 K. Nitric oxide can only be produced in the gas phase, but it can be expected at least a portion of this nitric oxide is formed under these high temperature conditions through the thermal mechanism. Generally, homogeneous chemistry is kinetically favored at high temperatures, but the magnitude of its contribution is dependent on operating conditions.
One of the main differences in the results between the purely homogenous case and the coupled homogeneous-heterogeneous case is the location and magnitude of the hydroxyl radical peaks. Figure 2 indicates that the peak mass fraction of hydroxyl radicals comes just after all of the methane has been converted. In contrast, for the coupled homogeneous-heterogeneous case, the peak mass fraction of hydroxyl radicals comes much earlier in the combustion system and is less than that in the purely homogeneous case, as shown in Figure 4. Note that the overall methane conversion occurs much earlier in the coupled homogeneous-heterogeneous case than in the purely homogeneous case.