Doctor of Psychology (PsyD) Theses and Dissertations
5-1-2015
Predicting Solitary Confinement
Bryce Young RobyGeorge Fox University, [email protected]
This research is a product of the Doctor of Psychology (PsyD) program at George Fox University.Find out moreabout the program.
This Dissertation is brought to you for free and open access by the Theses and Dissertations at Digital Commons @ George Fox University. It has been accepted for inclusion in Doctor of Psychology (PsyD) by an authorized administrator of Digital Commons @ George Fox University. For more information, please [email protected].
Recommended Citation
Predicting Solitary Confinement
by Bryce Y. Roby
Presented to the Faculty of the
Graduate Department of Clinical Psychology
George Fox University
in partial fulfillment of the requirements for the degree Doctor of Psychology
in Clinical Psychology
Abstract
The rates of incarceration in the United States have steadily increased at an average rate
of 3.4% per year since 1995, requiring the majority of federal and state institutions to function at or above capacity (Haun, 2007). This influx of adults entering correctional systems has placed
increased pressure on prison officials to efficiently and effectively monitor inmate behavior as maintaining the safety and security of the correctional institution is most often the highest priority of correctional administrators (Cullen, Latessa, Burton, & Lombardo, 1993). One
security measure commonly implemented to manage inmate violence and disturbances is solitary confinement. This study attempted to accurately differentiate inmates who received solitary
confinement following a disciplinary infraction form those inmates who did not from numerous variables collected by the Oregon Department of Corrections. By doing so, this study aims to predict which inmates are likely to receive segregated housing so possible preventative measures
can be implemented and utilized in order to minimize the use of segregation units in correctional institutions. Results indicated that the overall model of four predictors (sex, disciplinary report
(DR) severity level, DR infraction type “Person,” and DR infraction type “Property”) were statistically reliable in distinguishing between inmates who received time in solitary following a DR and those inmates who did not. Additionally, results concluded that non-white inmates were
Table of Contents
Approval Page ... ii
Abstract ... iii
List of Tables ... vi
List of Figures ... vii
Chapter 1: Introduction ...1
Chapter 2: Method ...10
Participants ...10
Procedures ...12
Chapter 3: Results ...13
Statistical Results of Variables ...13
Sex...13
Race ...13
Age ...13
Total sentence length ...15
Time incarcerated prior to receiving first DR ...16
Time remaining on prison sentence at time of first DR ...17
DR offense severity level ...17
Number of DR instances ...18
DR infraction type ...18
Original crime class ...19
Logistic regression ...20
Chapter 4: Discussion ...22
Discussion of Findings ...22
Limitations ...27
Future Research ...28
References ...30
List of Tables
Table 1 Comparison of Original Crime Type Percentages ...11 Table 2 Means and Standard Deviations of Variables ...14
Table 3 Group Independent Samples t-tests Comparing Age between Groups ...14 Table 4 Group Independent Samples t-tests Comparing Total Sentence Length
List of Figures
Figure 1 Mean age of inmates with a DR (yes) and without a DR (no) and time
spent in solitary ...15
Chapter 1
Introduction
More than 1.6 million men and women are incarcerated in U.S. federal and state correctional institutions (Bureau of Justice Statistics, 2012). According to research, rates of incarceration have steadily increased at an average rate of 3.4% per year since 1995, requiring
the majority of federal and state institutions to function at or above capacity (Haun, 2007). This influx of adults entering correctional systems has placed increased pressure on prison officials to
efficiently and effectively monitor inmate behavior. Maintaining the safety and security of the correctional institution is often the highest priority of correctional administrators (Cullen, Latessa, Burton, & Lombardo, 1993). Despite the priority placed on ensuring safety in
correctional facilities, research has shown that there is a widespread belief that correctional institutions are dangerous places in which the strong prey upon the weak (Hemmens & Marquart,
1999). Although these assumptions are likely to be significant overestimations of reality, disruptive, illicit, and violent behaviors remain a growing problem within correctional institutions (Wang & Diamond, 1999). Studies have shown that the rates of reported inmate
perpetrated assaults have substantially increased annually in U.S. federal and state correctional institutions since 1995 (Bureau of Justice Statistics, 2003). Increases were confirmed in both
more inmates resulting in serious injury or significant property damage” (p. 10) increased by nearly 50% during that same time period. These violent and/or disruptive inmates create
immense management difficulties for correctional staff, and place an enormous burden on prison
officials who are forced to allocate substantial resources to maintain the safety and security of a correctional facility (Maghan, 1999).
One security measure commonly implemented to manage inmate violence and
disturbances is solitary confinement. The origin of this modern penitentiary system began in the late 18th century. The foundational principle for this system was the belief in the ability to
rehabilitate criminals through the use of isolation, which stemmed from the spiritual disciplines.
Isolation was intended to be a time and a place for the offender to turn his or her thoughts
inward, to meet God, to repent his or her crimes, and then return to society as a morally cleansed
Christian citizen (Smith, 2004). The practice of solitary confinement began to be used on a much
larger scale in many European countries, as well as across the United Stated during the 19th
century (Salvatore & Aguirre, 1996). Starting around the 1950s, large-scale solitary confinement
facilities were no longer perceived as a tool in the process of rehabilitating criminals, but as a
means to incapacitate them to create a safer environment. Some countries utilize solitary
confinement throughout the pre-trial holding of prisoners, while others only isolate prisoners on
death row. In certain instances, some prison systems allow, even encourage specific prisoners
(e.g. sex offenders) to choose voluntary solitary confinement in order to protect themselves from
fellow inmates. Solitary confinement practices have been used in various ways and with varied
Today, solitary confinement facilities are often referred to as “supermax,” short for super-maximum facilities. According to the National Institute of Corrections (NIC, 1997, p. 1), “It is clear that what is ‘supermax’ in one jurisdiction may not be supermax in another.” Correctional
systems use a number of names to describe what the media frequently term supermax
(Henningsen, Johnson, & Wells, 1999, p. 54). These other names include: “special housing unit,
maxi-maxi, maximum control facility, secured housing unit, intensive management unit,
segregation unit, and administrative maximum penitentiary” (Riveland, 1999, p. 5). Some states embrace the term supermax, while others avoid it (King, 1999). No matter the name, these
isolation facilities are specifically designed to detain the most violent and disruptive inmates in single-cell confinement for 23 hours per day, often for an indefinite period of time. In summary,
isolation units have been designed specifically to manage risk. In fact, the NIC (1997) defined
supermax facilities as “institutions that provide for the management and secure control of
inmates” (p. 1). As of 1996, 34 states reported to the NIC that they had supermax facilities. By
2004, the number had risen to 44 states with supermax facilities that were housing approximately 25,000 inmates (Mears, 2005).
According to the NIC survey (1997), the operation of isolation facilities varies depending
on the state and prison. Many states place the isolation housing decision authority at the
institutional level, while others place it with department of corrections (DOC) directors or deputy
directors. More often than not, the inmates in isolation units are not those who committed the
most acreages crimes while in society, but are those whom correctional staff simply believes are
a threat to the safety, security, or orderly operation of the facility in which they are housed (NIC,
subjective perceptions. This lack of standardization between isolation facilities has been an
obstacle in assessing the practices effectiveness of their purpose.
Opponents of isolated incarceration have provided empirical support that a
disproportionate number of prisoners that served time in segregated, solitary units have problems coping with prison due to mental illness, brain damage, or other factors. Critics also contend that
the necessary treatment for these individuals is not provided, and that already unstable inmates risk greater psychologically injury due to the sensory deprivation and other disorienting features of the solitary environment. Some studies have indicated that even those who start out healthy
can become withdrawn, incapable of both initiating typical behaviors and governing suicidal or paranoid behavior (Grassian & Friedman, 1986; Haney, 1993, 2003). For these reasons, the use
of isolated confinement has led to successful litigation in several jurisdictions (Jones’ El v. Berge, 2001; Madrid v. Gomez, 1995).
In addition to the reported psychological effects, opponents also cite moral and ethical
dilemmas surrounding solitary confinement. Many hold that the general constitutionality of these
facilities is quite unclear (Riveland, 1999). The Eighth Amendment, which prohibits cruel and
unusual punishment, requires that prisoners be afforded a minimum standard of living (Law
Information Institute, 2001). Critics have argued that the living conditions and treatment
provided to inmates in segregated facilities do not meet the legal standards of the Eighth
Amendment (Fellner & Mariner, 1997); however, federal court judges have repeatedly ruled that
prolonged segregation is only considered cruel and unusual punishment for the mentally ill
be below desired standards, they are necessary measures taken to ensure the security of the
prison and therefore do not violate inmates’ constitutional rights (Henningsen et al., 1999).
In addition to disruptive and disobedient inmates causing a significant burden for the
correctional staff on maintaining the physical security and safety of the institution, the implementation and utilization of solitary facilities also carries significant financial costs.
Riveland (1999) reported, “in most jurisdictions, operating costs for extended control facilities
are generally among the highest when compared to those of other prisons” (p. 21). The
high-security components necessary to maintain the integrity of isolation facilities inflated the cost of
construction for these institutions. The facilities are commonly developed with high-security
doors, fortified walls, and sophisticated electronic systems. While construction costs are
significant, the cost of staffing these facilities is even higher due to the added training and labor
required by the correctional officers managing these inmates. These officers provide a variety of
services to inmates and perform maintenance work within the facilities that is not required of
officers in less secure units (Riveland, 1999).
The costs relating to segregation facilities go far beyond the monetary incarceration costs.
Research indicates that inmates subjected to emotional abuse, physical mistreatment, and
confinement in isolated conditions that threaten their mental health may leave prison angry,
dangerous, and far less capable of leading law-abiding lives than when they first entered the
prison system (Fellner & Mariner, 1997). Solitarily confined inmates may also be more likely
than the inmates serving their sentences in regular institutions to recidivate. Furthermore, the
moves the burden of care onto the communities as they try to effectively and efficiently deal with
mentally ill offenders (Pizarro & Stenius, 2004).
Some sources suggest the principle justification for these facilities is to protect other
inmates and the correctional staff. This “rotten apple” theory holds that eradicating the “bad apples” (i.e., violent inmates) helps prevent other inmates from committing assaults and other
infractions (Ward & Werlich, 2003). An alternative argument is that isolation facilities incapacitate the worst inmates, preventing them from injuring others. According to this
perspective, the overall reduction in prison violence results entirely from incapacitating the most
violent and serious offenders (Mears, 2006). No matter the theory, over 95% of wardens polled from all over the nation agreed that isolation facilities serve to achieve at least four critical goals:
(a) increasing safety, (b) order, and (c) control throughout prison systems, (d) incapacitating violent or disruptive inmates (Mears, 2006). There is, however, less agreement about whether the use of solitary confinement improves inmate behavior within prison systems through successful
punishment of disciplinary infractions.
The state of Oregon houses nearly 15,000 inmates in prisons. In Oregon, solitary facilities
are referred to as administrative/disciplinary segregation units (DSU) and intensive management units (IMU). While both these units meet criteria to be called solitary confinement, there are significant differences between them. The DSU is described as the “jail within a prison” (Oregon
Department of Corrections, 2009). Inmates are assigned to DSU for serious prison rule violations and can be sanctioned to the DSU for up to 180 days. Inmates in DSU are confined to their cells
significantly more restrictive as inmates remain on the unit for all activities. Whenever an inmate exits his or her cell, physical restraints (handcuffs and shackles) are worn and the inmate is escorted by two correctional officers while out of his or her cell. IMU housing assignments are
reviewed every six months and an inmate must demonstrate adequate progress and behavioral compliance in order to be reclassified and return to the general prison population.
Inmates can be placed in the IMU for a number of reasons: first, inmates who have received a sentence of death (inmates on death row status) may be assigned housing in an IMU; second, if an inmate “demonstrates the need for maximum custody housing by demonstrating
behaviors that cannot be controlled in other housing as indicated by high severity and/or chronic misconduct sanctions, escape activity or security threat group activities causing serious
management concerns” (Oregon Department of Corrections, 2002, Chapter 291); and finally, if an inmate requests and is approved to voluntarily be in the IMU. The “serious management concerns” mentioned previously involve participation in activities which poses a significant
threat to the safe and secure operation of the prison, including, but not limited to, threatening or inflicting bodily injury on another person, posing an immediate possibility of escape, promoting
or engaging in disruptive group behavior, promoting security threatening group activities, or being involved in any other activity that could significantly threaten the safe and secure
operation of the prison. Inmates receive a disciplinary report (DR) for any infraction committed
while they are incarcerated. A DR can be for serious offences like assault and arson, or for minor offences like gambling and giving false information to employees. The severity of the offense
commits an alleged infraction and a DOC staff member files a misconduct report with an immediate supervisor or with the officer in charge. That supervisor then ensures the report is “accurate, appropriate, and supported by sufficient information” (Prohibited Inmate Conduct and
Processing Disciplinary Actions, 2013). A hearing is then scheduled to determine a verdict to the charge and establish appropriate punishment. Often when an inmate is charged with committing
a rule violation, he or she may be placed in temporary disciplinary segregation status pending resolution of the charge. When resolution is found, the inmate may then be released from the segregated status or remain in segregation depending on the outcome of the hearing.This study
will attempt to correctly predict the inmates who receive a mandated stay in segregation
following a disciplinary infraction versus those inmates who do not from knowledge of sex, age,
race, number of institutional rule violations, violation severity level (1-8 inversely scored such that low numbers indicate greater severity), date of violation, violation category (i.e. Drugs, Order, Person, Property), solitary confinement start date and end date (length of stay in solitary
for violation), original crime, original crime type (i.e. Person, Property, or Statute), crime class (e.g. Class A felony, Class B felony, etc.), sentence length for individuals who have been
released from prison, and sentence days remaining for individuals still incarcerated. This study will also determine which variables are central in the prediction of solitary confinement. It is hypothesized that results will indicate:
1. Inmates will be placed into segregated housing based on the violation severity level and violation category (i.e. Drugs, Order, Person, Property).
3. Demographic information of inmate sex (male) will be shown to be predictive of a placement in solitary confinement following a DR.
4. Demographic information of inmate race will not be predictive of segregation
Chapter 2
Method
Participants
The subjects for this study were male and female inmates incarcerated within any Oregon Department of Corrections (ODOC) adult correctional facility between January 1, 2007 and March 29, 2012. Individuals who spent less than six months incarcerated and inmates who were
released from prison within three years moving out of solitary, or were juvenile offenders placed under the jurisdiction of the Oregon Youth Authority were eliminated from the sample. Thus, the
inmates with a DR included in the study also had more severe original offences and longer prison sentence. An initial sample of 19,960 individuals was obtained through the above process.
The total sample was then divided into four separate groups. Group 0 included
individuals who spent time in solitary confinement, but did not have a DR on their record. This outcome occurred after an incident or altercation resulted in all involved parties being
subsequently placed in solitary confinement while the incident was investigated and a ruling was determined. After a ruling was made, the innocent party was released back into the general prison population without a disciplinary mark (DR) on his or her record. Group 1 included
individuals who did not have a DR on their record and had not spent time in solitary
confinement. Group 2 consisted of individuals with a DR on their record, but who had not spent
taken for each group. There were an insufficient number of individuals that met the criteria for Group 3 as only 27 individuals met full criteria to be placed in that group. Thus, Group 3 was over sampled and each of the 27 individuals was included in the study. Additionally, the record
of a single participant from Group 1 did not possess all the required variables necessary for this study. That participant was eliminated and replaced with another through random sampling from
the remaining Group 1 participants who were not already included in the final sample of 200. The final sample used in this study consisted of 627 participants.
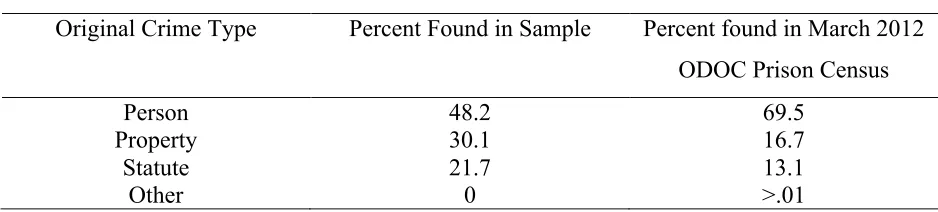
This final sample of 627 individuals was compared to the March 2012 ODOC prison
census across various domains. There was no significant difference between the percentage of male inmates in the current sample (90.6% male) and in the ODOC Prison Census of March
2012, z = .61, p = .54. Additionally, there was no significant difference found in the percentage of white inmates in the current sample (73.8% white inmates) and the ODOC Prison Census of 2012, z = -1.30, p = .19. A significant difference was found in the original crime type (i.e.,
Person, Property, and Statute; refer to Table 1) for which the inmate was convicted. Results indicated that individuals incarcerated for Person type crimes (e.g., Assault, Battery, Rape, etc.)
were underrepresented in the final sample used.
Table 1
Comparison of Original Crime Type Percentages
Original Crime Type Percent Found in Sample Percent found in March 2012 ODOC Prison Census
Person 48.2 69.5
Property 30.1 16.7
Statute 21.7 13.1
Procedure
All data for this study were obtained and coded from ODOC institutional records provided by ODOC officials. The data was archival in nature. Official records of sex, age, race,
number of institutional rule violations, violation severity level (1-8 inversely scored such that low numbers indicate greater severity), date of violation, violation category (i.e., Drugs, Order,
Person, Property), solitary confinement start date and end date (length of stay in solitary for violation), original crime, original crime type (i.e., Person, Property, or Statute), crime class (e.g., class A felony, class B felony, etc.), sentence length for individuals that have been released
from prison, and sentence days remaining for individuals still incarcerated were obtained for each subject for the course of their entire incarceration, or until March 29, 2012 when the data
Chapter 3
Results
Statistical Results of Variables
Various statistical analyses were performed to examine differences among the four
established groups (i.e., Group 0- no DR with solitary confinement, Group 1- no DR with no solitary confinement, Group 2- yes DR with no solitary confinement, Group 3- yes DR with
solitary confinement) across the variables provided by the ODOC.
Sex.A chi-squared test of independence was performed to examine the distribution of
inmate sexes (male versus female) across the four groups. The relation between these variables was found to be independent, X2 (1) = 1.54, p = .22, showing that sex is evenly distributed across the four groups.
Race. A chi-squared test of independence was performed to examine whether the inmate
ethnicity (white versus non-white) was related to group membership. Ethnicity was independent
of DR status, X2 (1) = 1.03, p = .31, but was not independent of solitary status, X2 (1) = 19.96, p
< .001, such that non-whites were more likely to have received solitary confinement. The effect size for this finding, Cramer’s V, was small, r < .154. Thus, ethnicity (white versus non-white)
was not evenly distributed across the four groups.
Age.The mean ages of inmates in the four groups are shown in Table 2. Notice that
Table 2
Means and Standard Deviations of Variables
Age (Years) Total Sentence Length (Days)
M SD M SD
Group 0 34.40 10.35 2822.53 3272.95
Group 1 52.29 5.57 874.20 1285.76
Group 2 37.05 10.46 592.66 290.50
Group 3 34.66 8.87 1589.48 140.53
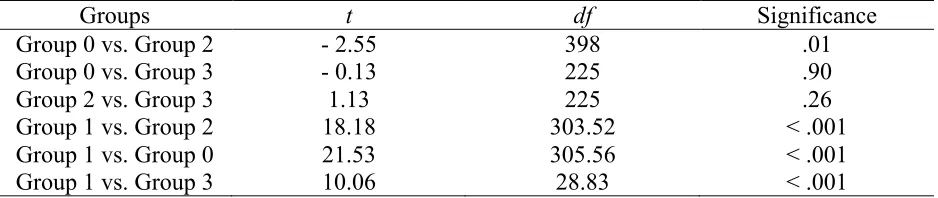
Group 1 is significantly different from the others. Specifically, there is a main effect of DR (F(1,
623) = 52.33, p < .001) and a main effect of solitary (F(1, 623) = 95.94, p < .001), but both main effects are trumped by the significant interaction (F(1, 623) = 56.06, p < .001). The interaction
indicates that the age of an individual with a DR differs as a function of whether or not he or she also has solitary. A series of independent samples t-tests with Bonferroni correction were used as a post hoc test (see Table 3) comparing the mean ages of inmates between the four groups. The
Table 3
Group Independent Samples t-tests Comparing Age between Groups
Groups t df Significance
Group 0 vs. Group 2 - 2.55 398 .01
Group 0 vs. Group 3 - 0.13 225 .90
Group 2 vs. Group 3 1.13 225 .26
Group 1 vs. Group 2 18.18 303.52 < .001
Group 1 vs. Group 0 21.53 305.56 < .001
Group 1 vs. Group 3 10.06 28.83 < .001
of inmates who received a DR (yes) and did not receive a DR (no) as well as time spent in solitary. Notice that inmates who received a DR and those that received solitary (regardless of DR status) were significantly younger than those inmates without a DR.
Figure 1. Mean age of inmates with a DR (yes) and without a DR (no) and time spent in solitary.
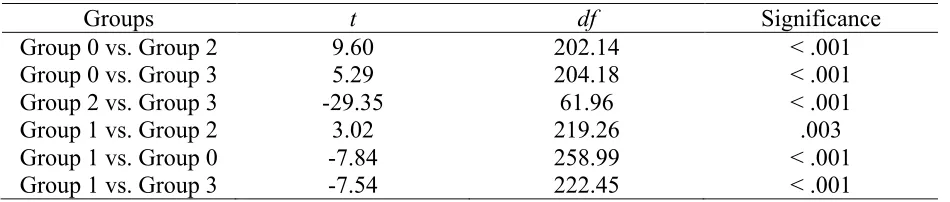
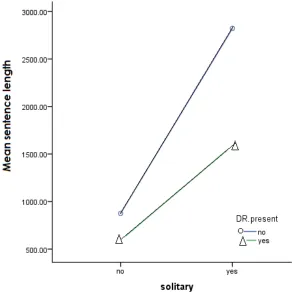
Total sentence length. The mean sentence lengths for inmates in the four groups are
shown in Table 2. Notice that Group 0 (no DR, yes solitary) has the highest mean sentence
length, followed by Group 3 (yes DR, yes solitary). A 2 (DR-no versus DR-yes) by 2 (solitary-no versus solitary-yes) ANOVA confirms that Groups 0 and 3 are significantly different from the other two groups. Specifically, there is a main effect size of solitary (F(1, 623) = 41.91, p <
interaction (F(1, 623) = 4.37, p = .04). The interaction indicates that the age of an individual with a DR differs as a function of whether or not he or she also has solitary. A series of independent samples t-tests with Bonferroni correction were used as a post hoc test (see Table 4) each group
differs from all the others. Figure 2 displays the mean prison sentence length compared to time spent in solitary. Notice that inmates with shorter prison sentences were less likely to receive
solitary confinement, even with a DR on record.
Table 4
Group Independent Samples t-tests Comparing Total Sentence Length between Groups
Groups t df Significance
Group 0 vs. Group 2 9.60 202.14 < .001
Group 0 vs. Group 3 5.29 204.18 < .001
Group 2 vs. Group 3 -29.35 61.96 < .001
Group 1 vs. Group 2 3.02 219.26 .003
Group 1 vs. Group 0 -7.84 258.99 < .001
Group 1 vs. Group 3 -7.54 222.45 < .001
Note: Using a Bonferroni correction the significant Alpha level is p < .008.
Time incarcerated prior to receiving first DR. The mean length of time an inmate was
incarcerated prior to receiving his or her first DR for the four groups are shown in Table 5. Groups 0 (no DR, yes solitary) and Group 1 (no DR, no solitary) did not receive a DR while
incarcerated. Notice that Groups 2 (yes DR, no solitary; M = 321.14, SD = 129.62) and 3 (yes DR, yes solitary; M = 318.67, SD = 185.20) have similar means. An independent samples t-test confirms that there is no significant difference in the amount of time an inmate was incarcerated
Figure 2. Sentence length versus solitary for each of the four groups.
Time remaining on prison sentence at time of first DR. The mean length of time an
inmate had remaining on their total prison sentence at the time of receiving his or her first DR for the four groups are shown in Table 4. Group 3 (yes DR, yes solitary; M = 1270.84, SD = 180.20)
has a much higher mean than Group 2 (yes DR, no solitary; M= 271.52, SD = 271.52). An independent samples t-test confirms that there is a significant difference between Group 2 and
Group 3 in the amount of time left on his or her sentence, t(225) = -19.79. p < .001.
DR offence severity level. The mean severity levels of misconduct instances across the
four groups are shown in Table 5. The severity of the instance is reverse scored (1 is most severe
Table 5
Means and Standard Deviations of Variables
Time incarcerated prior to receiving
1st DR (Days)
Time remaining on prison sentence at
time of 1st DR (Days)
Number of DR Instances
DR Offence Severity Level
(1-8)
M SD M SD M SD M SD
Group 0 Group 1
Group 2 321.14 129.62 271.52 253.69 1.50 1.71 4.13 1.12 Group 3 318.67 185.20 1270.84 180.20 8.52 9.93 1.85 1.10
Note: Group 0 and Group 1 did not receive a DR while incarcerated.
level of severity in misconduct instances than Group 2 (yes DR, no solitary; M = 4.13, SD = 1.12). An independent samples t-test confirms that and the misconduct instances were significantly more severe for Group 3 than they were for Group 2, t(225) = 9.96. p < .001.
Number of DR instances. The mean number of misconduct instances for the four groups
are shown in Table 5. Group 3 (yes DR, yes solitary; M = 8.52, SD = 9.93) has a more
misconduct instances than Group 2 (yes DR, no solitary; M = 1.50, SD = 1.71). An independent samples t-test confirms that Group 3 had significantly more DRs than Group 2, t(225) = -3.67, p
= .001.
DR infraction type. A chi-squared test of independence was performed to examine the
relation between inmate’s DR infraction type (person, property, or order) across Group 2 (yes
who receive solitary, while property and order infractions are significantly underrepresented within that same group.
Original crime class. A chi-squared test of independence was performed to examine the
relation between inmate’s original crime classes across the four groups. In Oregon, felony offenses are categorized as either Class A, B, or C felonies. Oregon also allows for unclassified
felonies that do not fall into one of the other three classes. Unclassified felonies are typically the most serious types of crimes possible in the state, while class C felonies are considered the least serious. Class A felonies carry a maximum prison sentence of 20 years and/or a $375,000 fine.
Examples of crimes that fall in the Class A categories include First-degree rape, First-degree manslaughter, Aggravated vehicular homicide, and First-degree assault. Class B felony crimes
can impose a maximum prison sentence of 10 years and/or a $250,000 fine. Examples of Class B felonies include First-degree aggravated theft, laundering a monetary instrument, First-degree abuse of a corpse, and Unlawful possession of body armor. Class C felonies can compel a five
year maximum prison sentence and/or a $100,000 fine. Class C crimes consist of, but are not limited to Mail theft or receipt of stolen mail, Second-degree burglary, Third-degree robbery, and
Promoting prostitution. For unclassified crimes, each offense has its own maximum sentence associated with it. For example, someone convicted of the unclassified felony of aggravated murder faces death or life imprisonment without the possibility of parole. Courts can also impose
a fine for unclassified felonies. Like prison sentences, the possible fines for these crimes are stated in the individual statutes. For example, someone convicted of murder or aggravated
2013). The Unclassified felony crime class was removed as the category had too few participants (9). Original crime class was found to be related to both DR status, X2 (2) = 18.11, p < .001, and solitary status, X2 (2) = 104.18, p < .001. The effect size for this finding, Cramer’s V, was
moderate, r = .41. These results indicate that the original crime class of inmates was not evenly distributed across the four groups such that Class A felons are underrepresented in the “yes DR”
groups and Class C felons are overrepresented in the “yes DR” groups. Additionally, Class A and B felons are overrepresented in the “yes solitary” groups while Class C felons are
underrepresented in the “yes solitary” groups.
Original crime type. A chi-squared test of independence was performed to examine the
relation between inmate’s original crime type (person, property, or statute) across the four
groups. Original crime type was found to be related to both DR status, X2 (2) = 20.71, p < .001, and solitary status, X2 (2) = 94.82, p < .001. The effect size for this finding, Cramer’s V, was moderate, r = .39. These results indicate an overrepresentation of property crimes in the yes DR
group, as well as an overrepresentation of person crimes among those in the “yes solitary” groups, while statute and property crimes are underrepresented in those same groups.
Logistic regression. Forward regression was conducted to determine which independent
variables (age; time remaining on prison sentence at time of first DR; DR offence severity level; number of DR instances; race; sex; original crime class; original crime type; and DR infraction
type) were predictors of time in solitary confinement within the ODOC prison system. The variables of total sentence length and time incarcerated prior to receiving first DR were removed
Regression results indicated that the overall model of four predictors (sex, DR severity level, DR infraction type “Person,” and DR infraction type “Property”) were statistically reliable in distinguishing between inmates who received time in solitary following a DR and those
inmates who did not (- 2 Log Likelihood = 60.56, X2 (2) = 97.70, p < .001). The model correctly classified 96.5% of the cases. Regression coefficients are presented in Table 6. Wald statistics
indicate that all variables except DR crime type- Property significantly predict solitary confinement following a DR. Odds ratios indicate that inmate sex is the best predictor of a solitary sentence following a DR.
Table 6
Regression Coefficients
B Wald df p Odds Ratio
Sex 3.90 5.96 1 .015 49.252
DR severity level -1.54 14.91 1 > .001 .215
DR crime type-Person
2.73 4.69 1 .030 15.374
DR crime type-
Property -0.68 0.79 1 .375 .506
Constant -0.98 0.24 1 .624 .377
Chapter 4
Discussion
Discussion of Findings
This study aimed to accurately predict the inmates who receive a mandated stay in segregation following a disciplinary infraction versus those inmates who do not based on
numerous demographic and descriptive variables collected by the ODOC. The hypotheses made
were founded on the primary criterion that administrative segregation is utilized to maintain institutional security and safety. Thus, it was hypothesized that inmates would be placed into
segregated housing based on the violation severity level and violation category (i.e. Drugs, Order, Person, and Property) as well as demographic information such as age (18-25 years old) and sex (male) This study further predicted that race would not be predictive of a segregation
placement as the race of an inmate should not impact institutional security and safety. Results were mixed across the different variables, some confirming these hypotheses while others
providing alternate conclusions.
In order to determine the existence of a predictive constellation of variables from the variables gathered, a logistic regression was utilized. Results from the logistic regression
indicated that the overall model of four predictors (sex, DR severity level, DR infraction type “Person,” and DR infraction type “Property”) were statistically reliable in distinguishing between
following an infraction. This variable was followed by DR infraction type- Person, then DR infraction type- Property, and lastly DR severity level. These results imply that the ODOC has a greater likelihood of utilizing solitary confinement as a punishment for inmate infractions when
the inmate is a male who has committed a prison offense that falls under person or property than a statute violation.
While the logistic regression produced variables that predicted those inmates placed in segregation, the variables cannot be utilized to create reliable, preventative interventions. Unsurprisingly, the majority of the variables that determined segregated housing were based off
of the DR (e.g., DR infraction type- Person, DR infraction type- Property, and DR severity level). The only variable that also was predictive of solitary was sex of the inmate, and it is
irrational that institutions, which already provide interventions, will be able to incorporate additional programs for all male inmates. Overall, little implications can be made from the logistic regression; however, while no notable predictive conclusions were found in evaluating
the constellation of variables through the logistic regression, the secondary hypothesis of the study can be addressed and a number of significant conclusions can be drawn from the individual
analysis of the variables measured.
It was hypothesized that inmates would be placed into segregated housing based on the violation severity level and violation category (i.e., Drugs, Order, Person, Property). Two
variables were gathered and assessed in order to determine if the inmate’s original crime correlated with an administrative segregation sentence following an infraction; those variables
classified as “person” were overrepresented in the two groups that received a sentence in solitary confinement. This is not surprising as these individuals would be identified as potential risks to the safety of others and be placed in solitary following an infraction. Inmates’ original crime
class (e.g., class A felony, class B felony, etc.) was also assessed and results showed that inmates sentenced for a Class A and Class B felony were overrepresented in the groups that received
solitary confinement following a DR. Again, there is little surprise in these findings as those inmates with more severe original crimes will be considered a greater security risk and separated by institutional staff into segregation units quicker in order to maintain institutional security.
A number of variables addressing inmates’ prison sentence was also examined to identify differences between those that received solitary confinement and those inmates that did not.
Total sentence length was examined under the assumption that those with longer prison sentences would typically pose a greater security risk and would be more likely to receive administrative segregation following an infraction. Results confirmed this assumption as the two
groups with inmates who received solitary had significantly longer prison sentences. Along with total sentence length, the variables of an inmate’s time incarcerated prior to receiving first DR
and an inmate’s remaining prison sentence at the time of his or her first DR was also evaluated. These variables were chosen as it was hypothesized that inmates who have been incarcerated for a longer period are more likely to receive solitary. Additionally, inmates with little prison time
remaining would be less likely to receive segregation following a DR as they may be viewed as not posing as great a security risk as those inmates with longer sentences. The statistical analysis
between inmates who had been incarcerated for years versus those that had been incarcerated a much shorter time in determining who received solitary and who did not following a DR. However, the results did show that inmates who received segregation following a DR had
significantly more time remaining on their prison sentence than those inmates that also received a DR but were not placed in segregation.
Three vital variables (i.e., DR offense severity, DR infraction type, and the number of DRs an inmate had received) were collected from the ODOC for their ability to describe the disciplinary infractions and should, intuitively, determine the severity of the infraction
punishment. Among inmates who were given a DR, results revealed that the inmates who were also placed in segregation had significantly more severe infractions than those inmates who were
not placed in segregation. This conclusion is no surprise and indicates that more acute infractions receive harsher punishments. When analyzing the infraction type similar results were found. Infractions that fell under the “person” type were overrepresented in the sample that received
solitary indicating that an infraction against staff or other inmates was treated more severely than infractions under the “property” or “statute” type. Additionally, the results demonstrate that those
inmates who received a solitary sentence had received significantly more DRs than inmates who did not receive solitary confinement following an infraction. This, again, comes as little surprise as repeat offenders often receive harsher punishments.
While some notable conclusions were found in evaluating the other variables, the most surprising and significant conclusions can be derived from the results regarding the demographic
a DR. This hypothesis was based on research that concluded men commit more violent crimes than women (Messner & Sampson, 1991; Steffensmeier & Allan, 1996) and that youthful offenders are more impulsive than their older counterparts (Spinella, 2004; Zeeb, Floresco, &
Winstanely, 2010). This study found that the age of inmates was shown to correlate with time spent in solitary confinement following a DR. As predicted, inmates who received a DR and
spent time in solitary were significantly younger than those inmates that also received a DR but did not receive time in solitary. Inmate sex was also assessed and results indicated that sex was evenly distributed across the four various groups and that no significant differences were found.
These results contradict the hypothesis that male inmates would commit more violent offenses in prison than female inmates, which would ultimately lead to a higher rate of segregated
confinement for males than for females. This alternate finding is likely due to the variations found in the prison population and prison environment.
Perhaps the most unexpected result of this study originated from the variable of inmate
race. This study hypothesized that an inmate’s race would not be predictive of a placement in a segregated unit based on the perception that the race of an inmate should not impact institutional
security and safety. Statistical results concluded that non-white inmates were more likely to receive solitary confinement following a DR than white inmates. This finding contradicts this study’s hypothesis that race would not correlate to solitary confinement, but supports recent
research discussing issues of race within both justice and correctional systems.
Research on whether there are meaningful racial disparities in the justice system has been
differences in imprisonment and sentencing. This research has found that the majority of the over two million people currently incarcerated in US jails and prisons are low-income racial
minorities (Bureau of Justice Statistics, 2012; Wakefield & Uggen, 2010; Minton, 2012).
Research has additionally shown that men and minorities are sentenced more severely, even after controlling for offenders’ prior criminal record and offense seriousness (Engen & Gainey, 2000;
Everett & Wojtkiewicz, 2002; Spohn & Holleran, 2000). Numerous studies have also found that young minorities are incarcerated a significantly higher percent than their white peers (Child Trends Databank, 2012; Spohn & Holleran, 2000). A 2013 article stated:
In 2006, one in nine black men between the ages of twenty and thirty-four was serving time. The role of race in this drama is subtle and important, and the racial breakdown is
not incidental: prisons both reflect and exacerbate existing racial and class inequalities (Loury, p. 46).
Notwithstanding the decades of research, the issue of racism and racial biases within the justice
system continues to be a central source of political and societal divergence in the US.
To date, no research has been conducted examining potential demographical biases in the
sentencing process within the correctional system. Results from the present study concurred with recent research found in the justice system and indicated that similar sentencing patterns exist within the correctional system, as younger, non-white inmates are more likely to be sentenced to
solitary confinement following a disciplinary infraction. Limitations
Like all research, this study confronted various limitations. Primarily, the sample
results. When gathering the sample and working with ODOC researchers, inmates who spent less than six months incarcerated and inmates who were released from prison within three years moving out of solitary, or were juvenile offenders placed under the jurisdiction of the Oregon
Youth Authority were eliminated from the sample. This was done with the idea that the inmates with a DR included in the study would also have a more severe original offences and longer
prison sentence. However, this also eliminated all participants with any less than a 3 year and 6 month sentence, which is a large portion of the total prison population. A second limitation was the maximum number of participants that met criteria for having both a DR and was placed in
segregated housing. As there were only 27 inmates that fit both criteria, this group was over sampled and each of the 27 individuals was included in the study.
An additionally limitation in this study was the lack of differentiation between segregated units. The ODOC has a variety of housing units that implement segregation, but those variables were not included. By differentiating the specific housing units, other factors may have surfaced
that also may have impacted the results. Future Research
Institutional use of solitary confinement and racial issues in sentencing are currently two
much researched and hotly debated topics. To date, no research has been conducted on potential
racial biases found in the sentencing processes within correctional institutions. By addressing the
potential limitations within this study, research could identify the existence and potential
prevalence of racial biases impacting the sentencing of inmates to solitary confinement.
Institutional safety and security are primary goals for correctional institutions. In efforts
modification programs to improve efficacy in maintaining institutional security and minimizing
taxpayer dollars. Research that can reasonably predicting inmate infractions would provide
direction and possible alternatives to the financially demanding and potentially psychologically
damaging use of solitary confinement. By addressing the limitations found during this study,
researchers could more accurately calculate and differentiate between those inmates who receive
solitary confinement following an infraction and those inmates who do not. Additionally, the
inclusion of additional variables, such as those collected at mental health intakes, would provide
insight and additional variables that may influence an inmate’s security risk and provide the
predictive aptitude desired by correctional staff in their attempts to provide better security to the
References
Bureau of Justice Statistics. (2003). Census of state and federal correctional facilities, 2000. Washington, DC: U.S. Department of Justice.
Bureau of Justice Statistics. (2012). Prisoners in 2003. Washington, DC: U.S. Department of Justice.
Child Trends Databank. (2012). Young adults in jail or prison. Retrieved from http://www.childtrends.org/?indicators=young-adults-in-jail-or-prison
Cullen, F. T., Latessa, E. J., Burton Jr., V. S., & Lombardo, L. X. (1993). The correctional
orientation of prison wardens: Is the rehabilitative ideal supported? Criminology, 31, 69-92.
Engen, R., & Gainey, R. (2000). Modeling the effects of legally relevant and extra-legal factors under sentencing guidelines: the rules have changes. Criminology, 38(4), 1207-1230. Everett, R. S., & Wojtkiewicz, R. A. (2002). Difference, disparity, and race/ethnic bias in federal
sentencing. Journal of Quantitative Criminology, 18(2), 189-211.
Fellner, J., & Mariner, J. (1997). Cold storage: Super-maximum security confinement in Indiana.
New York, NY: Human Rights Watch.
Fines for felonies, Or. Rev. Stat. § 161.625 (2013).
Grassian, S., & Friedman, N. (1986). Effects of sensory deprivation in psychiatric seclusion and
solitary confinement. International Journal of Law and Psychiatry, 8, 49-65.
Haney, C. (1993). Infamous punishment: the psychological consequences of isolation. National
Haney, C. (2003). Mental health issues in long-term solitary and “Supermax” confinement.
Crime and Delinquency, 49(1), 124-156.
Haun, J. J. (2007). Static and Dynamic Predictors of Institutional Misconduct and Violence
Among Incarcerated Adult Offenders (Doctoral dissertation, PACIFIC UNIVERSITY). Hemmens, C., & Marquart, J.W. (1999). Straight time: Inmates’ perception and victimization in
the prison environment. Journal of Offender Rehabilitation, 28, 1-21.
Henningsen, R. J., Johnson, W. W., & Wells, T. (1999). Supermax prisons: Panacea or
desperation? Corrections Management Quarterly, 3, 53-59.
Jones' El v. Berge, 164 F. Supp. 1096 (W.D. Wis 2001).
King, R. (1998). “Prisons.” In The Handbook of Crime and Punishment, edited by Michael H.
Tonry, (pp. 589–625). New York, NY: Oxford University Press.
Law Information Institute. (2001). Prisons and prisoner’s rights: An overview. Retrieved from
http://www4.law.cornell.edu/cgi-binhtm
Loury, G. C. (2013). Prison’s Dilemma. Washington Monthly, 45(1/2), p. 46.
Madrid v. Gomez, 889 F. Supp. 1146 (N.D. Cal 1995).
Maghan, J. (1999). Dangerous inmates: Maximum-security incarceration in the state prison systems of the United States. Aggression and Violent Behavior, 1, 1-12.
Maximum Prison Terms for Felonies, Or. Rev. Stat. § 161.605 (2013).
Mears, D. (2005). A Critical Look at Supermax Prisons. Corrections Compendium 30: 6-7,
45-49.
Messner, S., & Sampson, R. (1991). The sex ratio, family disruption, and rates of violent crime: The paradox of demographic structure. Social Forces, 69(3), 693-713.
Minton, T. D. (2012). Jail Inmates at Midyear 2011: Statistical Tables. Report NCJ 237961,
Bureau of Justice Statistics, Washington, DC.
National Institute of Corrections (NIC). (1997). Supermax Housing: A Survey of Current
Practice. Washington, DC: National Institute of Corrections. p. 1.
Oregon Department of Corrections. (2002). Handbook for rules of prohibited conduct. Salem,
OR: Author.
Oregon Department of Corrections. (2009). Handbook for families and friends of inmates.
Salem, OR: Author.
Piliavin, I., & Briar, S. (1964). Police encounters with juveniles. American Journal of Sociology,
69, p. 206
Pizarro, J., & Stenius, V. M. K. (2004). Supermax prisons: Their rise, current practices, and the
effect on inmates. The Prison Journal, 84, 248-264.
Prohibited Inmate Conduct and Processing Disciplinary Actions, Or. Rev. Stat. § 291-105-0005 (2013).
Riveland, C. (1999). Supermax prisons: Overview and general considerations. Washington, DC:
U.S. Department of Justice, National Institute of Corrections.
Rogers, R. (1993). Solitary confinement. International Journal of Offender Therapy and
Comparative Criminology, 37, 339-349.
Salvatore, D., & Aguirre, C. (1996). The birth of the penitentiary in Latin America: Essays on
Smith, P. (2004). A religious technology of the self. Rationality and religion in the rise of the
modern penitentiary. Punishment and Society, 6(2), p. 206.
Spinella M. (2004). Neurobehavioral correlates of impulsivity: evidence of prefrontal
involvement. International Journal of Neuroscience, 114, 95-104.
Spohn, C., & Holleran, D. (2000). The imprisonment penalty paid by young, unemployed black
and Hispanic male offenders. Criminology, 38(1), 281-306.
Steffensmeier, D., & Allan, E. (1996). Gender and crime: Toward a gendered theory of female offending. Annual Review of Sociology, 22, 459-487.
Wakefield, S., & Uggen, C. (2010). Incarceration and stratification. Annual Review of Sociology,36, 387-406.
Wang, E. W., & Diamond, P. M. (1999). Empirically identified factors related to violence risk in corrections. Behavioral Sciences and the Law, 17, 377-389.
Ward, D. & Werlich, T. (2003). Alcatraz and Marion: Evaluating super-maximum custody.
Punishment and Society, 5, 53–75.
Zeeb, F., Floresco, S., & Winstanely, C. (2010). Contributions of the orbitofrontal cortex to
Appendix A
Curriculum Vitae
Bryce Y. Roby, M.A.
University Address:
422 N. Meridian Street # V331 Newberg, Oregon 97132 Doctorate of Psychology George Fox University
Home Address: 2942 Holborn Circle Madison, Wisconsin 53718 503-724-1831
[email protected] Education
08.2010 to 05.2015 Student of Doctor of Psychology, Clinical Psychology George Fox University
Graduate Department of Clinical Psychology Newberg, Oregon
APA Accredited, 7-year accreditation 08.2010 to 05.2012 Master of Arts, Clinical Psychology
George Fox University
Graduate Department of Clinical Psychology Newberg, Oregon
APA Accredited, 7-year accreditation
08.2007 to 05.2010 Bachelor of Science, Psychology Brigham Young University Provo, Utah
Supervised Clinical Experience
09.2014 to present Wisconsin Department of Corrections Internship Madison, Wisconsin
A 2000-hour, yearlong internship placement within the Wisconsin Department of Corrections. 40-hours a week was dedicated to individual and group therapy with inmates at Oakhill Correctional Institution, as well as individual therapy and psychological assessments with offender in the
Assessment Experience
16 Personality Factor Questionnaire, Fifth Edition (16PF Fifth Edition) 21 Item Test
Achenbach Test of Observation Form Audit-C
Behavior Assessment System for Children and Adolescents, Second Edition (BASC-2)
07.2013 to 07.2014 Kaiser Permanente Northwest Division Salem, Oregon
Two days per week, 20-hour practicum weeks in a Primary Care medical setting working with adult, adolescents, and children in individual therapy (CBT, ACT, DBT, supportive, and solution-focused), therapy groups, and conducting neuropsychological assessments for diagnostic and treatment purposes. Participate and consult in multidisciplinary team meetings weekly. Receive and offer referrals to and from primary care physicians, as well as other specialized medical professionals within Kaiser Permanente.
8.2012 to 8.2013 Oregon State Hospital Salem, Oregon
Two days per week, 16-hour practicum weeks in a psychiatric hospital housing both civilly committed and forensic patients. Responsibilities included work with adult, severely mentally ill, civilly committed and forensic patients, facilitating therapy groups, conducting individual therapy (ACT, CBT, DBT, supportive, and solution-focused), conducting
neuropsychological, projective, personality, and forensic assessments and reports for diagnostic, treatment, and forensic purposes. Participated in interdisciplinary treatment team meetings to discuss patient progress on a weekly basis.
08.2011 to 06.2012 Pre-Practicum
George Fox University, Graduate Department of Clinical Psychology
Newberg, Oregon
Conducted individual client-centered therapy for two college students for ten sessions, with intensive supervision, two supervisors watching video of each session.
01.2008 to 08.2010 Sex-offender Treatment Support
Boston Naming Test
Brief Rating Scale of Executive Function (BRIEF) Brown Attention-Deficit Disorder Scales
Conner's 3 ADHD Index
Comprehensive Trail Making Test Continuous Performance Test (Connors)
Controlled Oral Word Association Test (COWA) Delis-Kaplan Executive Function System (D-KEFS) Dementia Rating Scales
Denver Developmental Screening Test Dementia Rating Scale 2 (1)
Finger Tapping Test
Gilliam Autism Rating Scale - Second Edition Grip Strength Test
Grooved Pegboard Test Halstead Category Test
Halstead-Reitan Neuropsychological Test Battery Hare Historical-Clinical-Risk (HRC-20)
House-Tree-Person Drawing Test Incomplete Sentence Test
Millon Adolescent Personality Inventory (MAPI)
Millon Clinical Multiaxial Inventory, Third Edition (MCMI-III)
Minnesota Multiphasic Personality Inventory, Second Edition (MMPI-2) Minnesota Multiphasic Personality Inventory- Adolescent (MMPI-A)
Minnesota Multiphasic Personality Inventory, Restructured Form (MMPI-2-RF) Montreal Cognitive Assessment
Peabody Picture Vocabulary Test, Fourth Edition (PPVT-4) Personality Assessment Inventory (PAI)
Psychopathy Checklist-Revised (PCL-R)
Repeatable Battery for the Assessment of Neuropsychological Status (RBANS) Rey 15-Item Test
Rey-Osterrieth Complex Figure Roberts-2
Rorschach, Exner System Seashore Rhythm Test
Sensory-Perceptual Examination Speech Sounds Perception Test Strong Interest Inventory Tactual Performance Test
Test of Memory Malingering (TOMM) Thematic Apperception Test (TAT) Trail Making Test A&B
Test of Memory Malingering
Wechsler Memory Scale- 4
Wechsler Adult Intelligence Scale, Fourth Edition (WAIS-IV)
Wechsler Intelligence Scale for Children, Fourth Edition (WISC-IV) Wechsler Individual Achievement Test, Third Edition (WIAT-III) Wechsler Memory Scale, Fourth Edition (WMS-IV)
Wechsler Preschool and Primary Scale of Intelligence- 3rd Ed. (WPPSI-III) Wide Range Achievement Test (WRAT-4)
Wide Range Intelligence Test (WRIT)
Wide Range Assessment of Memory and Learning, Second Edition (WRAML2) Wide Range Assessment of Visual Motor Abilities
Wisconsin Card Sorting Test
Woodcock-Johnson Test of Achievement, Third Edition (WJ III ACH) Woodcock-Johnson Test of Cognitive Abilities, Third Edition (WJ III COG)
Research Experience
01.2011 to 02.2015 Dissertation Research: Predicting Solitary Confinement
George Fox University Newberg, Oregon
This study attempted to accurately differentiate inmates who received solitary confinement following a disciplinary
infraction form those inmates who did not by using numerous variables collected by the Oregon Department of Corrections. By doing so, this study aimed to predict which inmates are likely to receive segregated housing so possible preventative measures can be implemented and utilized in order to
minimize the use of segregation units in correctional institutions.
01.2010 to 09.2014 Research Vertical Team Member George Fox University
Newberg, Oregon
Meet bi-monthly to discuss and evaluate progress,
methodology, and design of group and individual research projects. Assist team members in research design, data collection, and analysis. Areas of team focus include Shame components in Borderline Personality Disorder, Antepartum Depression, Postpartum Depression, Women’s issues, Faith Integration, Compassion Fatigue, and Vicarious Trauma.
10.2013 Research Assistant
George Fox University Newberg, Oregon
measure, to adult volunteers s part of data collection for a dissertation assessing the memory implications from mild to moderate hearing loss.
09.2009 Research Assistant
Brigham Young University Provo, Utah
Assisted a gradate student in contacted and gathered
participants, administered screeners, and collected data as part of dissertation work. The study provided initial psychometric reliability and validity estimates for recovery indicators developed by the Utah Division of the National Alliance for the Mentally Ill (NAMI-Utah).
Teaching Experience
01.2013 to 06.2013 Adjunct Faculty
Course: Test and Assessment
Graduate Department of Counseling Psychology George Fox University
Portland, Oregon
Taught a graduate course on the basic concepts and principles of psychological assessment tools employed in school
systems. Lectures included topics on foundational statistical principles, the variety of psychological testing materials used by school psychologists, alternative methods of assessing, assessment ethics, and multicultural issues in assessment. 01.2014 to 06.2014 Teaching Assistant with Wayne Adams, Ph.D., ABPP
Course: Neuropsychological Assessment Graduate Department of Clinical Psychology George Fox University
Portland, Oregon
Assisted in assessment demonstrations and supervised administration competence in a class of graduate students. Also responsible for grading quizzes and tests.
09.2013 to 12.2013 Teaching Assistant with Kristina Kays, Psy.D. Course: Advanced Clinical Skills
Undergraduate Psychology Department George Fox University
Newberg, Oregon
Responsibilities included supervision, watching videotape, providing feedback, lecturing, and processing developmental issues with my team of students.
06.2013 to 07.2013 Teaching Assistant with Joel Gregor, Psy.D. Course: Social Psychology
Graduate Department of Clinical Psychology George Fox University
Newberg, Oregon
Assisted in updating the class syllabus and managed the weekly on-line quizzes. I was responsible for grading papers, answering student concerns, and lecturing.
Professional Presentations
05.2013 Poster Presentation
Oregon Psychological Association Annual Conference Eugene, Oregon
Presented findings from research examining the utility of the PGRE as an evaluative measure in determining doctoral candidacy, as well as establish the predictive validity of the PGRE to EPPP passing rate. Furthermore, this study seeks to analyze any relationships between PGRE test scores and EPPP licensing exam scores in an attempt to determine the validity of using the PGRE as a standardized measure in determining doctoral candidacy in clinical psychology.
10.2009 Poster Presentation
Rocky Mountain Society for Psychotherapy Research Conference
Orem, Utah
Presented findings from research that provided initial psychometric reliability and validity estimates for recovery indicators developed by the Utah Division of the National Alliance for the Mentally Ill (NAMI-Utah).
11.2009 Poster Presentation
North American Chapter of the Society for Psychotherapy Research Conference
Park City, Utah
indicators developed by the Utah Division of the National Alliance for the Mentally Ill (NAMI-Utah).
Academic Service
05.2013 to 05.2014 Student Counsel President
Graduate Department of Clinical Psychology George Fox University
Newberg, Oregon
Serve the graduate student body by leading Student Council meeting that aim to address corporate concerns, plan events, and fostered a communal atmosphere between cohorts. This responsibility required liaison skills to communicate between students and faculty.
08.2013 to 05.2014 Peer Mentor
Graduate Department of Clinical Psychology George Fox University
Newberg, Oregon
Individual weekly meetings with two second-year Psy.D. students. During these meetings I provide support, feedback, and advice in regards to practicum expereinces, dissertation, psychological assessment, as well as personal and
professional concerns.
05.2012 to 05.2013 Student Counsel, Third-year Cohort Representative Graduate Department of Clinical Psychology George Fox University
Newberg, Oregon
Served the graduate student body by addressing corporate concerns, acting as a liaison to faculty, planning events, etc. 08.2011 to 05.2012 Peer Mentor
Graduate Department of Clinical Psychology George Fox University
Newberg, Oregon
Assisted a first year Psy.D. student in transition to graduate school by providing academic and professional guidance and support.
05.13.2013 GDCP Special Commendation
Graduate Department of Clinical Psychology George Fox University
Newberg, Oregon
A formal Special Commendation is extended by the faculty to students within the program that demonstrate exemplary performance, noteworthy accomplishments, and significantly contribute to the program.
Professional Affiliations
2012 to Present American Psychology-Law Society (Division 41 of APA)- Student Affiliate
2012 to Present Oregon Psychological Association- Student Affiliate
2010 to Present American Psychological Association- Student Affiliate References
Joel Gregor, PsyD
Director of GFU Behavioral Health Clinic George Fox University
503-554-2367
Bruce Erdmann, PhD
Psychology Internship Director Wisconsin Department of Corrections 608-240-5117
[email protected] Nancy Thurston, PsyD, ABPP
Professor of Psychology George Fox University 503-554-2378
Janet Walsh, PhD Psychology Supervisor
Oakhill Correctional Institution 608-835-6060
[email protected] Kathleen Gathercoal, PhD
Professor of Psychology George Fox University 503-554-2376
Sally Williams, PsyD Clinical Psychologist
Division of Community Corrections Region 1 608-240-3820