INTRODUCTION
The constant development of materials engi‑ neering as well as the use of newer technological and construction solutions necessitate improving the techniques of joining materials. One of the methods of making joints, which plays an in‑ creasingly important role in many industries, is bonding [1, 2–4]. An example pertaining to the use of this type of joints is the increasing applica‑ tion of adhesive joints in the aviation industry [3]. The interest in the process is mainly related to the need to minimize the mass and number of joints in aircraft constructions [4–6]. Adhesive bonding has also found wide application in the automotive industry, in the production of passenger cars or buses [2, 7].
Bonding is a process consisting of several stages. A properly carried out process of join‑ ing materials with adhesive requires a very well thought‑out selection of the activities and factors accompanying the process [2, 8, 9].
One of the most important stages of bonding is the treatment of the surface of the adherends,
ensuring the desired strength of the joint [10, 11]. The process of surface treatment involves the re‑ moval of impurities and the appropriate develop‑ ment of the joined surfaces. The choice of sur‑ face treatment depends on the type of materials to be joined, employed adhesive or the intended use [12–15]. The strength of an adhesive joint de‑ pends on many factors. The main technological aspects affecting the strength of the adhesive joint include the length of the overlap, the thickness of the adhesive joint, the thickness of the adher‑ ends, the size of the spew fillet, the stiffness of the adhesive and the stiffness of the joined materi‑ als [9, 16–19]. The aim of the experiment was to determine the impact of technological factors on the strength of single‑lap adhesive joints made in 3 different variants using a C45 steel sheet.
EXPERIMENT
The subject of the research involved single‑lap adhesive joints made of the C45 steel. In the study, Greinplast mosaic plaster with a grain thickness
The Influence of Technological Factors
on the Strength of Adhesive Joints of Steel Sheets
Elżbieta Doluk
1*, Anna Rudawska
1, Valentina Brunella
21 Lublin University of Technology, Faculty of Mechanical Engineering, Nadbystrzycka 36, 20‑618 Lublin, Poland
2 University of Turin, Department of Chemistry, Via P. Giuria 7, Turin, Italy
* Coresponding author’s e‑mail: [email protected]
ABSTRACT
The paper evaluates the effect of the surface treatment on the strength of the single‑lap adhesive joints made of the C45 steel. The samples were joined using an adhesive composition consisting of Epidian 57 epoxy resin and PAC
curing agent. The study also used Greinplast mosaic plaster with a grain size of 1.0–1.6 mm as coating. The experi‑
ment was carried out for 3 variants of joints: sheet/sheet, sheet+plaster/sheet+plaster, sheet/sheet+plaster. Each vari‑ ant was divided into 3 methods of surface treatment. The strength tests were carried out on the Zwick/Roell Z150
testing machine. The roughness parameters of the surface’s samples were measured using a HOMMEL TESTER T1000 profilometer.
Keywords: adhesive joint,shear strength, surface roughness
Volume 14, Issue 1, March 2020, pages 107–115
https://doi.org/10.12913/22998624/116549
Research Journal
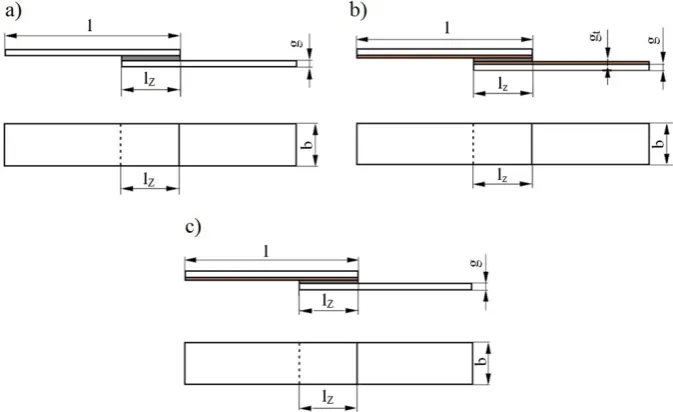
Accepted: 2020.02.05of 1.0–1.6 mm was used as an additional factor influencing the strength of the adhesive joint. The adhesive joints were made in three variants: variant I: sheet/sheet, variant II: sheet+plaster/ sheet+plaster, variant III: sheet/sheet+plaster. The shapes and dimensions of the samples after the bonding process are shown in Figure 1.
The dimensions of the samples were as follows:
• l = 100 mm – length of the sample, • b = 25 mm – sheet width,
• g = 1 mm – sheet thickness, • lz = 20 mm – the length of the tab,
• gt = 2.66–3.74 mm – thickness of the sheet with plaster.
The appearance of the samples covered with mosaic plaster and adhesive joints with the use of plaster are presented in Figure 2.
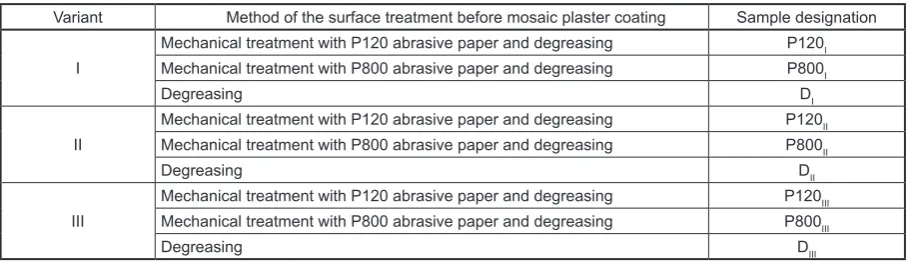
The samples of adherend for each variant of bonded joints were subjected to 3 methods of surface treatment: mechanical treatment with the P120 grain size abrasive paper and degreas‑ ing, mechanical treatment with the P800 grain size abrasive paper and degreasing or degreasing using extraction gasoline. After completing the above‑mentioned steps, Greinplast mosaic plas‑ ter was applied to some of the samples (variant II and III). Table 1 presents the methods of sur‑ face treatment and determination of the samples in each variant.
The preparation of the samples for the bond‑ ing process and the application of the plaster were carried out at 29±2°C with an air humidity of
38±2°C. The time of seasoning the samples with plaster was 48 days.
An adhesive composition formed by mixing Epidian 57 epoxy resin and PAC curing agent in a weight ratio of 1:1 was used for joining the sam‑ ples. The adhesive was applied to both surfaces with a thin layer. The process of making joints was carried out at 30°C and humidity was 30%. The adhesive joint was loaded for 2 days with 2 kg weights and then cured for 46 days without load.
The strength tests were carried out on a Zwick / Roell Z150 testing machine in accordance with the recommendations of the standard [20].
The surface roughness measurements were made for 3 methods of the sample surface treat‑ ment: P120 abrasive paper, P800 abrasive paper or surface degreasing only. The surface roughness parameters such as Ra, Rz, Rsm were measured using a HOMMEL TESTER T1000 profilometer. The measuring procedure involved performing a series of 10 measurements according to the stan‑ dard [21].
ANALYSIS AND MEASUREMENT
Surface roughness
The surface roughness test was performed for 3 samples for each method: mechanical treat‑ ment with the P120 abrasive paper, mechanical treatment with the P800 abrasive paper and on the samples that have not been subjected to any
Fig. 1. The shape and dimensions of the adhesive joint samples after the bonding process:
treatment. Three measurements were conduct‑ ed for each sample. Fig. 3 presents the surface roughness parameters depending on the method of the sample treatment. The presented values of surface roughness parameters are the average value obtained from 9 measurements.
The lowest average Ra parameter value was obtained for the samples processed with the P800 abrasive paper (Ra = 1.65 μm) and the highest for the samples processed with the P120 abrasive paper (Ra = 1.7 μm). The lowest average roughness values for the Rz and Rmax parameters were observed for the samples prepared with the P800 grain size abrasive paper (Rz = 9.92 μm, Rmax = 11.91 μm) and the highest with P120 abra‑ sive paper (Rz = 11.91 μm, Rmax = 14.33 μm). For all measured surface roughness parameters, the treatment with the P120 abrasive paper result‑ ed in obtaining higher values compared to the sur‑ faces without treatment. The use of P800 abrasive paper for all tests allowed receiving lower values of surface roughness than in the case without any mechanical treatment.
The average Ra value gained during the P120 paper treatment was about 4% higher than
the average value of this parameter received for the untreated surface. The treatment with the P800 abrasive paper allowed obtaining less than 1% lower Ra values compared to the Ra values achieved for the variant without the use of abra‑ sive paper.
The difference between the average Rz val‑ ue obtained using the P120 abrasive paper and without treatment was about 97%, while between P800 and without treatment, it amounted to 9%. The average Rmax obtained after the P120 treat‑ ment was about 1% higher than the average value of this parameter achieved without treatment. The value of the Rmax parameter obtained after the treatment with the P800 abrasive paper was about 15% lower than the Rmax measured on the sur‑ faces of the untreated samples.
All maximum values of the measured rough‑ ness parameters were achieved for the samples prepared with the P120 abrasive paper and the lowest with the P800 abrasive paper. The differ‑ ence between the highest and lowest average val‑ ue of the parameters were: Ra – 4%, Rz – 17%, Rmax – 17%.
Table 1. Methods of the surface treatment
Variant Method of the surface treatment before mosaic plaster coating Sample designation
I
Mechanical treatment with P120 abrasive paper and degreasing P120I
Mechanical treatment with P800 abrasive paper and degreasing P800I
Degreasing DI
II
Mechanical treatment with P120 abrasive paper and degreasing P120II
Mechanical treatment with P800 abrasive paper and degreasing P800II
Degreasing DII
III
Mechanical treatment with P120 abrasive paper and degreasing P120III
Mechanical treatment with P800 abrasive paper and degreasing P800III
Degreasing DIII
Fig. 2. Application of mosaic plaster in the experiment:
Strength of adhesive joints
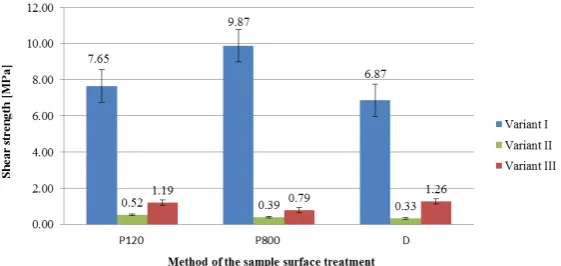
The shear strength results of the single‑lap adhesive joints are shown in Figure 4.
While analyzing Figure 4, it can be ob‑ served that the highest average values of the shear strength for all surface treatments were obtained for variant I. The lowest average val‑ ues of the strength were observed for variant II. The highest value of shear strength was obtained for machining with the P800 abrasive paper and degreasing (9.87 MPa) and the lowest with use only degreasing (0.33 MPa). The difference be‑ tween the highest and lowest shear strength was about 97%.
The maximum average value of the shear strength for variant I was obtained for the treat‑ ment with the P800 abrasive paper and degreas‑ ing (9.87 MPa), while the lowest was gained for the samples without abrasive the paper treat‑ ment (6.87 MPa). The difference between the extremes was 3 MPa, i.e. 30%. For variant II, the maximum value value of shear strength was observed for the surfaces prepared with the P120 abrasive paper and degreasing (0.52 MPa), the lowest for samples prepared only by degreasing (0.33 MPa). The difference between the values
was 0.19 MPa, i.e. 37%. The maximum value of shear strength for variant III was achieved for the samples the surfaces of which were only degreased (1.26 MPa) and the smallest for the surfaces prepared with the P800 abrasive paper and degreasing (0.79 MPa). The difference be‑ tween extremes was 0.47 MPa, i.e. 37%.
The maximum differences in the shear strength achieved depending on the method of the sample surface treatment were: 7.13 MPa, i.e. 93% with the P120 abrasive paper and degreas‑ ing, 9.48 MPa, i.e. 96% with the P800 abrasive paper and degreasing, and 6.54 MPa, i.e. 95% with degreasing only.
Statistical analysis
In order to investigate the effect of the surface treatment on the strength of the single‑lap joints for the considered variants, a statistical analy‑ sis was performed using the STATISTICA 13.3 software package. It was used to calculate the pa‑ rameters of descriptive statistics for each of the variants. Statistical tests such as: Shapiro Wilk test, Fisher‑Snedecor test, Student t‑test, and Cochran‑Cox test, were performed. All tests were
Fig. 4. Average values of the shear strength of the single‑lap adhesive joints for the considered variants
carried out at the significance level of α = 0.05. Table 2 presents the hypotheses that were adopted for each of the tests mentioned above.
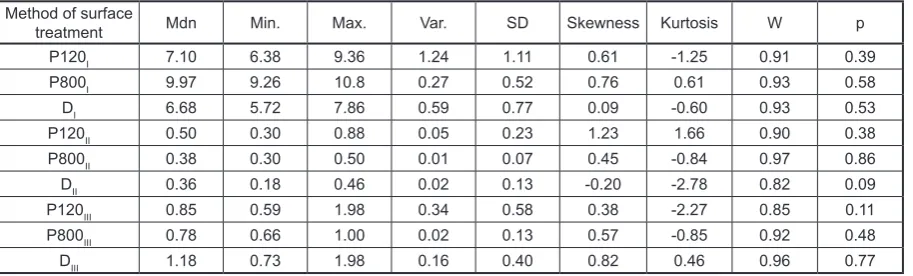
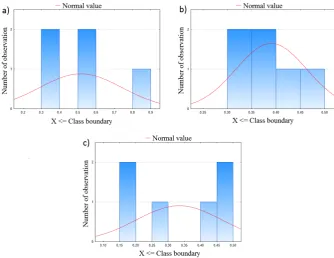
The statistical analysis was started from the study of the normality of the distribution of the results. For this purpose, the Shapiro‑Wilk test was carried out. On the basis of the data sum‑ marized in Table 3, it can be concluded that all obtained strength results are normally distributed.
The visual interpretation of the test of nor‑ mality was presented by histograms of normality in Figures 5–7.
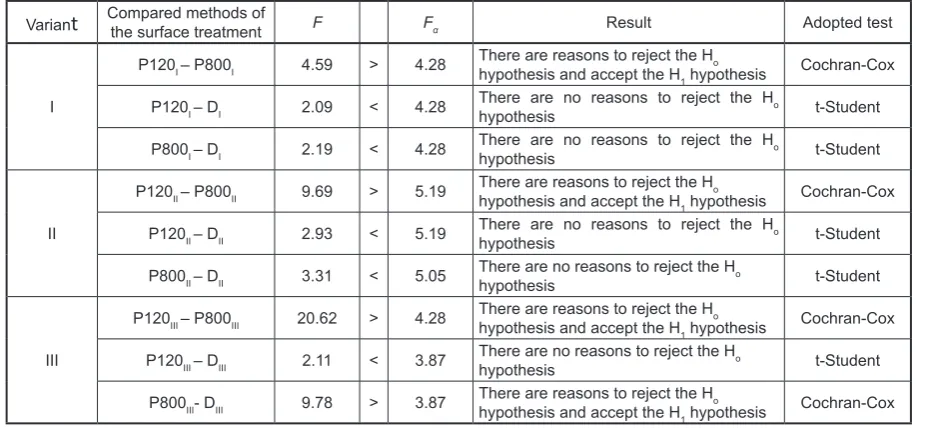
In order to determine the occurrence of the statistically significant differences in the strength values obtained depending on the method of sur‑ face treatment, the Fisher‑Snedecor test, t‑Stu‑ dent test and Cochran‑Cox test were performed. The effects of the above‑mentioned tests were collected in Tables 4–6.
On the basis of Table 4, it was found that among all performed comparisons of the shear joint strength, 5 of them did not show statistically significant differences in terms of precision at the assumed level of significance. In connection
with the above, these results were subjected to the t‑Student test. The results of this test are listed in Table 5. The Cochran‑Cox test (Table 6) was per‑ formed for the compared samples, which showed statistically significant differences in terms of precision.
On the basis of the developed tests, it was found that between the P800I‑DI, P120I‑P800I and P120III‑DIII results, there are statistically signifi‑ cant differences in terms of accuracy. The other compared methods of surface preparation gave statistically similar effects.
CONCLUSIONS
The aim of the experiment was to determine the effect of the surface treatment method and the variant of the joint performance on the strength of the single‑lap adhesive joints. Three meth‑ ods of surface treatment for each of 3 adhesive joints were examined. In order to estimate the occurrence of the strength differences between the considered adhesive joints, the parameters of
Table 3. Parameters of descriptive statistics and Shapiro‑Wilk test results
Method of surface
treatment Mdn Min. Max. Var. SD Skewness Kurtosis W p
P120I 7.10 6.38 9.36 1.24 1.11 0.61 ‑1.25 0.91 0.39
P800I 9.97 9.26 10.8 0.27 0.52 0.76 0.61 0.93 0.58
DI 6.68 5.72 7.86 0.59 0.77 0.09 ‑0.60 0.93 0.53
P120II 0.50 0.30 0.88 0.05 0.23 1.23 1.66 0.90 0.38
P800II 0.38 0.30 0.50 0.01 0.07 0.45 ‑0.84 0.97 0.86
DII 0.36 0.18 0.46 0.02 0.13 ‑0.20 ‑2.78 0.82 0.09
P120III 0.85 0.59 1.98 0.34 0.58 0.38 ‑2.27 0.85 0.11
P800III 0.78 0.66 1.00 0.02 0.13 0.57 ‑0.85 0.92 0.48
DIII 1.18 0.73 1.98 0.16 0.40 0.82 0.46 0.96 0.77
Table 2. Hypotheses accepted for statistical analysis
Test Hypothesis
Shapiro‑Wilk Ho – data are normally distributed
H1 – data are not normally distributed
Fisher‑Snedecor
H0 – there are no significant differences between average value values of variance for the
compared methods of the surface treatment
H1 – there are significant differences between average value values of variance for the compared
methods of the surface treatment
t‑Student
H0 – there are no significant differences between average values for the compared methods of
the surface treatment
H1 – there are significant differences between average values for the compared methods of the
surface treatment
Cochran‑Cox
H0 – there are no significant differences between average values for the compared methods of
the surface treatment
H1 – there are significant differences between average values for the compared methods of the
descriptive statistics were calculated and the sta‑ tistical analysis of the strength results was carried out. The surface roughness tests were also con‑ ducted prior to the bonding process.
The surface roughness tests allowed deter‑ mining that the lowest mean values of the rough‑ ness parameters occurred for the treatment with the P800 abrasive paper.
On the basis of the conducted experiment, it can be concluded that the method of surface treat‑ ment (before mosaic plaster coating) affects the strength of the single‑lap adhesive joints. The highest mean values of the shear strength were obtained for the samples prepared with the P800 abrasive paper and degreasing (variant I) as well as the P120 paper and degreasing (variant II). For
Fig. 5. Histograms of normality – Variant I: a) P120I, b) P800I, c) DI
Fig. 7. Histograms of normality – Variant III: a) P120III, b) P800III, c) DIII
Table 4. Fisher‑Snedecor test results
Variant Compared methods of the surface treatment F Fα Result Adopted test
I
P120I – P800I 4.59 > 4.28 There are reasons to reject the Ho
hypothesis and accept the H1 hypothesis Cochran‑Cox
P120I – DI 2.09 < 4.28 There are no reasons to reject the Ho
hypothesis t‑Student
P800I – DI 2.19 < 4.28 There are no reasons to reject the Ho
hypothesis t‑Student
II
P120II – P800II 9.69 > 5.19 There are reasons to reject the Ho
hypothesis and accept the H1 hypothesis Cochran‑Cox
P120II – DII 2.93 < 5.19 There are no reasons to reject the Ho
hypothesis t‑Student
P800II – DII 3.31 < 5.05 There are no reasons to reject the Ho
hypothesis t‑Student
III
P120III – P800III 20.62 > 4.28 There are reasons to reject the Ho
hypothesis and accept the H1 hypothesis Cochran‑Cox
P120III – DIII 2.11 < 3.87 There are no reasons to reject the Ho
hypothesis t‑Student
P800III‑ DIII 9.78 > 3.87 There are reasons to reject the Ho
hypothesis and accept the H1 hypothesis Cochran‑Cox
Table 5. t‑Student test results
Variant Compared methods of the surface treatment t tα Result
I P120I – DI 1.51 < 2.18 There are no reasons to reject the Ho hypothesis
P800I – DI 8.55 > 2.18 There are reasons to reject the Ho hypothesis and accept
the H1 hypothesis
II P120II – DII 1.67 < 2.26 There are no reasons to reject the Ho hypothesis
P800II – DII 0.92 < 2.23 There are no reasons to reject the Ho hypothesis
both variants, the lowest average strength value was observed for samples prepared by using only a degreaser.
The variant of the sample adhesive joints also affects the strength of the constituted adhe‑ sive joint. This is due to the fact that for variant III, the highest shear strength occurred for the degreasing of the surface of samples and the low‑ est for processing with the P800 abrasive paper with degreasing. While comparing the obtained results, it can be noticed that there are differences between the average strength values for variant I and variant II and III. Hence, it can be concluded that applying a layer of mosaic plaster on one (variant III) or two joined surfaces (variant II) causes a reduction in the average values of the shear strength of the single‑lap adhesive joints.
REFERENCES
1. Mittal, K.L. and American Chemical Society: Adhe‑
sive Joints: Formation, Characteristics, and Testing. Plenum Press, 1984.
2. Rudawska, A., Kuczmaszewski, J.: Klejenie blach
ocynkowanych. Wyd. Uczelniane PL, Lublin, 2005.
3. Arenas, M.J., Alia, C., Julián, J.N.J., Ocaña, R., González, C.: Considerations for the industrial ap‑ plication of structural adhesive joints in the alumin‑
ium–composite material bonding. Composites Part B: Engineering, 44(1), 2013, 417–423.
4. Xu, W., Wei, Y.G.: Strength and interface failure mechanism of adhesive joints. International Journal
of Adhesion and Adhesives, 34, 2012, 80–92. 5. Boutar, Y., Naïmi, S., Mezlini, S., Sik Ali, M.B.:
Effect of surface treatment on the shear strength of
aluminium adhesive single‑lap joints for automotive
applications. International Journal of Adhesion and
Adhesives, 67, 2016, 38–43.
6. Díaz‑Benito, B., Velasco, F., Pantoja, M.: Mechani‑
cal properties of polyester films painted after silani‑
zation of 6063 aluminium alloy with different pre‑
treatment conditions. Progress in Organic Coatings, 70(4), 2011, 287–292.
7. Borsellino, C., Di Bella, G., Ruisi, V.F.: Adhesive joining of aluminium AA6082: The effects of resin and surface treatment. International Journal of Ad‑
hesion and Adhesives, 29(1), 2009, 36–44.
8. da Silva, L.F.M., Carbas, R.J.C., Critchlow, G.W., Figueiredo, M.A.V., Brown, K.: Effect of material,
geometry, surface treatment and environment on
the shear strength of single lap joints. International Journal of Adhesion and Adhesives, 29(6), 2009,
621–632.
9. Prolongo, S.G., Urena, A.: Effect of surface
pre‑treatment on the adhesive strength of epoxy–
aluminium joints. International Journal of Adhesion and Adhesives, 29(1), 2009, 23–31.
10. Zielecki, W., Pawlus, P., Perłowski, R., Dzierwa, A.: Surface topography effect on strength of lap adhe‑ sive joints after mechanical pre‑treatment. Archives
of Civil and Mechanical Engineering, 13(2), 2013,
175–185.
11. Satheeshkumar, V., Ganesh Narayanan, R.: Predic‑ tion of formability of adhesive bonded steel sheets
and experimental validation. In: Archives of Civil and Mechanical Engineering, 15(1), 2015, 30–41.
12. Ebnesajjad, S.: Handbook of Adhesives and Surface Preparation – Technology Applications and Manu‑
factoring. Elsevier, 2011.
13. Spaggiari, A.: Effect of Mechanical Surface Treat‑
ment on the Static Strength of Adhesive Lap Joints. International Journal of Adhesion and Adhesives, 89(9), 2013, 677–696.
14. Ebnesajjad, S., Ebnesajjad, C.: Surface Treatment of Materials for Adhesive Bonding, 2 nd edition. Inc. Norwich, William Andrew, NY, 2013.
15. Saleema, N., Sarkar, D.K., Paynter, R.W., Gallant, D., Eskandarian, M.: A simple surface treatment and
characterization of AA 6061 aluminum alloy surface
for adhesive bonding applications. Applied Surface Science, 261(15), 2012, 742–748.
16. Rudawska, A.: Selected aspects of the effect of me‑ chanical treatment on surface roughness and adhe‑
sive joint strength of steel sheets. International Jour‑ nal of Adhesion and Adhesives, 50, 2014, 235–243. 17. Giesteira, F.A.G., Marques, E.A.S., Carbas, R.J.C.,
da Silva, L.F.M.: Prediction of Joint Strength and Ef‑
fect of the Surface Treatment on the Single Overlap
Table 6. Cochran‑Cox test results
Variant Compared methods of the surface treatment C Cα Result
I P120I – P800I 444 > 2.45 There are reasons to reject the Ho hypothesis and accept the H1
hypothesis
II P120II – P800II 1.10 < 2.77 There are no reasons to reject the Ho hypothesis
III P120III – P800III 1.64 < 2.45 There are no reasons to reject the Ho hypothesis
P120III – DIII 2.75 > 2.37 There are reasons to reject the Ho hypothesis and accept the H1
Adhesive Joints. U.Porto Journal of Engineering, 3(3), 2017, 1–16.
18. Uehara, K., Sakurai, M.: Bonding strength of adhe‑ sives and surfaces roughness of joined parts. Journal
of Materials Processing Technology, 127(2), 2002,
178–181.
19. Rudawska A.: Surface treatment in Bonding Tech‑
nology. Academic Press, 2019.
20. PN‑EN 1465:2009 – Adhesives – Determination
of tensile lap‑shear strength of bonded assemblies.
21. PN‑EN ISO 4288:2011 – Geometrical product specifications (GPS) – Surface texture: Profile method – Terms, definitions and surface texture
parameters.
22. Rozali, N.M., Wah, Y.B.: Power comparisons of Shapiro‑Wilk, Kolmogorov‑Smirnov, Lilliefors and Anderson‑Darling tests. Journal of Statistical Modeling and Analytics, 2(1), 2011, 21–33.