ISSN 2229-760X (Print) ISSN 2319-7625 (Online) Journal of Chemistry and Chemical Sciences, Vol.8(3), 524-537, March 2018
(An International Research Journal), www.chemistry-journal.org
Groundwater Remediation from Chemical and Bacteriological
Pollutants Using Modified DownFlow Hanging Reactor
Abdou Saad El-Tabl* and Mahmoud Sayed Ahmed Shahin
Chemistry Department, Faculty of Science, Menoufia University, EGYPT.
(Received on: March 12, 2018)
ABSTRACT
Groundwater is the water present below the ground surface that saturates the pore space in the subsurface. Treatment of groundwater is achieved by removing the pollutants or converting them into harmless products. The treatment of groundwater varies from community to community and even from well to well within the city depending on what contaminants today, industrial and agricultural toxic chemicals and biological pollutants pose a great threat to the safety of water supplies. Currently, the quality of groundwater with respect to pollutants is of great concern. Changed Downflow Hanging Sponge (DHS) reactor will be a decent groundwater treatment innovation sooner rather than later, it is utilized for incredible evacuation of contaminants and furthermore the reactor is simple to apply and fulfillment level. In order to achieve these objectives, treatment scheme has been investigated. It consists of mixing organic chelator with contaminated groundwater in different concentrations followed by a downflow hanging sponge (DHS) reactor. In the presence of 0.6 g/L of the chelator, the average removal of total NO3 and NO2 and total dissolved solids (TDS) are respectively 73%, 62% and 76%.The results show that, when Cd treated with chelator, the amount decreases from 0.0073 to 0.0 mgL-1 (100%) after 1 h, Cu decreases from 0.0033 to 0.0 mgL-1 (100%) after 1 h, Fe decreases from 0.4 to 0.0 mgL-1 (100%) after 1 h, Mn decreases from 0.3 to 0.0 mgL-1 (100%) after 1 h and Zn decreases from 0.013 to 0.0 mgL-1 (100%) after 1 h. Also, the results illustrate removal of fecal coliform. Decreased from 50 to 0 and the overall removal efficiency of fecal coliform is (100%).
Keywords: DHS reactor, Organic Chelator, Toxic Chemicals, Fecal Coliforms.
1. INTRODUCTION
suffers from water deficiency1.The primitive individual water supplies are mostly present in
unfortunate rural communities that depend on raw ground water, maximizing the population exposure to water pathogens. What's more, the circumstance in provincial towns includes wild and domestic animals, intensive grazing, agriculture activities and dispersed excreta from both humans and animals, which characterized the major dim resources associated with groundwater pathogens2. Therefore, water Contamination has become a serious issue in the
present situation, affecting all living creatures, household, recreation, fishing, transportation, and other commercial activities3. A huge number of natural, inorganic, and organic
contaminations have been accounted for as water contaminants3-5.Some of them have severe
side effects and toxicities with a few being lethal and carcinogenic6-8. According to the World
Health Organization (WHO) an average of 50,000 people die each day from diseases associated with contaminated water9. Drinking water utilized is either groundwater sources or
surface water sources. Almost one-fifth of all water utilized as a part of the world at exhibit is acquired from groundwater10. Groundwater is viewed as better in quality relative than surface
water as for bacteriological substance, turbidity, and aggregate natural focuses. While as for mineral substance (hardness, press, manganese), groundwater might be second rate and require extra treatment11. Metal ions such as cadmium, chromium, mercury, selenium and lead, etc.
have serious toxicities. At higher concentration than permissible limit12-15. Cobalt causes
vomiting, nausea, asthma, and carcinoma. Besides, cobalt is also responsible for thyroid, gastrointestinal, and liver problems16-18. Zinc is necessary for the growth of human being, but
high concentrations more than the allowable limit [3.0 mg/L] cause poor growth and mental fever19-21. Besides, nitrate, sulphide, phosphate, fluoride, chloride, and oxalate have also some
hazardous effects. Such as, high concentration of nitrate results into blue infants syndrome (methemoglobinemia) in youngsters22. Then again, it is notable that, fluorosis is because of
high amounts of fluoride in water23. It has been reported that, high concentrations of other
anions such as sulfate, phosphate, chloride, oxalate, etc. change water taste24. Numerous
natural pollutants have been found in various water assets. These belong to various types such as pesticides, fertilizers, hydrocarbons, phenols, plasticizers, biphenyls, detergents, oils, greases, pharmaceuticals, etc25.The side effects and toxicities of these contaminants were
reported25-27. The distinctive kinds of microorganisms present in wastewater may be
responsible for various diseases. The injurious microorganisms either in soluble, colloidal, or in suspended form are virus, bacteria, fungi, algae, amoebas, and planktons. These organisms are in charge of causing a few ailments called waterborne diseases28,29. In light of these sorts
of contamination, the surface and groundwater at some spots of the world are contaminated and not fit for drinking purposes. By 2020, the worldwide is expected to reach up to 7.9 billion30. And because of this the world may be under great water scarcity. Accordingly, the
Abdou Saad El-Tabl, et al., J. Chem. & Cheml. Sci. Vol.8(3), 524-537 (2018)
of more than 90%, resulting in a significant increase in entrapped biomass and thus longer reverses osmosis (RO). As the sponge in DHS is not submerged and unreservedly hung/noticeable all around, oxygen gets dissolved into the ground water as it flows down and therefore there is no need of aeration or any other energy input to the framework. Moreover, production of excess sludge from DHS was negligible as longer RO provides ample time for autolysis of sludge in the system itself. Ground water is streamed from the highest point of the reactor and purified by microorganisms held both inside and outside of the sponge media as the Ground water flows vertically down through the reactor. In addition, abundance slime creation from DHS was insignificant consequently eliminating secondary sludge that was troublesome to dispose of. A pilot-scale DHS (0.38 m3; volume of sponge) treating wells
ground water was investigated.
2. MATERIALS AND METHODS
2.1. Downflow Hanging Sponge (DHS) system
of the reactor is 0.88 m. The reactor will be packed with PF which represents 34% of the total liquid reactor volume. The characteristics of the PF (sponge) are surface area 256m2/m3,
density 30 kg/m3, void ratio 0.9, and pore size of 0.63 mm. The total volume of the PF will be
100 L. The extent of the utilized wipe PF (cylindrical shape) will be 27mm height × 4mm diameter. The wastewater profluent will be flowed by gravity to the distributor which will be located on the highest point of the DHS module and will be turned at 15 rpm. Chemical parameters such as chemical oxygen demand (COD), Biological oxygen demand (BOD),Total suspended solids (TSS), TDS, NO2 and NO3 will be monitored at retention time 6 h and 3h
according to American Public Health Association (APHA) (2005).
2.2. Synthesis of the organic chelator.
Tartaric acid (10.0 g, 0.067 mol) was heated (70-80 Cº) in 50 ml ethanol for 1h .Five drops of conc. H2SO4 were added, and continuous refluxed with stirring for 3h. Hydrazine
(14.0 g, 0.078mol) was added drop by drop. The mixture was refluxed with stirring for 2h and the brown precipitate formed was separated, washed with methanol and dried in air. The structure of the chelator and suggested structure of removal ions and 3D are shown in charts (1).
Chart (1): Structure of the chelator and 3D.
2.3. Measurement of organic chelator capacity in the laboratory
In order to study the chelator capacity in the laboratory, Different ratios of metal salts which are present in the groundwater with the chelator are studied (1Ch:1M, 1Ch:2M, 1Ch:3M, 1Ch:5M, 4Ch:1M) (Ch= chelator,M=metal salt). Biosorption capacity (qe) can be
estimated in mg/g as follows:
Abdou Saad El-Tabl, et al., J. Chem. & Cheml. Sci. Vol.8(3), 524-537 (2018)
Percentage of metal elimination can also be displayed by the percentage of metal elimination as follows:
Metal removal (%) = 100(Co – Ce) / Co
Metal= Cu(II), Co(II), Ni(II), Fe(II), Cd(II), Zn(II), Pb(II). Anions = Cl, SO4, (OAc) or NO3.
3. RESULTS AND DISCUSSION
When the chelator is treated with the metal ions in (1Ch:1M) molar ratio at ambient temperature, it is found that the removal efficiency after 30 min of Mn is 44.56%, Fe is 30.18%, Cd is 36.03%, Cu is 31.26%, Pb is 42.62% and Ni is 34.42%, after 60 min removal of Mn is 44.54%, Fe is 49.40%, Cd is 58.26%, Cu is 58.94%, Pb is 61.98% and Ni is 45.28%, and after 90 min of Mn is 47.83%, Fe is 49.20%, Cd is 58.91%, Cu is 58.34%, Pb is 64.18% and Ni is 48.83%,and finally after 120 min removal of Mn is 60.36%, Fe is 51.01%, Cd is 60.19%, Cu is 60.54%, Pb is 65.19% and Ni is 49.83%.The concentrations of ions against time were represented in Figure 1.
Fig.1:- Concentration difference of heavy metals at molar ratio (1Ch:1M) against time
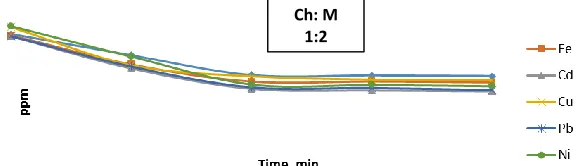
When the chelator is treated with the metal ions in (1Ch:2M) molar ratio at ambient temperature , we found that the removal efficiency after 30 min of Mn is 11%, Fe is 16.18%, Cd is 17.74%, Cu is 19.94%, Pb is 16.84% and Ni is 16.14%, and after 60 min of Mn is 21.16%, Fe is 24.03%, Cd is 27.03%, Cu is 24.42%, Pb is 26.63% and Ni is 28.98%, after 90 min of Mn is 22.32%, Fe is 24.97%, Cd is 29.22%, Cu is 27.08%, Pb is 27.94% and Ni is 30.18%, and finally after 120 min of Mn is 22.63%, Fe is 25.45%, Cd is 29.69%, Cu is 27.48%, Pb is 29.05% and Ni is 29.78%. The concentrations of ions against time were showed in Figure 2.
Figure 2:- Concentration difference of heavy metals at molar ratio (1Ch:2M) against time
When the chelator is treated with the metal ions in (1Ch:3M) molar ratio at ambient temperature, it is found that the removal efficiency after 30 min of Mn is 7.96%, Fe is 15.47%, Cd is 11.34%, Cu is 13.69%, Pb is 13.87% and Ni is 14.08%, after 60 min removal of Mn is 17.51%, Fe is 21.86%, Cd is 14.79%, Cu is 19.62%, Pb is 19.80% and Ni is 21.21%, after 90 min removal of Mn is 17.65%, Fe is 22.59%, Cd is 16.17%, Cu is 19.69%, Pb is 20.06% and Ni is 21.31%, finally after 120 min of Mn is 18.06%, Fe is 22.92%, Cd is 16.48%, Cu is 19.79%, Pb is 20.70% and Ni is 21.95%. The concentrations of ions against time were showed in Figure 3.
Figure.3:- Concentration difference of heavy metals at molar ratio (1Ch:3M) against time
When the chelator is treated with the metal ions in (1ch:5M) molar ratio at ambient temperature, it is found that the removal efficiency after 30 min of Mn is 8.74%, Fe is 9.30%, Cd is 5.69%, Cu is 8.89%, Pb is 6.61% and Ni is 8.59%, after 60 min removal of Mn is 10.70%, Fe is 13.36%, Cd is 14.31%, Cu is 12.99%, Pb is 10.47% and Ni is 11.97%, after 90 min removal of Mn is 11.74%, Fe is 13.80%, Cd is 14.39%, Cu is 13.11%, Pb is 10.63% and Ni is 12%, finally after 120 min of Mn is 11.92%, Fe is 14%, Cd is 14.62%, Cu is 12.53%, Pb is 9.79% and Ni is 11.01%. The concentrations of ions against time were showed in Figure 4.
Figure 4:- Concentration difference of heavy metals at molar ratio (1Ch:5M) against time
When the chelator is treated with the metal ions in (4ch:1M) molar ratio at ambient temperature, it is found that the removal efficiency after 30 min of Mn is 48%, Fe is 32.37%, Cd is 37.33%, Cu is 33.26%, Pb is 41.92% and Ni is 33.85%, after 60 min removal of Mn is 100%, Fe is 100%, Cd is 100%, Cu is 100%, Pb is 100% and Ni is 100%. The concentrations of ions against time were showed in Figure 5.
Ch: M 1:3
Abdou Saad El-Tabl, et al., J. Chem. & Cheml. Sci. Vol.8(3), 524-537 (2018)
Figure5:- Concentration difference of heavy metals at molar ratio (4ch:1M) against time
3.2 DHS works as post-treatment at RHT 3h without inorganic chelator
Nitrogen balance and removal efficiency
Regarding nitrogen removal, it was observed that, the mode of nitrogen removal in the DHS reactor is nitrification followed by denitrification. The nitrifies residing in the retained wastewater of DHS reactor first convert ammonia to nitrite and nitrate which are then converted to gaseous nitrogen by denitrification in the anoxic zone of the sponge material. Variations in nitrite and nitrate concentrations are shown in Figures.7 and 8 respectively. Nitrate and nitrite concentrations in the DHS effluent fluctuated between 0.2 and 0.4mg/l. Nitrification in DHS takes place in the lower segment of the reactor where the increase in the Nitrate and nitrite is because of nitrification by nitrobacteria. (Figures.10 and 11)
Fecal coliform removal
Elimination of pathogenic organisms is one of the main objectives of civic wastewater treatment for developing countries as it signifies the risk factor for public health. A lot of countries like Egypt have stringent standards regarding the presence of pathogens in groundwater as they directly affect the health and sanitation conditions of the population in the present study, fecal coliform was chosen as an indicator for pathogenic microbes. It is well understood that, anaerobic reactors does not significantly contribute to the removal of coliforms. However, relatively good results were achieved using the DHS reactor. The geometric mean of fecal coliform count in the DHS reactor effluent was reduced by 99%. The relatively higher performance could be due to adsorption and bio-filtration of fecal coliform by curtain sponge packing in the sedimentation section of the DHS reactor. Furthermore, a substantial drop of fecal coliform counts has been reported in the final effluent with residual count of 26 MF/100 ml. These results showed that, the DHS reactor is more effective for the removal of fecal coliform as compared to other aerobic systems31. It was found that, reverse
osmosis (RO) system treating groundwater achieved a reduction in fecal coliform count of 99.74%. Also, one likely reason of the higher performance of DHS reactor could be the higher amount of reserved water and long SRT. The results show that the removal efficiency of fecal coliform removal efficiencies in DHS was 94 %( 25±5CFU/100ml) where sponge bulk volume
were found to be the most important factors affecting entrapment of fecal coliform in DHS system treating. (Fig.12). Tables 1-4 show the results obtained using DHS.
Table (1):- Effect of using DHS system in performance of the results of treating ground water at a total HRT of 3h (January).
S Parameter Unit Result
Raw 1 Run 1
1 PH Unit 7.02 6.97
2 TDS Ppm 153 113
3 TOTAL HARDNESS Ppm 89 63
4 (CA) HARDNESS Ppm 53 42
5 (MG) HARDNESS Ppm 36 21
6 Nitrite (NO2) Ppm 4 3.3
7 Nitrate (NO3) Ppm 0.71 0.61 8 Fecal Coliform CFU/100mL 2 nil
The results revealed that, the average removal values of TDS,Total harddness,Ca Hardness, Mg Hardness, NO2, NO3 and Fecal Coliform are 28%, 31%, 21%, 46%,18.3%,16%
and 100% respectively.
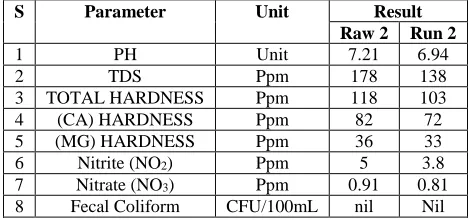
Table (2):- Effect of using DHS system in performance of the results of treating ground water at a total HRT of 3 h (May).
S Parameter Unit Result
Raw 2 Run 2
1 PH Unit 7.21 6.94
2 TDS Ppm 178 138
3 TOTAL HARDNESS Ppm 118 103
4 (CA) HARDNESS Ppm 82 72
5 (MG) HARDNESS Ppm 36 33
6 Nitrite (NO2) Ppm 5 3.8
7 Nitrate (NO3) Ppm 0.91 0.81 8 Fecal Coliform CFU/100mL nil Nil
The results revealed that, the average removal values of TDS, Total harddness, Ca Hardness, Mg Hardness, NO2, NO3 and Fecal Coliform are 24.1%, 12.01%, 13.01%,
12.21%,22.2%, 12% and 100% respectively.
Table (3):- Effect of using DHS system in performance of the results of treating ground water at a total HRT of 3h (September).
S Parameter Unit Result
Raw 3 Run 3
1 PH Unit 6.9 7.01
2 TDS ppm 152 113
3 TOTAL HARDNESS ppm 88 62
4 (CA) HARDNESS ppm 52 43
5 (MG) HARDNESS ppm 36 22
6 Nitrite (NO2) ppm 0.8 0.51
7 Nitrate (NO3) ppm 3 2.1
Abdou Saad El-Tabl, et al., J. Chem. & Cheml. Sci. Vol.8(3), 524-537 (2018)
The results revealed that, the average removal values of TDS, Total harddness, Ca Hardness, Mg Hardness, NO2, NO3 and Fecal Coliform are 27.01%, 24.05%, 19.31%,
45%,37.51%,34% and 90% respectively.
Table (4):- Effect of using DHS system in performance of the results of treating ground water at a total HRT of 3 h (December).
S Parameter Unit Result
Raw 1 Run 1
1 PH Unit 7.01 6.98
2 TDS ppm 168 120
3 TOTAL HARDNESS ppm 92 62
4 (CA) HARDNESS ppm 53 40
5 (MG) HARDNESS ppm 39 22
6 Nitrite (NO2) ppm 3.1 2.9
7 Nitrate (NO3) ppm 0.9 0.7
8 Fecal Coliform CFU/100mL 1 nil
The results revealed that, the average removal values of TDS, Total harddness, Ca Hardness, Mg Hardness, NO2, NO3 and Fecal Coliform are 49%, 33%, 25%, 43.6%, 16.5%,
23% and 100% respectively.
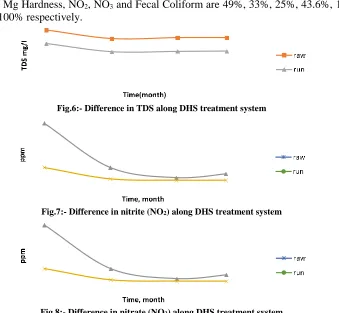
Fig.6:- Difference in TDS along DHS treatment system
Fig.7:- Difference in nitrite (NO2) along DHS treatment system
Fig.8:- Difference in nitrate (NO3) along DHS treatment system
Fig.7:- Difference in nitrite (NO
Fig.9:- Difference in Fecal Coliform along DHS treatment system
3.3. DHS work as post-treatment at RHT 3h in presence of chelator (at dose 0.3 gL-1
from the chelator)
Table (5):- Performance results of DHS system in treating ground water at a total HRT of 3 h (at dose 0.2 gL-1 from the chelator).
S Parameter Unit Result Efficiency Raw Run
1 PH Unit 7.01 7
2 TDS ppm 152 79 48%
3 TOTAL HARDNESS ppm 88 39 55%
4 (CA) HARDNESS ppm 52 31 39%
5 (MG) HARDNESS ppm 36 7.9 78.% 6 Nitrite (NO2) ppm 1.2 0.83 30.2% 7 Nitrate (NO3) ppm 1.13 0.61 47%
In the presence of 0.2 g/L of the chelator, the results indicated that, the average elimination values of TDS, Total Hardness, Ca Hardness, Mg Hardness, NO2, NO3 and Fecal
Coliform are 48%, 55%, 39%, 78%, 30.2% and 47% respectively.
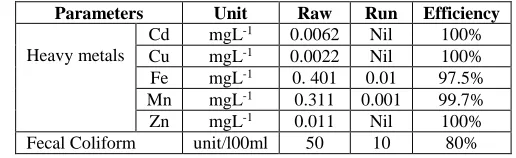
Table (6): Performance results of heavy metals and fecal coliform removal at 0.3g/l of chelator.
Parameters Unit Raw Run Efficiency
Heavy metals
Cd mgL-1 0.0062 Nil 100% Cu mgL-1 0.0022 Nil 100% Fe mgL-1 0. 401 0.01 97.5% Mn mgL-1 0.311 0.001 99.7% Zn mgL-1 0.011 Nil 100% Fecal Coliform unit/l00ml 50 10 80%
The efficiency removal of heavy metals
The results show that, the residual values of heavy metals are Cd when treated with chelator, the amount decreases from 0.0061 to 0.0 mgL-1 (100%), Cu decreases from 0.0022
to 0.0 mgL-1 (100%), Fe decreases from 0.4 to 0.0.011 mgL-1 (97.5%), Mn decreases from 0.3
to 0.001 mgL-1 (99.79 %), Zn decreases from 0.011 to 0.0 mgL-1(100%). Particles of heavy
Abdou Saad El-Tabl, et al., J. Chem. & Cheml. Sci. Vol.8(3), 524-537 (2018)
will be then occurred in the land. Available data indicates good performance of the chelator regard to heavy metals removal efficiency.
Bacterial removal
The results show that, the residual values of fecal coliform when treated with chelator, the amount decreases from 55 to 10 CFU /100 ml (82%).
Fig. (10): Concentration difference in heavy metals along raw and treated groundwater.
3.4. DHS work as post-treatment at RHT 3h in presence of chelator (0.6 gL -1 from the
chelator).
Table (7): Recital results of heavy metals removal at 0.5 g/l of chelator.
S Parameter Unit Result Efficiency Raw Run
1 PH Unit 6.93 7.02
2 TDS ppm 208 159 75%
3 TOTAL HARDNESS ppm 111 55.3 78% 4 (CA) HARDNESS ppm 58.6 29.31 68% 5 (MG) HARDNESS ppm 56.8 25.91 66% 6 Nitrite (NO2) ppm 1 0.22 62%
7 Nitrate (NO3) ppm 13 2 72%
In the presence of 0.5 g/L of the chelator, the results revealed that, the average removal values of TDS, total hardness, Nitrite and Nitrate are 75%, 78%, 62% and 72% respectively.
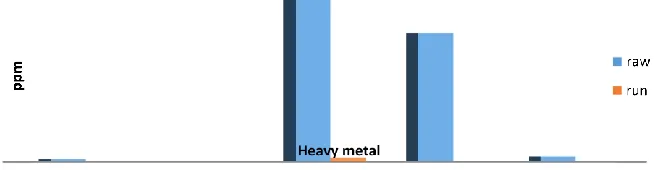
Table (9): Recital results of heavy metals removal at 0. 6 g/l of the chelator.
Parameters Unit Raw Run Efficiency
Heavy metals
Cd mgL-1 0.0062 0 100%
Cu mgL-1 0.0022 0 100%
Fe mgL-1 0. 41 0 100%
Co mgL-1 0.32 0 100%
Zn mgL-1 0.011 0 100%
Fecal Coliform CFU/l00ml 50 0 100%
The efficiency of heavy metals removal
to 0.0 mgL-1 (100%), Fe decreases from 0.4 to 0.0 mgL-1 (100%), Mn decreases from 0.3 to
0.0 mgL-1 (100%), Zn decreases from 0.012 to 0.0 mgL-1 (100%).
Bacterial Removal
The results show that the residual values of fecal coliform when treated with chelators, the amount decreases from 50 to 0 MF /100 ml (100%).
Fig. (11): Deviation in heavy metals concentrations along raw and treated groundwater.
4. CONCLUSION
Develop the quality of treated water with low cost. It is safe to be used for drinking water. In this study, DHS was used for direct treatment of ground water in the presence of chelator in removal of NO2, NO3 and fecal coliform at fixed hydraulic retention time (3h and
6h) based on the sponge volume. Also, this study illustrate tremendous reduce in NO2, NO3
and fecal coliform (up to 99 %). This study showed that the smaller the sponge sizes of the DHS reactor, the better the treatment efficiency. So we can use DHS in small village that cannot be serviced by city water network as secondary treatment for ground water.
REFERENCES
1. Tema, W. Introducing water education through non-formal channels. in Water Education in African Cities; Report of an Expert Group Meeting, Johannesburg. (2001).
2. Supply, W., S.C. Council, and UNICEF, Global water supply and sanitation assessment 2000 report: summary of the report, in Global water supply and sanitation assessment 2000 report: summary of the report. (2000).
3. Metcalf, et al., Wastewater engineering: treatment and reuse. McGraw Hill (2003). 4. Droste, R.L., Theory and practice of water and wastewater treatment. John Wiley & Sons
Incorporated (1997).
Abdou Saad El-Tabl, et al., J. Chem. & Cheml. Sci. Vol.8(3), 524-537 (2018)
6. Ali, I. and H. Aboul-Enein, Instrumental methods in metal ions speciation: Chromatography, Capillary Electrophoresis and Electrochemistry. Taylor & Francis Ltd., New York, USA (2006).
7. John, D.Z., Handbook of drinking water quality: Standards and controls. Vannostrand Reinhold, New York, (1990).
8. Taheri, E., et al., Evaluation of the influence of conventional water coolers on drinking water quality. Iranian Journal of Health and Environment, 2(4): p. 268-275 (2010). 9. Rahman, M.M., G. Owens, and R. Naidu, Arsenic levels in rice grain and assessment of
daily dietary intake of arsenic from rice in arsenic-contaminated regions of Bangladesh— implications to groundwater irrigation. Environmental Geochemistry and Health, 31(1): p. 179-187 (2009).
10. Network, E.s.W.I., EPA’s Watershed Information Network. p. 354-367 (2004).
11. Letterman, R., American Water Works Association: Water Quality and Treatment. A
Handbook of Community Water Supplies, 5th edn., McGraw-Hall, New York, (1999).
12. Ali, I., H.Y. Aboul-Enein, and V.K. Gupta, Nanochromatography and nanocapillary electrophoresis: pharmaceutical and environmental analyses. John Wiley & Sons (2009). 13. Duffus, J.H., " Heavy metals" a meaningless term?(IUPAC Technical Report). Pure and
Applied Chemistry, 74(5): p. 793-807 (2002).
14. Vettorazzi, G., International regulatory aspects for pesticide chemicals. Vol. I. Toxicity
Profiles. CRC Press Inc (1979).
15. Zhu, C., et al., Removal of cadmium from aqueous solutions by adsorption on granular red mud (GRM). Separation and Purification Technology, 57(1): p. 161-169 (2007). 16. Ali, I., New generation adsorbents for water treatment. Chemical Reviews, 112(10): p.
5073-5091 (2012).
17. Pérez-Marín, A., et al., Removal of cadmium from aqueous solutions by adsorption onto orange waste. Journal of Hazardous Materials, 139(1): p. 122-131 (2007).
18. Zhang, F.-S., J.O. Nriagu, and H. Itoh, Mercury removal from water using activated carbons derived from organic sewage sludge. Water Research,39(2): p. 389-395 (2005). 19. Bayramoğlu, G. and M.Y. Arica, Kinetics of mercury ions removal from synthetic aqueous
solutions using by novel magnetic p (GMA-MMA-EGDMA) beads. Journal of Hazardous
Materials, 144(1): p. 449-457 (2007).
20. Onodera, T., et al., Development of a sixth-generation down-flow hanging sponge (DHS) reactor using rigid sponge media for post-treatment of UASB treating municipal sewage.
Bioresource technology, 152: p. 93-100 (2014).
21. Sigel, H., Metal Ions in Biological Systems: Concepts on Metal Ion Toxicity. Vol. 20. CRC Press (1986).
22. Sharma, Y., et al., Nano‐adsorbents for the removal of metallic pollutants from water and wastewater. Environmental Technology, 30(6): p. 583-609 (2009).
24. Weng, C.-H. and C. Huang, Adsorption characteristics of Zn (II) from dilute aqueous solution by fly ash. Colloids and Surfaces A: Physicochemical and Engineering Aspects, 247(1): p. 137-143 (2004).
25. Ören, A.H. and A. Kaya, Factors affecting adsorption characteristics of Zn 2+ on two natural zeolites. Journal of Hazardous Materials,131(1): p. 59-65 (2006).
26. Kross, B., A. Ayebo, and L. Fuortes, Methemoglobinemia: nitrate toxicity in rural America. American Family Physician, 46(1): p. 183-188 (1992).
27. Organization, W.H., Guidelines for drinking-water quality. Vol. 1. World Health Organization (2004).
28. Barceló, D., Emerging organic pollutants in waste waters and sludge. Vol. 5. Springer Science & Business Media (2005).