R E S E A R C H
Open Access
The value of left ventricular strain
–
volume
loops in predicting response to cardiac
resynchronization therapy
Mengruo Zhu
1,2, Haiyan Chen
1, Zibire Fulati
1, Yang Liu
1, Yangang Su
2and Xianhong Shu
1,2*Abstract
Background:Three-dimensional (3D) speckle tracking imaging (STI) allows the simultaneous assessment of left
ventricular (LV) strain and volume. We aim to explore the value of LV strain–volume loops in predicting response to cardiac resynchronization therapy (CRT).
Methods:Forty heart failure (HF) patients scheduled for CRT and twenty healthy individuals were enrolled. All
subjects received a 3D echocardiography and 3D STI analysis to acquire LV global and segmental principal strain (PS) and volume simultaneously. Values were plotted in a Cartesian system to construct PS–volume loop which was assessed using the two characteristics of the linear fitting curve: the slope and the coefficient of determination (R2 -S/D coupling).
Results:HF patients at baseline showed significantly lower slope and R2-S/D coupling of all PS–volume loops than
healthy subjects. As for as comparing Segmental PS–Global volume loop at baseline, Midseptal R2-S/D coupling was lower and Midlateral slope was higher in CRT responders than in non-responders. For each individual, the abnormal segmental heterogeneity of Midseptal slope and R2-S/D coupling were lower than Midlateral was observed only in responders. At follow-up, significant improvements of the Midseptal slope and R2-S/D coupling were observed in responders. Midseptal R2-S/D coupling at baseline was an independent predictor of CRT response and the cut-off value of 0.55 was recommended with sensitivity of 89% and specificity of 77%.
Conclusions:Analysis of strain–volume loops could provide unique information for predicting response to CRT.
Assessment of septal myocardial wasted work at baseline is helpful to improve patient selection for CRT.
Keywords:Cardiac resynchronization therapy, Heart failure, Strain–volume loop, Segmental heterogeneity, Wasted
septal work
Introduction
Cardiac resynchronization therapy (CRT) is an estab-lished treatment for patients with dyssynchronous heart failure (DHF) [1], meanwhile growing evidence supports that the secondary changes of CRT in molecular and cel-lular play an important role in reversing left ventricular (LV) remodeling. Previous study [2] has demonstrated that molecular polarization within the dyssynchronous
LV was consistent with segmental heterogeneity of cardial load distribution. Strain describes exactly myo-cardial deformation under the action of hemodynamic load. However, most of segmental strain analysis pro-posed previously [3] neglected the dynamic relationship of strain with volume load changing across the cardiac
cycle. As suggested in Carasso’s study [4], LV segmental
strain–time curve morphology is actually highly
predict-ive of response to CRT, while the same values of strain peaks or timings could be observed with different strain curve morphologies [5].
In our study, we hypothesized that the new approach,
based on the simultaneous strain–volume analysis which
combining temporal changing data from function and
* Correspondence:shu.xianhong@zs-hospital.sh.cn
1Department of Echocardiography, Zhongshan Hospital, Fudan University,
Shanghai Institute of Cardiovascular Diseases, Shanghai Institute of Medical Imaging, 180 Fenglin Road, Shanghai 200032, China
2Department of Cardiology, Zhongshan Hospital, Fudan University; Shanghai
Institute of Cardiovascular Diseases, 180 Fenglin Road, Shanghai 200032, China
structure, could provide unique information for predict-ing CRT response. Three-dimensional (3D) speckle tracking imaging (STI) allows the simultaneous evalu-ation of cardiac principal strain (PS) and volume changes frame-by-frame. Since 3D PS overcoming limi-tations of geometry-dependent reference directions (i.e.
longitudinal, radial, and circumferential) [6, 7], it has
been proven that 3D PS correlated well with cardiac muscle fiber arrangements and could more accurately
detect regional myocardial mechanical alterations [8,9].
To validate our hypothesis, data of each patient across one cardiac cycle were plotted in a Cartesian system to
develop the PS–volume loop which was analyzed by two
characteristics of the linear fitting curve: the slope and the coefficient of determination which reflecting the
de-gree of systolic–diastolic coupling (R2-S/D coupling).
Slope reflects dynamic relationship between strain
re-sponses alongside volume changing. As to the R2-S/D
coupling, the smaller its value is, the severer the degree
of systolic–diastolic uncoupling is, which indicating that
(global or segmental) myocardial efficiency reduced in dyssynchronous LV because myocardial systolic
shorten-ing and diastolic lengthenshorten-ing doesn’t synchronize with
chamber volume decreasing and increasing.
Methods
Study population
A total of 40 consecutive HF patients who were firstly scheduled for CRT were prospectively enrolled. Indica-tions for CRT according to the 2016 European Society of Cardiology (ESC) guidelines [10] were as follow:
symp-tomatic patients with HF with a QRS duration ≥130 ms
and LVEF≤35%, in NYHA functional class III or IV
des-pite optimal medical treatment. Patients were excluded for the following reasons: narrow QRS, right bundle branch block (RBBB), a history of cardiac surgery, absence of clinical follow-up and poor echocardiography images. Left bundle branch block (LBBB) was diagnosed according to the criteria proposed by 2013 ESC guidelines [11] Class 1 Recommendation for CRT, namely a wide QRS duration with QS or rS in V1, broad (frequently notched or slurred) R wave in leads I, aVL, V5 or V6, and absence of q waves in leads V5 and V6. Intraventricular conduction delay [12] was diagnosed as non-specific manner QRS morphology that did not fit the criteria for LBBB and RBBB. Response to CRT was defined as a reduction in LV end-systolic
vol-ume≥15% at 6-month follow-up in comparison with
baseline value measured by echocardiography.
Control subjects, matched for age and gender, were se-lected without documented cardiovascular diseases and history of cardiovascular medication and with normal cardiac function using the American Society of Cardi-ology (ASE) guidelines for cardiac chamber quantifica-tion [13].
This study was approved by the medical ethics com-mittee of our hospital, and informed consent was ob-tained from all subjects.
Echocardiography
All subjects in the left lateral decubitus, with a
syn-chronous Electrocardiogram connected, underwent
transthoracic echocardiography using a Philips iE33 ultrasound machine (Philips Medical Systems,
Eindho-ven, The Netherlands) equipped with a S5–1 and X3–1
probe. A complete and standard 2D echocardiographic assessment and real-time 3D echocardiography were performed on HF patients before CRT device implant-ation and then 6-month follow-up after CRT as well as healthy controls.
Two-dimensional echocardiography
Conventional 2D, M-mode and Doppler echocardio-graphic parameters were measured according to the rec-ommendations of ASE guidelines [13].
Three-dimensional speckle-tracking imaging
3D images were imported to the 4D speckle-tracking worksta-tion, TomTec-Image Arena 4D Cardiac Performance Analysis; TomTec Imaging System, GMBH, Germany) and analyzed ac-cording to the following steps: First, the best cardiac cycle of the full-volume 3D acquisition was chosen, orientating one refer-ence point to the aortic valve annulus in short-axis referrefer-ence plane and two reference points to make line markers centered in LV cavity from apex to mitral valve annulus in the three ap-ical views (four-chamber, two-chamber and long-axis) to allow the LV long axis was designated and an exact volume recon-struction. Then the software automatically distinguished the LV endocardial border and tracked it for an entire cardiac cycle. An epicardial surface tracing could be generated by the system, which was manually adjusted to cover the full thickness of the LV wall. Before processing, a cine loop preview feature visually confirmed that the internal line followed the endocardium throughout the cardiac cycle. If tracking of the LV wall was un-satisfactory, manual adjustments were made. Last, the curves of global volume, 16 segmental volume and PS were produced
automatically using the standard 16-segment model (Fig. 1).
Global PS was calculated by averaging 16 segmental strain com-ponents. LV end-diastolic frame time and end-systolic frame time were located as the onset of QRS wave and the end of T wave respectively according to the electrocardiogram, which identified by the software automatically.
16 segments. Corrected by the R-R interval, the standard deviation of time to peak PS (TpPS-SD%) and the stand-ard deviation of time to minimum systolic volume
(Tmsv-SD%) were calculated using the standard
16-segment model.
Strain–volume loop reconstruction
The raw data were exported to a spreadsheet (Excel, Microsoft Corp, Washington, US). For each individ-ual, data were plotted as PS (y-axis) against volume (x-axis) of each frame in a Cartesian system to
de-velop the PS–volume loop across one cardiac cycle
including systolic and diastolic components which was distinguished by the end-systolic frame time
de-termined by the electrocardiogram: Global PS–Global
volume loop, Segmental (Midseptal and Midlateral)
PS–Global volume loop, as well as Segmental PS–
Seg-mental volume loop including Midseptal PS–
Midsep-tal volume loop and Midlateral PS–Midlateral volume
loop (Fig. 2).
A linear fitting line was applied to each PS–volume
loop and a polynomial regression analysis of the order y = kx + c was performed on the linear fitting line. The
PS–volume loop was analyzed by two characteristics of
the linear fitting curve: the slope and the coefficient of
determination (R2-S/D coupling).
Inter- and intra-observer variability
Inter- and intra-observer variability of all 3D
speckle-tracking imaging measures were assessed using
Bland-Altman plots (Fig.3) with data from 10 randomly
selected study 3D images, examined twice by a second observer who was blinded to the values obtained by the first observer and by one observer twice who was blinded to the results of the previous measurements, respectively.
Statistics analysis
Continuous data are expressed as mean ± SD and dichot-omous data as numbers and percentages. Dichotomized comparisons were assessed using Chi-square test or Fisher exact test as appropriate. Comparisons of values between control group and HF patients or values be-tween responders and non-responders at baseline or
6-month follow-up were performed using the
Independent-Samples T Test, while intragroup (re-sponders or non-re(re-sponders) comparisons of values
be-tween baseline state and 6-month follow-up, or
characteristics of PS–volume loops between Midseptal
and Midlateral were performed using the Paired -Sam-ples T Test. To determine independent predictors of
re-sponse to CRT, logistic regression analysis was
performed. Significant variables selected in univariate lo-gistic regression analysis (P< 0.05) were entered into the multivariate analysis. The optimal cut-off value which combine the higher value of specificity plus sensitivity was obtained through receiver operating characteristic (ROC) curve. Correlations between two variables were analyzed using Pearson’s test.
A two-sidedP value < 0.05 was accepted as indicating
statistical significance. All data were analyzed using SPSS version 24.0 (SPSS Inc., Chicago, IL, USA) and MedCalc
version 12.5.0.0 (MedCalc Software, Mariakerke,
Belgium).
Results
Study population
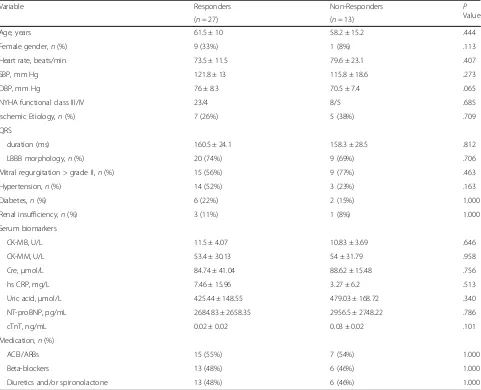
Twenty healthy subjects (62.9 ± 8.8 years, 30% female, 74.3 ± 9.5 beats/min) as control group and forty HF patients scheduled for CRT (60.3 ± 11.9 years, 25% female, 75.6 ± 16.3 beats/min) were included in this study. Of the 40 HF patients at 6-month follow-up, 27 patients (68%) were classified as responders while 13 patients (32%) were classified as non-responders. Baseline
clinical characteristics of CRT responders versus
non-responders are shown in Table1, but no significant differ-ences were observed in baseline clinical characteristics between them. Comparisons of 2D and 3D echocardiographic character-istics between controls and HF patients as well as between CRT responders and non-responders at baseline and at follow-up are
presented in Table 2. Obviously, most structural parameters
been significantly impaired in HF patients at baseline evaluation when compared with the control group. All HF patients were on stable, optimal medical treatment according to the ESC guidelines [10]. Baseline echocardiographic characteristics were comparable between responders and non-responders, except for better response among those patients with smaller LVESD and LVEDV. At 6-month follow-up, responders showed a sig-nificant decrease in LV size (diameter and volume) and LV dys-synchrony indices (TpPS-SD% and Tmsv-SD%), and a significant increase in the absolute value of GLS and GCS, whereas non-responders didn’t have any significant changes.
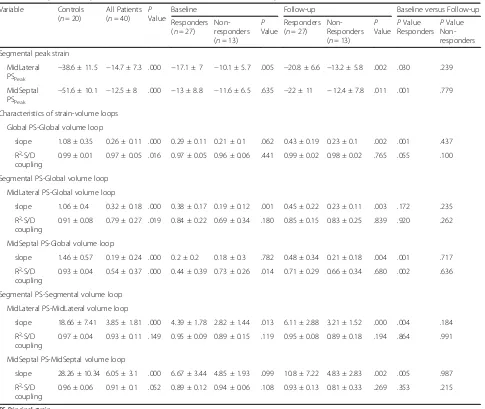
Peak strain and strain–volume loop
Comparisons of peak strain and characteristics of
strain–volume loops between controls and HF patients
as well as between CRT responders and non-responders
at baseline and at follow-up are shown in Table3.
Com-parisons of peak strain and characteristics of strain–
vol-ume loops between Midlateral and Midseptal are shown
in Table4.
Baseline evaluation
HF patients showed significantly reduced Midlateral and
Midseptal peak PS than the control group (allP< 0.001)
(Table3). All kinds of PS–volume loops in control group
were very steep and strong systolic–diastolic coupling
(R2-S/D coupling) (Table 3). Obviously, the slope and
R2-S/D coupling of Global PS–Global volume loop and
Segmental (Midlateral and Midseptal) PS–Global volume
loop in HF patients were significantly reduced when
compared with that in controls (all P< 0.05) (Table 3).
The same observations were showed in the slope of Table 1Baseline clinical characteristics of CRT responders versus non-responders
Variable Responders Non-Responders P
Value
(n= 27) (n= 13)
Age, years 61.5 ± 10 58.2 ± 15.2 .444
Female gender,n(%) 9 (33%) 1 (8%) .113
Heart rate, beats/min 73.5 ± 11.5 79.6 ± 23.1 .407
SBP, mm Hg 121.8 ± 13 115.8 ± 18.6 .273
DBP, mm Hg 76 ± 8.3 70.5 ± 7.4 .065
NYHA functional class III/IV 23/4 8/5 .685
Ischemic Etiology,n(%) 7 (26%) 5 (38%) .709
QRS
duration (ms) 160.5 ± 24.1 158.3 ± 28.5 .812
LBBB morphology,n(%) 20 (74%) 9 (69%) .706
Mitral regurgitation > grade II,n(%) 15 (56%) 9 (77%) .463
Hypertension,n(%) 14 (52%) 3 (23%) .163
Diabetes,n(%) 6 (22%) 2 (15%) 1.000
Renal insufficiency,n(%) 3 (11%) 1 (8%) 1.000
Serum biomarkers
CK-MB, U/L 11.5 ± 4.07 10.83 ± 3.69 .646
CK-MM, U/L 53.4 ± 30.13 54 ± 31.79 .958
Cre,μmol/L 84.74 ± 41.04 88.62 ± 15.48 .756
hs CRP, mg/L 7.46 ± 15.96 3.27 ± 6.2 .513
Uric acid,μmol/L 425.44 ± 148.55 479.03 ± 168.72 .340
NT-proBNP, pg/mL 2684.83 ± 2658.35 2956.5 ± 2748.22 .786
cTnT, ng/mL 0.02 ± 0.02 0.03 ± 0.02 .101
Medication,n(%)
ACEI/ARBs 15 (55%) 7 (54%) 1.000
Beta-blockers 13 (48%) 6 (46%) 1.000
Diuretics and/or spironolactone 13 (48%) 6 (46%) 1.000
ACEIAngiotensin converting enzyme inhibitor,ARBAngiotensin receptor blocker,CK-MBCreatine kinase MB fraction,CK-MMCreatine kinase MM fraction,Cre
Creatinine,cTnTCardiac troponinT,DBPDiastolic blood pressure,hs CRPHigh sensitive C-reactive protein,LBBBLeft bundle branch block,NT-proBNPN-terminal of
the prohormone brain natriuretic peptide,NYHANew York Heart Association,SBPSystolic blood pressure
Midlateral PS–Midlateral volume loop and Midseptal
PS–Midseptal volume loop in HF patients (allP< 0.001),
but R2 - S/D coupling of both were similar to that in
healthy subjects (allP> 0.05) (Table3).
Midlateral peak PS was significantly higher in
re-sponders than in non-rere-sponders (−17.1 ± 7 vs. -10.1 ±
5.7, P= 0.005), but the difference of Midseptal peak PS
didn’t reach statistical significance (P= 0.635) (Table3).
The slope and R2-S/D coupling of Global PS–Global
vol-ume loop were comparable between responders and
non-responders (all P> 0.05) (Table 3). However,
re-sponders showed significantly lower R2-S/D coupling of
the Midseptal PS–Global volume loop (P= 0.014) as well
as higher slope of the Midlateral PS–Global volume loop
(P= 0.001) and higher slope of the Midlateral PS–
Mid-lateral volume loop (P= 0.013) in comparison with
non-responders (Table3).
For each individual, segmental peak PS and
charac-teristics of PS–volume loops between the septal and
lateral wall were heterogeneous, which was even ob-served in healthy subjects with Midseptal peak PS
and slope of Midseptal PS–Global volume loop were
significantly higher than those of Midlateral (P< 0.001
and P= 0.002, respectively) (Table 4). Whereas in
CRT responders at baseline, although difference of peak PS between Midseptal and Midlateral did not
reach statistical significance, the slope and R2-S/D
coupling of the Midseptal PS–Global volume loop
were significantly lower than those of Midlateral PS–
Global volume loop (P= 0.002 and P< 0.001,
respect-ively) (Table 4). This abnormal segmental
heterogen-eity, contrary to the septal-lateral relationship in healthy subjects, was observed only in CRT re-sponders but not in non-rere-sponders at baseline. Table 3Comparisons of peak strain and characteristics of strain-volume loops
Variable Controls
(n= 20)
All Patients
(n= 40) PValue
Baseline Follow-up Baseline versus Follow-up
Responders
(n= 27)
Non-responders
(n= 13)
P
Value
Responders
(n= 27)
Non-Responders
(n= 13)
P
Value P
Value
Responders P
Value Non-responders
Segmental peak strain
MidLateral
PSPeak
−38.6 ± 11.5 −14.7 ± 7.3 .000 −17.1 ± 7 −10.1 ± 5.7 .005 −20.8 ± 6.6 −13.2 ± 5.8 .002 .030 .239
MidSeptal
PSPeak
−51.6 ± 10.1 −12.5 ± 8 .000 −13 ± 8.8 −11.6 ± 6.5 .635 −22 ± 11 −12.4 ± 7.8 .011 .001 .779
Characteristics of strain-volume loops
Global PS-Global volume loop
slope 1.08 ± 0.35 0.26 ± 0.11 .000 0.29 ± 0.11 0.21 ± 0.1 .062 0.43 ± 0.19 0.23 ± 0.1 .002 .001 .437
R2-S/D
coupling
0.99 ± 0.01 0.97 ± 0.05 .016 0.97 ± 0.05 0.96 ± 0.06 .441 0.99 ± 0.02 0.98 ± 0.02 .765 .055 .100
Segmental PS-Global volume loop
MidLateral PS-Global volume loop
slope 1.06 ± 0.4 0.32 ± 0.18 .000 0.38 ± 0.17 0.19 ± 0.12 .001 0.45 ± 0.22 0.23 ± 0.11 .003 .172 .235
R2-S/D
coupling
0.91 ± 0.08 0.79 ± 0.27 .019 0.84 ± 0.22 0.69 ± 0.34 .180 0.85 ± 0.15 0.83 ± 0.25 .839 .920 .262
MidSeptal PS-Global volume loop
slope 1.46 ± 0.57 0.19 ± 0.24 .000 0.2 ± 0.2 0.18 ± 0.3 .782 0.48 ± 0.34 0.21 ± 0.18 .004 .001 .717
R2-S/D
coupling
0.93 ± 0.04 0.54 ± 0.37 .000 0.44 ± 0.39 0.73 ± 0.26 .014 0.71 ± 0.29 0.66 ± 0.34 .680 .002 .636
Segmental PS-Segmental volume loop
MidLateral PS-MidLateral volume loop
slope 18.66 ± 7.41 3.85 ± 1.81 .000 4.39 ± 1.78 2.82 ± 1.44 .013 6.11 ± 2.88 3.21 ± 1.52 .000 .004 .184
R2-S/D
coupling
0.97 ± 0.04 0.93 ± 0.11 .149 0.95 ± 0.09 0.89 ± 0.15 .119 0.95 ± 0.08 0.89 ± 0.18 .194 .864 .991
MidSeptal PS-MidSeptal volume loop
slope 28.26 ± 10.34 6.05 ± 3.1 .000 6.67 ± 3.44 4.85 ± 1.93 .099 10.8 ± 7.22 4.83 ± 2.83 .002 .005 .987
R2-S/D
coupling
0.96 ± 0.06 0.91 ± 0.1 .052 0.89 ± 0.12 0.94 ± 0.06 .108 0.93 ± 0.13 0.81 ± 0.33 .269 .353 .215
PSPrincipal strain
Segmental heterogeneity between Midlateral PS–
Mid-lateral volume loop and Midseptal PS–Midseptal volume
loop at baseline didn’t differ among three groups with
the slope of the Midseptal PS–Midseptal volume loop
was significantly higher than that of Midlateral PS–
Mid-lateral volume loop (allP< 0.001) and no significant
dif-ferences were observed in R2 - S/D coupling between
them (allP> 0.05) (Table4).
Changes at follow-up after CRT
At 6-month follow-up, significant improvements in Mid-septal and Midlateral peak PS, as well as in the slope of
Global PS–Global volume loop, Midseptal PS–Global
vol-ume loop, Midlateral PS–Midlateral volume loop and
Midseptal PS–Midseptal volume loop were observed only
in CRT responders (all P< 0.05) but non-responders
didn’t show any significant changes (Table3). As a result,
Midseptal peak PS as well as the slope of Global PS–
Glo-bal volume loop, Midseptal PS–Global volume loop and
Midseptal PS–Midseptal volume loop showed significantly
higher values in responders than in non-responders (allP
< 0.05) while there was no significant difference at baseline (Table3).
Similarly, the R2-S/D coupling of the Midseptal PS–
Global volume loop significantly improved only in
re-sponders (P= 0.002), so that R2-S/D coupling of
Midsep-tal PS–Global volume loop in CRT responders is no
longer lower than that in non-responders (baseline vs.
follow-up: P= 0.014 vs. P= 0.680) (Table 3). Although
segmental heterogeneity of R2-S/D coupling between
Midseptal PS–Global volume loop and the Midlateral
PS–Global volume loop was still existed in CRT
re-sponders, it attenuated to a great extent (baseline vs. follow-up: P< 0.001 vs.P= 0.025) (Table 4). Besides, re-sponders no longer showed abnormal segmental
hetero-geneity of slope between Midseptal PS–Global volume
loop and Midlateral PS–Global volume loop at
follow-up (baseline vs. follow-up:P= 0.002 vs.P= 0.469)
(Table4).
Analyses to identify baseline predictors of response to CRT
Logistic regression analysis was performed to identify
in-dependent predictors of response to CRT (Table 5). All
variables significantly associated with CRT response in
univariate regression analysis were involved in
Table 5Analyses to identify baseline predictors of response to CRT
Variable Univariate Analysis Multivariate Analysis
OR 95% CI P OR 95% CI P
Age 1.011 1.000–1.023 .054
Female 7.071 0.774–64.575 .083
QRS duration 1.004 0.976–1.032 .806
LBBB 1.417 0.310–6.470 .653
NYHA class III 1.800 0.380–8.535 .459
Nonischemic Etiology 1.633 0.383–6.968 .508
NT-proBNP 1.006 0.990–1.020 .340
hs CRP 1.001 1.000–1.070 .420
LVESD 1.009 0.998–1.020 .123
LVEDV 1.001 0.999–1.004 .330
LVEF 1.003 0.930–1.082 .939
GLS 0.892 0.809–0.984 .022 0.820 0.490–0.995 .190
GCS 0.922 0.852–0.997 .042 0.962 0.657–1.000 .660
TpPS-SD% 1.006 0.999–1.013 .112
Tmsv-SD% 1.007 1.002–1.015 .048 1.002 1.000–1.001 .120
SDI 0.978 0.958–0.999 .041 0.990 0.680–1.000 .240
MidLateral PSPeak 0.818 0.697–0.960 .014 0.890 0.550–0.980 .150
Slope of MidLateral PS- Global volume loop 3.934 2.863–6.444 .016 2.880 1.230–6.700 .470
R2-S/D coupling of MidSeptal PS-Global volume loop 0.803 0.760
–0.880 .009 0.878 0.810–0.930 .028
Slope of MidLateral PS-MidLateral volume loop 2.035 1.104–3.750 .023 1.796 0.980–3.000 .200
CIConfidence interval,GCSGlobal circumferential strain,GLSGlobal longitudinal strain,hs CRPHigh sensitive C-reactive protein,LVEDVLeft ventricular
end-diastolic volume,LVESDLeft ventricular end-systolic diameter,NT-proBNPN-terminal of the prohormone brain natriuretic peptide,OROdd ratio,PSPrincipal strain,
SDIStrain delay index,Tmsv-SD%Standard deviation of time to minimum systolic volume corrected by R-R interval,TpPS-SD%Standard deviation of time to peak
multivariate regression analysis. R2-S/D coupling of
Mid-septal PS–Global volume loop at baseline (odds ratio
0.878, 95% CI 0.810–0.930, P= 0.028) was found to be
an independent predictor of CRT response. The area
under the ROC curve (AUC) of R2-S/D coupling of
Mid-septal PS–Global volume loop was greater than that of
TpPS-SD%, Tmsv-SD% and SDI (all P< 0.05) (Fig. 4).
The optimal cut-off value of R2-S/D coupling was
rec-ommended as 0.55 (AUC value, 0.856; sensitivity, 89%; specificity, 77%) which determined by ROC curve.
Be-sides, R2-S/D coupling of Midseptal PS–Global volume
loop at baseline was significant correlated with percent-age change in LVESV (△LVESV%) at 6-month follow-up in comparison with baseline value (r=−0.647,P< 0.001) (Fig.5).
Discussion
The aim of our study was to explore whether the LV
strain–volume loops, a novel approach linking the
struc-tural changes to functional alterations, could provide a new perspective for assessing LV remodeling in HF pa-tients and reverse remodeling following CRT, in the hope of offering additional information for predicting re-sponse to CRT and exploiting additive value of this ap-proach in selection of CRT candidates.
It has been demonstrated in our study that the abso-lute value of GLS, GCS increased and LV mechanical dyssynchrony indices (TpPS-SD% and Tmsv-SD%) re-duced after CRT. However, such echocardiographic
pa-rameters at baseline didn’t show no significant
differences between responders and non-responders. Similar results were found in previous studies [15]. Methods of dyssynchrony index assessment were studied extensively in the past but with incomplete success to
predict outcome. Early enthusiasm towards such
methods [16,17] was dampened by the multicenter
Pre-dictors of Response to Cardiac Resynchronization
Ther-apy (PROSPECT) trial [18] that manifested the
dyssynchrony parameters had marked variability in pre-diction of the clinical composite score response
(sensi-tivity 6–74%, specificity 35–91%) and prediction of LV
end-systolic volume response (≥15% reduction;
sensitiv-ity 9–77%, specificity 31–93%). SDI, which was a
con-cept of wasted work introduced by Lim et al. [14] and has been proven to have a strong predictive value for predicting response to CRT [19], was comparable be-tween responders and non-responders at baseline and even had no significant change after CRT in our study. All these parameters have limiting ability to predict CRT response probably because none of them incorporates dynamic changing myocardial loading and stress state. As shown in our study, Midlateral peak PS was higher in responders than in non-responders, but Midseptal peak
PS didn’t differ at baseline so that we couldn’t judge
whether septal was working effective or not. Besides, in view of the difference of peak PS between Midseptal and Midlateral did not reach statistical significance, we
couldn’t infer that the heterogeneity of segmental strain
distribution in dyssynchrony LV. Therefore, Russell et al. Fig. 4Receiver operating characteristic (ROC) curves for predicting
response to cardiac resynchronization therapy (CRT). The area under the ROC curve (AUC) of R2-S/D coupling of Midseptal PS–Global
volume loop was greater than that of TpPS-SD%, Tmsv-SD% and SDI (P< 0.05). SDI, strain delay index; Tmsv-SD%, standard deviation of time to minimum systolic volume corrected by R-R interval; TpPS-SD%, standard deviation of time to peak principal strain corrected by R-R interval
[20] proposed the LV pressure-strain loop analysis which allows the estimation of regional and global LV work (quantified by strain rate multiplying by instantaneous LV-pressure) and furthermore introduced the wasted work ratio as an index to predict response to CRT [21]. Vecera et al. [22] also demonstrated the wasted work in the septum calculated by similar methods was a strong predictor of response to CRT. However, clinical use of the LV pressure-strain analysis is limited by the chal-lenge to noninvasive acquire instantaneous LV pressure.
The new method based on simultaneous strain–load
(volume or area) analysis has been applied in certain
physiological state [23,24] and pathological LV
remodel-ing [25, 26]. Besides, it has been recently validated the
same method with tagging cardiac magnetic resonance
[27]. It took about 3–5 min to perform strain–volume
loop analysis off-line for each patient after practice in our study. So, it would be more generally applicable in clinical use by virtue of its noninvasive and convenient. Considering LV mapping data [28] have shown that the mid-septal region was electrically activated first and U-shaped conduction pattern through the apical regions was imposed on the LV activation sequence by a trans-mural functional line of block located between the LV septum and the lateral wall with a prolonged activation
time, our study focused on septal and lateral strain–
vol-ume relationship analysis at the mid-ventricular level, which not only enhancing reproducibility since segmen-tal heterogeneity was most evident between septum and lateral wall but also enhancing operability by simplifying evaluation and reducing data loss. Firstly, our study
ex-plored characteristics of the LV PS–volume loops in
healthy subjects to verify the reliability of this new method and provide reference foundation to the estab-lishment of evaluation criteria of LV remodeling such as in HF. As expected, the healthy subjects showed the nor-mal myocardial shortening and lengthening was well coupled to the simultaneous progressive reduction and expansion of volume. In healthy subjects, all kinds of
PS–volume loops showed steep slope, indicating a good
systolic and diastolic performance. Besides, a similar strain value could be observed for any given LV volume during systole and diastole in healthy individuals, which
suggesting the presence of strong systolic–diastolic
coupling. This result was concordant with previous study [23].
At baseline evaluation of HF patients, all kinds of
PS–volume loops showed a lower slope when
com-pared with that in healthy subjects. As a result of the simultaneous presence of chamber dilatation (right-ward shift of the loop) and strain reduction (up(right-ward shift of the loop), the two parameters were moving in the opposite direction from the normal loops in the Cartesian system and we could observe significant
alteration of the slope. Furthermore, dissociation oc-curred between systolic and diastolic strain at the same volume, which indicating the presence of un-coupling in the relationship between strain and
vol-ume in HF patients. In dyssynchronous LV, systolic–
diastolic uncoupling of strain–volume loop reflects
myocardial efficiency reducing because myocardial
systolic shortening and diastolic lengthening doesn’t
synchronize with chamber volume decreasing and in-creasing, which resulting in much wasted work
glo-bally or segmentally. In addition, strain–volume loop
provides an intuitive visual representation to detect the response to CRT. As shown in our study, if CRT effective, a simultaneous volume reducing (leftward shift of the loop) and PS increasing (downward shift of the loop) would make the loop steeper and better systolic–diastolic coupling.
At baseline, the R2-S/D coupling of the Midseptal PS–
Global volume loop in CRT responders was significantly
lower than that in non-responders, besides, the R2-S/D
coupling of the Midseptal PS–Global volume loop at
baseline was found to be an independent predictor of CRT response in multivariate analysis whereas dyssyn-chrony parameters were not. This result indicated that much wasted myocardial work was located to the septum at baseline in CRT responders. The amount of septal wasted myocardial work at baseline was related to the magnitude of benefit following CRT. The more the septal wasted at baseline, the higher probability of re-sponse to CRT was achieved. Nevertheless, the slope of
the Midseptal PS–Global volume loop didn’t show
sig-nificant difference between CRT responders and
non-responders. While the synchronism of global and segmental myocardium maintains higher level with good systolic-diastolic coupling, myocardial contractility could be reflected by the slope of strain-volume loop. But if higher degree dyssynchrony of global and segmental myocardium is presented with systolic-diastolic uncoup-ling, the slope of strain-volume loop would underesti-mate the myocardial contractility. After CRT, the slope
and R2-S/D coupling of the Midseptal PS–Global volume
loop as well as Midseptal peak PS were increased signifi-cantly, accompanied by a significant increase in the slope
of Global PS–Global volume loop as well as GLS and
GRS, which suggesting an improvement in septal effi-ciency following CRT could contribute to the improve-ment in LV global function.
Midlateral peak PS as well as the slope of Midlateral
PS–Global volume loop and Midlateral PS–Midlateral
view of Zweerink [29]. In Zweerink’s study, absolute values of lateral wall strain, strain rate, and work were significantly higher in responders, but this finding is not getting the attention it deserved for further investigation and deeper analysis.
In addition, our results also indicated that applying CRT to patients with abnormal segmental heterogen-eity between septum and LV lateral wall, which con-trary to that in healthy subjects, may be more likely to response to CRT. This heterogeneous distribution of myocardial work can be rebalanced by restoring normal electrical activation following CRT. It is help-ful to improve patient selection for CRT to identify this abnormal but reversible segmental heterogeneity. Electric activation delay generates contractile dyssyn-chrony, with early-activated septum earlier onset of shortening during isovolumetric contraction phase against a low afterload while late-activated lateral wall shortening against increased wall stress and loading at
late systole into early relaxation [30]. The
early-developed septal force is dissipated in generating sufficient energy to open the aortic valve and in stretching the late-activated lateral wall. The latter event represents wasted energy during early ejection. Passive stretch might influence regional myocardial contractility because changes of effective preload trig-gered local Frank-Starling mechanism. The passive pre-stretch would enable the late-activated segments to contract to a greater extent in order to compensate for the increased loading conditions. Thus, septal work efficiency being reduced and lateral function compensatory being improved together generate the abnormal segmental heterogeneity. CRT could im-prove septal work efficiency and normalize lateral function in responders, which making heterogeneous distribution of myocardial work significantly decrease significantly or even eliminate. As observed in our study, responders showed improvements in the slope
and R2-S/D coupling of the Midseptal PS–Global
vol-ume loop after CRT, whereas no significant change
was observed in characteristics of the Midlateral PS–
Global volume loop.
Most probably as the result of an optimized local
load-ing state by CRT, the slope of both the Midseptal PS–
Midseptal volume loop and the Midlateral PS–
Midlat-eral volume loop were significantly increased in re-sponders after CRT.
Limitations
This study was performed in a single center, with a rela-tively small sample size. Therefore, we cannot draw de-finitive conclusions but only formulate a hypothesis that needs to be confirmed by future, larger, multi-center prospective trials.
Conclusions
Analysis of strain–volume loops could provide unique
information for predicting response to CRT and may be-come a potential new tool to detect the beneficial effects of CRT on LV function. Our study demonstrated that as-sessment of wasted work in septum at baseline would be helpful to improve patient effective selection for CRT.
R2-S/D coupling of Midseptal PS–Global volume loop at
baseline is proved to have predictive value for predicting response to CRT.
Abbreviations
2D:two-dimensional; 3D: three-dimensional; AUC: area under the curve; CI: confidence interval; CRT: cardiac resynchronization therapy; EDV: end-diastolic volume; EF: ejection fraction; ESV: end-systolic volume; HF: heart failure; LV: left ventricular; PS: principal strain; ROC: receiver operating characteristic; SDI: strain delay index; STI: speckle tracking imaging; Tmsv-SD%: standard deviation of time to minimum systolic volume corrected by R-R interval; TpPS-SD%: standard deviation of time to peak principal strain corrected by R-R interval
Acknowledgements
The study was funded by the National Nature Science Foundation of China (Grant No. 81671685).
Funding
The study was funded by the National Nature Science Foundation of China (Grant No. 81671685).
Availability of data and materials
All datasets used and analyzed during the current study are available from the corresponding author on reasonable request.
Authors’contributions
MZ designed and carried the study, analyzed images and data, performed the statistical analysis, and drafted the manuscript. HC, ZF and YL collected patients and acquired echocardiographic images. YS operated the implantation of devices on patients. XS conceived the study and revised the manuscript. All authors read and approved the final manuscript.
Ethics approval and consent to participate
All patients had given informed consent, and the study design was approved by the Ethical Review Board of Zhongshan Hospital of Fudan University and complied with the Declaration of Helsinki.
Consent for publication Not applicable.
Competing interests
The authors declare that they have no competing interests.
Publisher’s Note
Springer Nature remains neutral with regard to jurisdictional claims in published maps and institutional affiliations.
Received: 15 December 2018 Accepted: 12 February 2019
References
1. Cleland JG, Daubert JC, Erdmann E, Freemantle N, Gras D, Kappenberger L, Tavazzi L. Cardiac resynchronization-heart failure study I: the effect of cardiac resynchronization on morbidity and mortality in heart failure. N Engl J Med. 2005;352(15):1539–49.
3. Klimusina J, De Boeck BW, Leenders GE, Faletra FF, Prinzen F, Averaimo M, Pasotti E, Klersy C, Moccetti T, Auricchio A. Redistribution of left ventricular strain by cardiac resynchronization therapy in heart failure patients. Eur J Heart Fail. 2011;13(2):186–94.
4. Carasso S, Rakowski H, Witte KK, Smith P, Carasso D, Garceau P, Sasson Z, Parker JD. Left ventricular strain patterns in dilated cardiomyopathy predict response to cardiac resynchronization therapy: timing is not everything. J Am Soc Echocardiogr. 2009;22(3):242–50.
5. Bernard A, Donal E, Leclercq C, Schnell F, Fournet M, Reynaud A, Thebault C, Mabo P, Daubert JC, Hernandez A. Impact of cardiac resynchronization therapy on left ventricular mechanics: understanding the response through a new quantitative approach based on longitudinal strain integrals. J Am Soc Echocardiogr. 2015;28(6):700–8.
6. Satriano A, Heydari B, Narous M, Exner DV, Mikami Y, Attwood MM, Tyberg JV, Lydell CP, Howarth AG, Fine NM, et al. Clinical feasibility and validation of 3D principal strain analysis from cine MRI: comparison to 2D strain by MRI and 3D speckle tracking echocardiography. Int J Cardiovasc Imaging. 2017;33(12):1979–92.
7. Ahn HS, Kim YK, Song HC, Choi EJ, Kim GH, Cho JS, Ihm SH, Kim HY, Park CS, Youn HJ. The impact of preload on 3-dimensional deformation parameters: principal strain twist and torsion. Cardiovasc Ultrasound. 2017; 15(1):22.
8. Pedrizzetti G, Sengupta S, Caracciolo G, Park CS, Amaki M, Goliasch G, Narula J, Sengupta PP: Three-dimensional principal strain analysis for characterizing subclinical changes in left ventricular function. J Am Soc Echocardiogr 2014, 27(10):1041–1050 e1041.
9. Stefani L, De Luca A, Toncelli L, Pedrizzetti G, Galanti G. 3D strain helps relating LV function to LV and structure in athletes. Cardiovasc Ultrasound. 2014;12(1):33.
10. Ponikowski P, Voors AA, Anker SD, Bueno H, Cleland JGF, Coats AJS, Falk V, Gonzalez-Juanatey JR, Harjola VP, Jankowska EA, et al. 2016 ESC guidelines for the diagnosis and treatment of acute and chronic heart failure: the task force for the diagnosis and treatment of acute and chronic heart failure of the European Society of Cardiology (ESC)developed with the special contribution of the heart failure association (HFA) of the ESC. Eur Heart J. 2016;37(27):2129–200.
11. Brignole M, Auricchio A, Baron-Esquivias G, Bordachar P, Boriani G, Breithardt OA, Cleland J, Deharo JC, Delgado V, Elliott PM, et al. ESC guidelines on cardiac pacing and cardiac resynchronization therapy: the task force on cardiac pacing and resynchronization therapy of the European Society of Cardiology (ESC). Developed in collaboration with the European heart rhythm association (EHRA). Europace. 2013;34(29):2281–329. 12. Surawicz B, Childers R, Deal BJ, Gettes LS, Bailey JJ, Gorgels A, Hancock EW,
Josephson M, Kligfield P, Kors JA, et al. AHA/ACCF/HRS recommendations for the standardization and interpretation of the electrocardiogram: part III: intraventricular conduction disturbances: a scientific statement from the American Heart Association electrocardiography and arrhythmias committee, council on clinical cardiology; the American College of Cardiology Foundation; and the Heart Rhythm Society. Endorsed by the International Society for Computerized Electrocardiology. J Am Coll Cardiol. 2009;53(11):976–81.
13. Lang RM, Badano LP, Mor-Avi V, Afilalo J, Armstrong A, Ernande L, Flachskampf FA, Foster E, Goldstein SA, Kuznetsova T. Recommendations for cardiac chamber quantification by echocardiography in adults: an update from the American Society of Echocardiography and the European Association of Cardiovascular Imaging. Eur Heart J Cardiovasc Imaging. 2015;16(3):233.
14. Lim P, Buakhamsri A, Popovic ZB, Greenberg NL, Patel D, Thomas JD, Grimm RA. Longitudinal strain delay index by speckle tracking imaging: a new marker of response to cardiac resynchronization therapy. Circulation. 2008; 118(11):1130–7.
15. Delgado V, Ypenburg C, Zhang Q, Mollema SA, Fung JW, Schalij MJ, Yu CM, Bax JJ. Changes in global left ventricular function by multidirectional strain assessment in heart failure patients undergoing cardiac resynchronization therapy. J Am Soc Echocardiogr. 2009;22(6):688–94.
16. Van Bommel RJ, Ypenburg C, Borleffs CJ, Delgado V, Marsan NA, Bertini M, Holman ER, Schalij MJ, Bax JJ. Value of tissue Doppler echocardiography in predicting response to cardiac resynchronization therapy in patients with heart failure. Am J Cardiol. 2010;105(8):1153–8.
17. Bax JJ, Bleeker GB, Marwick TH, Molhoek SG, Boersma E, Steendijk P, van der Wall EE, Schalij MJ. Left ventricular dyssynchrony predicts response and
prognosis after cardiac resynchronization therapy. J Am Coll Cardiol. 2004; 44(9):1834–40.
18. Chung ES, Leon AR, Tavazzi L, Sun JP, Nihoyannopoulos P, Merlino J, Abraham WT, Ghio S, Leclercq C, Bax JJ, et al. Results of the predictors of response to CRT (PROSPECT) trial. Circulation. 2008;117(20):2608–16. 19. Lim P, Donal E, Lafitte S, Derumeaux G, Habib G, Reant P, Thivolet S,
Lellouche N, Grimm RA, Gueret P. Multicentre study using strain delay index for predicting response to cardiac resynchronization therapy (MUSIC study). Eur J Heart Fail. 2011;13(9):984–91.
20. Russell K, Eriksen M, Aaberge L, Wilhelmsen N, Skulstad H, Remme EW, Haugaa KH, Opdahl A, Fjeld JG, Gjesdal O, et al. A novel clinical method for quantification of regional left ventricular pressure-strain loop area: a non-invasive index of myocardial work. Eur Heart J. 2012;33(6):724–33. 21. Russell K, Eriksen M, Aaberge L, Wilhelmsen N, Skulstad H, Gjesdal O,
Edvardsen T, Smiseth OA. Assessment of wasted myocardial work: a novel method to quantify energy loss due to uncoordinated left ventricular contractions. Am J Phys Heart Circ Phys. 2013;305(7):H996–1003. 22. Vecera J, Penicka M, Eriksen M, Russell K, Bartunek J, Vanderheyden M,
Smiseth OA. Wasted septal work in left ventricular dyssynchrony: a novel principle to predict response to cardiac resynchronization therapy. Eur Heart J Cardiovasc Imaging. 2016;17(6):624–32.
23. Oxborough D, Heemels A, Somauroo J, McClean G, Mistry P, Lord R, Utomi V, Jones N, Thijssen D, Sharma S, et al. Left and right ventricular longitudinal strain-volume/area relationships in elite athletes. Int J Cardiovasc Imaging. 2016;32(8):1199–211.
24. Lord R, George K, Somauroo J, Stembridge M, Jain N, Hoffman MD, Shave R, Haddad F, Ashley E, Jones H, et al. Alterations in cardiac mechanics following ultra-endurance exercise: insights from left and right ventricular area-deformation loops. J Am Soc Echocardiogr. 2016;29(9):879–87 e871. 25. Lilli A, Baratto MT, Del Meglio J, Chioccioli M, Magnacca M, Svetlich C,
Ghidini Ottonelli A, Poddighe R, Comella A, Casolo G. Three-dimensional simultaneous strain-volume analysis describes left ventricular remodelling and its progression: a pilot study. Eur J Echocardiogr. 2011;12(7):520–7. 26. Hulshof HG, van Dijk AP, George KP, Hopman MTE, Thijssen DHJ,
Oxborough DL. Exploratory assessment of left ventricular strain-volume loops in severe aortic valve diseases. J Physiol. 2017;595(12):3961–71. 27. Lilli A, Tessa C, Diciotti S, Croisille P, Clarysse P, Del Meglio J, Salvatori L,
Vignali C, Casolo G: Simultaneous strain-volume analysis by three-dimensional echocardiography: validation in normal subjects with tagging cardiac magnetic resonance, J Cardiovasc Med (Hagerstown) 2017, 18(4): 223–229.
28. Auricchio A, Fantoni C, Regoli F, Carbucicchio C, Goette A, Geller C, Kloss M, Klein H. Characterization of left ventricular activation in patients with heart failure and left bundle-branch block. Circulation. 2004;109(9):1133–9. 29. Zweerink A, de Roest GJ, Wu L, Nijveldt R, de Cock CC, van Rossum AC,
Allaart CP: Prediction of Acute Response to Cardiac Resynchronization Therapy by Means of the Misbalance in Regional Left Ventricular Myocardial Work. (1532–8414 (Electronic)).