R E S E A R C H
Open Access
Does osteogenic potential of clonal human
bone marrow mesenchymal stem/stromal
cells correlate with their vascular
supportive ability?
Alison T. Merryweather-Clarke
1,2†, David Cook
1,2†, Barbara Joo Lara
1,2, Peng Hua
1,2,3, Emmanouela Repapi
3,
Neil Ashley
3, Shiang Y. Lim
4,5and Suzanne M. Watt
1,2*Abstract
Background:Human bone marrow-derived mesenchymal stem/stromal cells (hBM MSCs) have multiple functions, critical for skeletal formation and function. Their functional heterogeneity, however, represents a major challenge for their isolation and in developing potency and release assays to predict their functionality prior to transplantation. Additionally, potency, biomarker profiles and defining mechanisms of action in a particular clinical setting are increasing requirements of Regulatory Agencies for release of hBM MSCs as Advanced Therapy Medicinal Products for cellular therapies. Since the healing of bone fractures depends on the coupling of new blood vessel formation with osteogenesis, we hypothesised that a correlation between the osteogenic and vascular supportive potential of individual hBM MSC-derived CFU-F (colony forming unit-fibroblastoid) clones might exist.
Methods:We tested this by assessing the lineage (i.e. adipogenic (A), osteogenic (O) and/or chondrogenic (C)) potential of individual hBM MSC-derived CFU-F clones and determining if their osteogenic (O) potential correlated with their vascular supportive profile in vitro using lineage differentiation assays, endothelial-hBM MSC vascular co-culture assays and transcriptomic (RNAseq) analyses.
Results:Our results demonstrate that the majority of CFU-F (95%) possessed tri-lineage, bi-lineage or uni-lineage osteogenic capacity, with 64% of the CFU-F exhibiting tri-lineage AOC potential. We found a correlation between the osteogenic and vascular tubule supportive activity of CFU-F clones, with the strength of this association being donor dependent. RNAseq of individual clones defined gene fingerprints relevant to this correlation.
Conclusions:This study identified a donor-dependent correlation between osteogenic and vascular supportive potential of hBM MSCs and important gene signatures that support these functions that are relevant to their bone regenerative properties.
Keywords:Mesenchymal stem/stromal cells, Osteogenesis, Vascular supportive capacity, RNAseq, Clonal analysis, CFU-F
* Correspondence:suzanne.watt@ndcls.ox.ac.uk
†Alison T. Merryweather-Clarke and David Cook contributed equally to this
work.
1Stem Cell Research, Nuffield Division of Clinical Laboratory Medicine,
Radcliffe Department of Medicine, University of Oxford, John Radcliffe Hospital, Oxford OX3 9BQ, UK
2Stem Cell Research, NHS Blood and Transplant, John Radcliffe Hospital,
Oxford OX3 9BQ, UK
Full list of author information is available at the end of the article
Background
Mesenchymal stem and stromal cells (MSCs), also known as mesenchymal or skeletal stem and progenitor cells (MSPCs or SSCs), are critical components of the post-natal bone marrow (BM). When derived from this tissue, they have the potential not only to differentiate into multiple lineages (including osteogenic (O), chondrogenic (C) and adipogenic (A)), but also to form niche cells which support haematopoietic and blood vessel formation and function (reviewed in [1–7]). Additionally, when trans-planted, these cells can display significant immunosup-pressive, anti-inflammatory and anti-fibrotic properties (reviewed in [8–13]). These unique features of hBM MSCs have been key to their development from in vitro and in vivo pre-clinical models to numerous clinical trials, where they have, for example, been used to treat bone and joint disorders, improve haematopoietic stem cell engraftment, expand haematopoietic stem and progenitor cells, en-hance blood vessel formation, ameliorate auto-immune disorders and graft versus host disease, and prevent or re-duce fibrosis and scarring (reviewed in [5–7,14–16]).
Historically, MSCs have been notoriously poorly de-fined. They were initially characterised by their clonogenic colony-forming unit-fibroblast (CFU-F) formation [17– 19], adherence to plastic, expression of characteristic com-binations of stromal cell markers (e.g. CD90, CD105, CD73) while being CD45 and CD31 negative), and their multi-lineage differentiation capacity [20,21]. Muraglia et al. [22, 23] examined the differentiation capacity of single hBM derived CFU-F clones over time and reported het-erogeneity of their potentiality, with 99% of hBM CFU-F clones having osteogenic potential, of which approxi-mately one third possessed tri-lineage AOC potential and 60–80% OC potential. They found no clones with OA or CA potential, but demonstrated that tri- and bi-potent clones progressively lost their adipogenic and chondro-genic potential with increasing hBM MSC population doublings. Various other reports indicate that 20–50% of clonal CFU-F from non-enriched human bone marrow have at least tri-lineage AOC potential ([24] and refer-ences therein). These studies highlight the importance, amongst other parameters, of donor age, source of cells (e.g. iliac crest, bone fragments), culture conditions, pas-sage number and the pre-separation protocols and isola-tion markers used to analyse these cells. As an exemplar, our own unpublished studies [Watt SM, unpublished data] and studies from others [25–27] demonstrate a significant loss of hBM MSCs if bone marrow is fractionated on dens-ity gradients which select cells with densities < 1.077 g/ml. Thus, both plastic adherent CFU-F and those derived after enrichment on density gradients and with the a variety of cell surface markers (e.g. CD271, CD146, MSCA-1, CD105, STRO-1, PDGFR-β (CD140b), ErbB2 (CD340), Frizzled-9 (CD349), CD90, CD295 (LepR), CD106, VCAM-1
CD140alow/−
) [28–44] possess inherent and/or cell selection biased heterogeneity, and contain both multipotent MSCs and partially differentiated mesenchymal progenitor cells. This functional heterogeneity of hBM MSCs represents a major challenge in developing isolation, and potency and release assays, which can sustain and predict their function-ality prior to transplantation [5,45,46].
Our previous studies have demonstrated the hBM MSCs not only differentiate into osteogenic, adipogenic and chondrogenic lineages, but can also support vascular tu-bule formation [47–50]. We have shown that this vasculo-genic support can be mimicked with a clonal nestin+ murine bone marrow MSC cell line (MS-5) which also supports human haematopoiesis [51–54]. In this manu-script, we first defined the CFU-F-derived clonal popula-tions of hBM MSCs by their AOC tri-lineage and more restricted lineage differentiation potentials from erythrocyte-depleted whole human bone marrow from young donors (< 40 years). Since the healing of bone de-fects in larger bone grafts or fractures depends on the coupling of new blood vessel formation with osteogenesis [55–59], we examined the potential of these individual hBM MSC clones, with differential osteogenic differenti-ation capacities, to support endothelial networks in co-culture assays in vitro. Next, we studied the transcrip-tome of a proportion of clonal CFU-F cultures, which show a range of osteogenic and endothelial supportive capacities, using RNAseq to better characterise the gene expression profile of the clonally derived cells with differ-ent lineage potdiffer-entials and to assess their differdiffer-ential ex-pression of factors important and potentially predictive for their capacity for osteogenic-angiogenic coupling.
Methods
Human bone marrow preparation and culture
or flasks, the cells allowed to adhere for 48 h before full replacement of the MSCGM (Lonza). The hBM MSCs were cultured in MSCGM (Lonza) with media changes every 3–4 days and passaged with trypsin/EDTA when approximately 90% confluent.
Colony forming unit-fibroblast (CFU-F) quantitation Red blood cell depleted fresh human bone marrow cells were counted and seeded at 1.25 × 10⁴, 2.5 × 10⁴and be-tween 1 × 10⁵ to 5 × 10⁴ cells/cm2 into 6 well plates or 10 cm diameter tissue culture plastic dishes (Corning Life Sciences, Tewksbury, MA, USA) in MSCGM (Lonza). The media were changed every 3–4 days and cells cultured for approximately 2 weeks or until discrete colonies could be identified under the microscope. The colonies were washed twice in PBS and fixed in 95% ethanol for 5 min. The ethanol was removed and the cells stained for 30 min in 0.5% crystal violet in 95% ethanol. The crystal violet was removed, and the plates washed in tap water to remove excess stain. The plates were then allowed to dry before CFU-F imaging and counting using the LICOR Odyssey system (Lincoln, NE, USA).
Generation of clonal cell cultures
Bone marrow cells were seeded as a single-cell suspen-sion into 10 cm diameter tissue culture plastic dishes at 1.25 × 10⁴, 2.5 × 10⁴ and 5 × 10⁴ cells/cm2 in MSCGM (Lonza). The cells were cultured as described above for approximately 2 weeks, until large colonies formed. At this stage, single colonies were picked using cloning cyl-inders, and the cells from these individual colonies transferred to individual wells of 12 well plates for fur-ther expansion. At 90% confluency (passage (P) 0), the clonal cultures were passaged into T25 flasks. When the cultures reached 90% confluency (termed P1), they were used at this passage in the AOC differentiation and vas-cular tubule co-culture assays as described below. Typ-ical scoring of the cultures in these differentiation assays is illustrated in Additional file1: Figure S1.
Differentiation assays
For the differentiation assays, hBM MSCs were seeded at 2 × 10⁴ cells/cm2 into 96 well plates in MSCGM (Lonza) and allowed to attach overnight. Collagen I-coated plates were used for osteogenic and chondro-genic cultures. The medium was then replaced with dif-ferentiation medium (Lonza) to promote osteogenic, adipogenic and chondrogenic differentiation. Osteogenic differentiation media comprised osteogenic basal media plus hMSC osteogenic Singlequot supplements and growth fac-tors (dexamethasone, ascorbate, mesenchymal cell growth supplement (MCGS), L-glutamine, penicillin/streptomycin, β-glycerophosphate). Adipogenic differentiation media
comprised adipogenic induction media plus hMSC adipo-genic induction Singlequot supplements and growth factors (h-Insulin (recombinant), L-glutamine, mesenchymal cell growth supplement (MCGS), GA1000, dexamethasone, indomethacin and IBMX). Chondrogenic differentiation media comprised chondrogenic differentiation media plus hMSC chondrogenic Singlequot supplements and growth factors (ITS + supplement, dexamethasone, ascorbate, so-dium pyruvate, proline, GA-1000,L-glutamine). These media were replaced every 3–4 days as described in the manufac-turer’s protocol. Adipogenic and chondrogenic potentials were assayed at 14 days, while osteogenic differentiation was assayed at 21 days.
Oil Red O staining
For adipogenic differentiation, lipid droplets were visua-lised using Oil Red O staining. Cells were washed with PBS, fixed with 4% paraformaldehyde (PFA) for 10 min, washed once in double distilled water and incubated in 60% isopropanol for 5 min. After isopropanol removal, cells were incubated with Oil Red O staining solution (0.3% Oil Red O in 60% isopropanol) for 10 mins, and washed once in 60% isopropanol and then 3 times with double distilled water. The samples were stored in 20% glycerol in PBS and imaged using bright field micros-copy. For quantification, Oil Red O was extracted using 100% isopropanol (50μl/well) for 10 min and the absorb-ance (490 nm) measured using a Biorad plate reader.
Alizarin Red staining for osteogenic differentiation Calcification of osteogenic monolayers was visualised using Alizarin Red staining. Cells were washed with PBS, fixed with 4% PFA for 15 min and washed three times in PBS and once with double distilled water before staining with 40 mM Alizarin Red S solution (pH 4.2) for 20 min at room temperature. The cells were washed in double dis-tilled water and plates dried prior to imaging. For quantifi-cation, Alizarin Red S was extracted by incubating the wells in 150μl 10% acetic acid for 30 min. The sample was then transferred to a 96-well qPCR plate and incubated at 85 °C for 10 min followed by incubation on ice for 5 min. One hundredμl of sample was then transferred to a new 96 well plate, and the pH was neutralised with 30μl 10% ammonium hydroxide. The absorbance was then mea-sured at 415 nm using a Biorad plate reader.
Vascular tubule co-culture assay
HUVEC cultures (P1) were purchased from Lonza, cul-tured in EGM-2 (Lonza) with media changes every 2–3 days and passaged at 95% confluency with trypsin/ EDTA. hBM MSCs were seeded at 2 × 10⁴ and 4 × 10⁴ cells/cm2into 96-well plates and incubated overnight in MSCGM (Lonza). The next day the media were removed and HUVECs at passage 3–5 were added to the hBM MSCs at a concentration of 2.5 × 10³ cells/cm2 in EGM2. The co-cultures were fed every 2 to 3 days with complete EGM-2 (Lonza) [48]. After 14 days’incubation, the cells were fixed in ice-cold 70% (v/v) ethanol for 30 min at RT and washed three times with PBS. For vessel staining, the PBS was removed and cells were incubated for 30 min with 50μl of blocking buffer (5% (w/v) BSA in PBS) at room temperature and then with mouse anti-hCD31 primary antibody (1:4000) in blocking buffer (AbD Serotec, Kidlington, England) overnight at 4 °C followed by 50μl of biotinylated-goat anti-mouse Ig (1:200) (Vector Laboratories, Peterborough, England) at RT for 1 h. After three washes with PBS, 50μl of Vectas-tain Elite ABC reagent and then 50μl of DAB Peroxid-ase Substrate working solution (both from Vector Laboratories) for 10 min were applied. Subsequently, the cells were washed three times with double distilled water for 5 min and allowed to dry overnight before imaging and quantification. In order to quantify the tubules, im-ages were taken with a × 4 objective on a NIKON Eclipse TE2000-U microscope (London, England) and processed in Adobe Photoshop CS2 version 9.0 (Adobe Systems Inc., Maidenhead, England). To quantify tubule formation, the images were analysed using Angiosys 1.0 software (Cellworks, Buckingham, England).
Flow cytometry
The hBM MSCs at P1 were characterised by flow cytom-etry as described previously [48] using antibodies de-scribed in Additional file2: Table S1 and analysed using a BD LSRII flow cytometer. Data were collected by FACS DIVA Software (Version 6.13; firmware version 1.9; Becton-Dickinson, Oxford, England) and analysed with FlowJo software (Ashland, OR, USA). The cells were confirmed for their MSC phenotype as CD45−and CD73+CD105+CD90+CD166+CD146+.
Statistics for cellular studies
Statistical analyses were performed using GraphPad Prism version 7 (Graphpad Software Inc., San Diego, CA, USA). P values < 0.05 were considered statistically significant. Data are presented as means ± SD for the number of biological replicates indicated in the“Results” section. Pearson’s correlation coefficient (r) was used to measure the strength of the association between the vas-cular tubule supportive and osteogenic or adipogenic
potential, or between the osteogenic and adipogenic po-tential of the CFU-F clones from human bone marrow.
hBM MSC sorting and cDNA library generation
The hBM MSC clonal cultures, cryopreserved at the time of the differentiation and vascular tubule support analyses (P1), were thawed and diluted in warm MSCGM (Lonza) before centrifugation at 300 g and re-suspended in FACS buffer. DAPI (Sigma-Aldrich Ltd., St Louis, MI, USA) was added as a viability stain before flow cytometric sorting. One hundred single live cells (DAPI positive cells excluded) for each clonal culture be-ing analysed at P1 were sorted into PCR tubes contain-ing lysis buffer, oligo-dT primer and dNTP mix, and Smart-Seq2 cDNA libraries were then generated as de-scribed [60].
RNA sequencing and analysis
Sequencing was performed using TruSeq SBS Kit v3 chemistry (Illumina Inc., Cambridge, England). Follow-ing QC analysis with the fastQC package (http:// www.bioinformatics.babraham.ac.uk/projects/fastqc), reads were aligned using STAR [61] against the human genome assembly (NCBI build37 (hg19) UCSC tran-scripts). Non-uniquely mapped reads were discarded using SAMtools [62]. Gene expression levels were quan-tified as read counts using the featureCounts function [63] from the Subread package [64] with default parame-ters. The read counts were used for the identification of global differential gene expression between specified populations using the edgeR package [65]. RPKM (reads per kilobase of transcript per million mapped reads) values were also generated using the edgeR package. Genes were considered differentially expressed between populations if they had an adjusted p value (FDR, false discovery rate) of less than 0.05 (high stringency) or 0.1 (relaxed stringency). Heat maps and clustering of RNA expression were generated using Genesis [66].
Enrichment analysis
transcripts, shared transcripts and unique transcripts in each data set.
Quantitative real-time PCR
RNA was isolated from one million cryopreserved cells selected from higher versus lower osteogenic CFU-F clones (n= 6) at P1 using RNeasy Plus Mini Kit (QIA-GEN, Valencia, CA, USA) according to the manufac-turer’s protocol. RNA concentrations were determined using NanoDrop One (ThermoFisher, Loughborough, England) then each RNA sample was assayed twice and the mean value taken. cDNA synthesis was carried out by reverse transcription of total RNA to cDNA using the High Capacity RNA-to-cDNA kit (Applied Biosystems, ThermoFisher) following the protocol recommended by the manufacturers. Five (5) nanograms of cDNA was used in each qPCR reaction on the QuantStudio 7 Flex System (ThermoFisher) supplied with Power SYBR Green PCR Master Mix (Applied Biosystems, Thermo-Fisher) and primers (custom synthesised by Integrated DNA Technologies, Coralville, IA, USA) as listed below. All these genes were analysed at least three times. The relative expression level of each gene was calculated usingΔΔCt method against GAPDH. The StudentTtest was used for statistical comparison of each gene andp< 0.05 taken as statistically significant.
Gene Primers
GAPDH GTTCGACAGTCAGCCGCATC GGAATTTGCCATGGGTGGA
SPARC TGCCTGATGAGACAGAGGTGGT CTTCGGTTTCCTCTGCACCATC
BAD GAGCCCGGGGTGCTGGAGGGA
GGCGGCACAGACGCGGGCTTT
CXCL12 TCAGCCTGAGCTACAGATGC CTTTAGCTTCGGGTCAATGC
EGLN1 TGAGCAGCATGGACGACCTGAT CGTACATAACCCGTTCCATTGCC
GRB14 TACCCAGTGACATAACGGCTCG GCACTTCAATCACCAGTTCGTGG
COL12A1 GTCCCAGGATGAGGTCAAGA TGGCAAGCTCATTGTAGTCG
Results
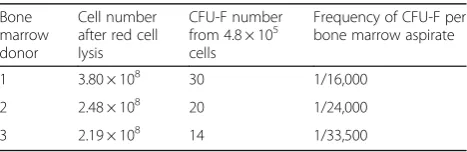
Generation and potency of hBM MSC-derived CFU-F Thirty milliliters of each fresh human bone marrow aspirate were red blood cell depleted and the total nucleated cell (TNC) counts determined. These ranged from 2.2 × 10⁸ to 3.8 × 10⁸(mean + SD = 2.82 + 0.86 × 10⁸; n= 3) TNC per 30 ml bone marrow aspirate. The CFU-F content of these cells was next assessed and this ranged from 1 in 16,000 to 1 in 33,500 bone marrow cells (equivalent to 37.25 + 4.60 CFU-F per 5 × 10⁸ red
cell lysed human bone marrow TNCs; Table 1; Add-itional file3: Figure S2).
Since therapeutic doses of hBM MSCs require their expansion in vitro, we isolated a total of 133 CFU-F colonies (P0) and expanded these into T25 tissue culture grade flasks (P1). All 133 clones were analysed at P1 for their morphology, ability to differentiate into osteoblasts, adipocytes and chondrocytes in vitro, and for their vascular tubule support in co-culture assays with HUVEC. Osteogenic and adipogenic differentiation was also quantified colorimetrically relative to a control non CFU-F selected hBM MSC (C that had been run in par-allel for all assays in order to minimise the effects of per-forming multiple assays. Representative images of the morphology and comparative confluency of hBM MSCs derived from the individual CFU-Fs are shown in Add-itional files 4 and 5: Figures S3 and S4. Although they exhibited a typical spindle-shaped fibroblastoid appear-ance, the proliferative ability and functional potency in vitro of each clone varied in culture. All three bone mar-row aspirates produced CFU-F with a range of AOC dif-ferentiation capacities. Of the total 133 clones, 95% possessed osteogenic potential, (AOC, OC, OA, O), 64% demonstrated tri-lineage AOC potential, 31% were bi-potent (OA, AC, OC), while only 4% were unipotent (O or C) and 1% nullipotent (Table 2). No clones were detected with adipogenic (A) potential only. These dif-fered slightly from studies Muraglia et al. [22] and Ales-sio et al. [69]. In agreement with our data, these other studies showed that the percentage of AOC and OC clones and of clones possessing osteogenic potential pre-dominated in adult human bone marrow, although Mur-aglia et al. [22] also demonstrated that their AOC versus OC frequency and an increase in unipotent osteogenic clones (O) was donor age dependent. However, while we detected a small proportion of clones with AC, OA, C or O potential (with the exception of osteogenic poten-tial in older donors), Muraglia et al. [22] did not detect these, while Alessio et al. [69] detected all clone types (AOC, OC, OA, AC, C, O, A). These differences may be due to different growth media usage and different donor characteristics but suggest the existence of CFU-F clones where osteogenic, adipogenic and chondrogenic poten-tial can be combined independently.
The potency of the CFU-F clones to support vascular tubule formation by HUVEC varied when measured as
Table 1CFU-F content in human bone marrow aspirates
Bone marrow donor
Cell number after red cell lysis
CFU-F number from 4.8 × 10⁵ cells
Frequency of CFU-F per bone marrow aspirate
1 3.80 × 10⁸ 30 1/16,000
2 2.48 × 10⁸ 20 1/24,000
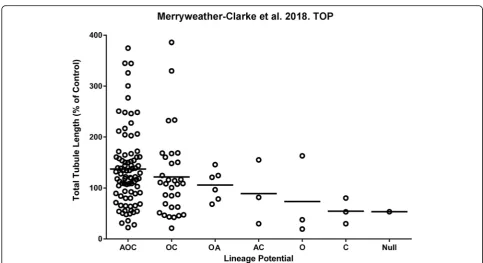
total vascular tubule length in co-culture assays, ranging from very poor supporters generating few or no endo-thelial tubules, through to strong supporters, instigating long and highly branched networks of endothelial cells (Fig. 1; Additional file 1: Figure S1). Interestingly, the CFU-F with the highest mean vascular tubule supportive abilities shared osteogenic potential in common, regard-less of whether they originated from the tri-lineage or bi-lineage clones (with trilineage {AOC} > bi-lineage
{OC} > bi-lineage {OA} CFU-F clones; Table 2A; Fig. 1). The CFU-F clones that supported the strongest levels of vascular tubule formation were observed in the tri-lineage AOC and osteo-chondrogenic (OC) bi-lineage groups (Table 2A; Fig. 1), although it should be noted that most of the analysed clones exhibited these AOC and OC potentials making it difficult to assess the con-tribution of other clones with differing or more restrict-ive potency. These more potent vascular supportrestrict-ive Table 2The differentiation capacity of CFU-F clones from human bone marrow
(A)
Lineage potential
% of total clones (Number of clones)
% of upper quartile, Tubule Length (Number)
% of lower quartile, Tubule Length (Number)
% of clones within group that fall within Tubule Length Upper quartile
% of clones within group that fall within Tubule Length Lower quartile
AOC 64% (85) 73% (24) 50% (17) 29% 20%
OC 24% (32) 24% (8) 29% (10) 25% 31%
AO 5% (6) 0% 3% (1) 0% 17%
AC 2% (3) 0% 3% (1) 0% 33%
O 2% (3) 3% (1) 6% (2) 33% 67%
C 2% (3) 0% 6% (2) 0% 67%
Null 1% (1) 0% 3% (1) 0% 100%
(B)
Lineage potential
% of total clones (Number of clones)
% of upper quartile, Osteogenesis Alizarin Red (Number)
% of lower quartile, Osteogenesis Alizarin Red (Number)
% of clones within group that fall within Osteogenesis Alizarin Red Upper quartile
% of clones within group that fall within Osteogenesis Alizarin Red Lower quartile
AOC 64% (85) 70% (23) 29% (10) 27% 11%
OC 24% (32) 21% (7) 38% (13) 22% 41%
AO 5% (6) 9% (3) 6% (2) 50% 33%
AC 2% (3) 0% 9% (3) 0% 100%
O 2% (3) 0% 6% (2) 0% 67%
C 2% (3) 0% 9% (3) 0% 100%
Null 1% (1) 0% 3% (1) 0% 100%
(C)
Lineage potential
% of total clones (Number of clones)
% of upper quartile, Adipogenesis Oil Red O (Number)
% of lower quartile, Adipogenesis Oil Red O (Number)
% of clones within group that fall within Adipogenesis Oil Red O Upper quartile
% of clones within group that fall within Adipogenesis Oil Red O Lower quartile
AOC 64% (85) 91% (30) 26% (9) 35% 11%
OC 24% (32) 3% (1) 62% (21) 3% 66%
AO 5% (6) 3% (1) 3% (1) 17% 17%
AC 2% (3) 3% (1) 0% 33% 0%
O 2% (3) 0% 3% (1) 0% 33%
C 2% (3) 0% 3% (1) 0% 33%
Null 1% (1) 0% 3% (1) 0% 100%
The numbers of tripotent (AOC with adipogenic, osteogenic and chondrogenic potential), bipotent (OC with osteogenic and chondrogenic potential; AO with adipogenic and osteogenic potential; or AC with adipogenic and chondrogenic potential) or unipotent (O with osteogenic potential; or C with chondrogenic potential) clones analysed are shown, with their distribution in the upper and lower quartiles of:
(A) HUVEC total tubule length (TLL) following co-culture
AOC and OC CFU-F clones also had a higher capacity for osteogenesis as assessed quantitatively using the Ali-zarin Red assay (Table 2B). We therefore assessed the correlation between osteogenic differentiation potential and the effective support of the hBM MSCs on vascular network formation.
Is there a correlation between CFU-F osteogenic and vascular supportive potency?
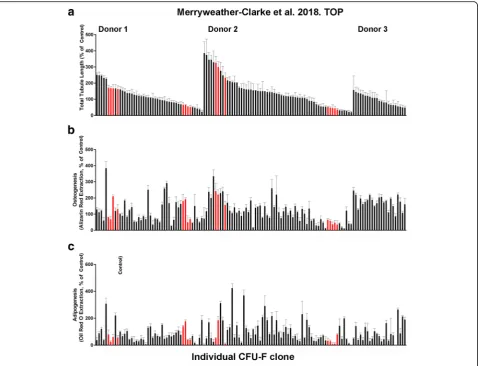
The degree of osteogenesis and vascular tubule supportive activity, as well as adipogenesis, was quantified for all individual CFU-F clones at passage 1. The results in Fig.2
demonstrate that these varied between the different clonal CFU-Fs when the three donor bone marrows were assessed together. Both donor variability and also CFU-F variability in terms of their functional potency in vitro were observed. When the osteogenic potential of all 133 CFU-F clones at passage 1 was quantitatively compared to their vascular tubule supportive capacity (Fig. 3), the strength of the association between these variables was significant with a Pearson’s correlation coefficient (r) of 0.3855 (p< 0.0001). Hence, there was a moderately posi-tive relationship between increased osteogenesis and in-creased total tubule length in the co-culture assays
(Fig. 3). The spread of the data was, however, relatively large, forming a cone like pattern (grey shaded area). Next, we compared, quantitatively, the vascular supportive po-tential with the osteogenic differentiation capacity of the CFU-F clones at passage 1 from the individual donors (Additional file 6: Figure S5). There was a moderately strong positive relationship between these variables for donors 2 and 3 (r= 0.6822,pvalue < 0.0001;r= 0.4125,p < 0.05 respectively). However, for donor 1, this relation-ship was poor (r= 0.1577;p(two tailed) = 0.2953). When the adipogenic potential of all CFU-F clones was quantita-tively compared to their osteogenic or their vascular tu-bule supportive capacity at passage 1 (Additional file 7: Figure S6A and S6B respectively), the strength of the asso-ciations between these variables was low (respective r values of 0.2898 and 0.1523 with respectivepvalues (two tailed) of < 0.001 and 0.0800). Notably, the correlation be-tween adipogenic and vascular supportive potency of the CFU-F clones was not significantly different from zero.
Transcriptome profiling of clonal CFU-F cultures by RNAseq
The findings described above suggest some degree of importance of either tri-lineage AOC or osteogenic, but
not adipogenic, differentiation capacity in the ability of hBM MSCs to support endothelial tubule formation. However, due to the large degree of spread within the data, it is likely that other factors are also at play. These would include donor variability in CFU-F content and function. To discover gene fingerprints of the CFU-F clones which might predict these differences in potential-ity, transcriptome profiling was performed using RNAseq. One hundred viable single cells from each of 16 CFU-F clones (that were good or poor supporters of vascular tu-bule networks as described in Table 2) were flow sorted and cDNA libraries generated using the method described [60]. All of these, 16 CFU-F-derived clones for RNAseq were characterised by osteogenic potential and vascular
supportive activity being in either the upper or lower quartiles (red-coloured clones in Fig.3).
We detected 11,698 transcripts expressed by the 16 selected CFU-F clones (Additional file 8: Table S2). In-cluded amongst these are 28 well-characterised genes found in hBM MSCs (Fig. 4a). The results demonstrate consistently high levels of expression of some genes as-sociated with hBM MSC longevity or quiescence (e.g. SPARC/OSTEONECTIN,TIMP1) and generally high, but slightly variable, levels of expression of MSC-associated adhesion or growth factor receptor transcripts (ITGB1, CD44, ALCAM, SDC2/CD362, VCAM-1, PDGFRA, THY1/CD90,ITGB5) across all 16 CFU-F clones. In con-trast, other genes involved in skeletal formation and/or
angiogenesis (e.g. GREM1, RUNX2, SOX9, MCAM/ CD146, PPARG) were more variably or not as highly expressed across these 16 clones. This was particularly evident for master genes for chondrogenesis (SOX9) and adipogenesis (PPARG), when compared to osteogenesis (RUNX2). Genes expressed by the 16 clones at high levels (in the upper quartile range of expression magni-tude), compared with genes expressed at levels in the lower quartile range, were enriched for many signalling pathways involving integrins and hypoxia-inducible fac-tors (HIF; Additional file9: Figure S7). The most signifi-cant of these were involved in integrin-mediated cell adhesion (p= 1.517E−10, FDR = 1.288E−08) and migra-tion, and in the role of tetraspanins in integrin-mediated cell adhesion (p= 7.175E−09, FDR = 3.807E−07).
The 16 CFU-F-derived clones were also divided into different groups based on their tri-lineage, osteogenic, chondrogenic and adipogenic potential, and EdgeR used to explore the degree of differential expression dependent on each attribute. Osteogenic potential showed the most dy-namic changes in gene expression with RNAseq (Fig. 4b). A total of 332 genes were differentially expressed in these 16 clones using an FDR < 0.1, while 161 genes were differ-entially expressed when determined using an FDR < 0.05
(Fig. 4b, Additional file 10: Table S3). The proangiogenic factor CXCL12 (FDR = 0.086, 2.23 times upregulated in high osteogenic potential clones) was amongst the 332 genes differentially expressed at the lower stringency. Hier-archical clustering of the 16 clones using the 161 genes dif-ferentially expressed at the higher stringency broadly divides the clones into two clusters, low vs high osteogenic potential clones, with the exception of a single clone with low osteogenic potential which clusters with the high osteo-genic potential clones (Fig. 4b). The 48 transcripts more highly expressed in clones with a higher osteogenic poten-tial include growth factor receptor-bound protein 14 (GRB14, FDR = 0.038, 18.6-fold upregulated), BCL2-associated agonist of cell death (BAD, FDR = 0.039, threefold upregulated), transforming growth factor beta 1 induced transcript 1 (TGFB1I1, FDR = 0.019, 2.9-fold up-regulated), the angiogenesis-associated long non-coding RNA MALAT1 (FDR = 0.018, sevenfold upregulated), and the angio-associated migratory cell proteinAAMP(FDR = 0.037, threefold upregulated). Ontology analysis using Gen-eCoDis [70] revealed that these 48 genes were significantly enriched for the VEGF signalling pathway (hypergeometric p value (Hyp) = 0.0028) and angiogenesis (Hyp = 0.0012). Genes more highly expressed in clones with lower
osteogenic potential includeNOTCH2,EGLN1,TNFRSF19, UNC5B and COL12A1 (Fig. 4b; Additional file 10: Table S3) and were enriched for GO processes such as wound healing (p= 3.10E−04, FDR < 0.1), cardiovascular system development (p= 1.63E−10, FDR < 0.05), angiogenesis (p= 2.63E−05, FDR < 0.1) and bone remodelling (p= 4.72E−04, FDR < 0.05). qPCR analyses of five candidate genes (Fig.4c) which were differentially expressed in higher (CXCL12, BAD,GRB14) versus lower (COL12A1,EGLN1) osteogenic potential CFU-F clones confirmed the differential expres-sion of these genes observed in RNAseq. In terms of vascu-lar supportive functions, tripotent AOC clones used for RNA sequencing include three good supporters of vascular-isation and four poor supporters (Additional file11: Figure S8). Of note,TNFSF15 andEPGN are amongst ten genes differentially expressed (FDR < 0.05) between these two groups, being 16.4- and 1650-fold downregulated, while LRIG2was 12.9-fold upregulated, in AOC good, compared to poor, vascular supporters; these three genes are known to negatively or positively regulate blood vessel formation (Additional file12: Table S4).
The W8B2 antibody identifies mesenchymal stem cell antigen-1 (MSCA-1), which is restricted to CD271brightCD45− hBM MSCs with a high CFU-F cap-acity [29]. Of 11,698 transcripts detected in our hBM MSCs (UoOX hBM MSC), 26.6% were also detected in a recently described primary W8B2+ enriched hBM MSC subset [67] (Fig.5). The upper three quartiles of expres-sion values of W8B2+ transcripts shared with our UoOX hBM MSCs are higher than those of transcripts unique to the W8B2+ subset (i.e. absent from our hBM MSCs; p< 0.0001, two-tailed t test, t= 144, df = 6523), demon-strating that transcripts expressed by our MSCs overlap with the more highly expressed transcripts detected by Zhang et al. [68]. Genes expressed by both sets of hBM MSCs include HOX transcription factor genes (HOXA1, HOXA4, HOXA5, HOXA7, HOXA11, HOXB3, HOXB7, HOXC8, HOXC9), as well as genes that regulate blood
vessel formation, haematopoiesis, osteogenesis, chondro-genesis and adipochondro-genesis (e.g. ANGPTL4, ANGPTL5, BMP3, BMP4, EPGN, FZD1, FZD7, FGF2, GHR, GJA1, GRB14,IL7,IL15,JAG1,NOG,OMD,PCOLCE,PDGFD, PPARG, SFRP1, SPARC, SOX9, TGFB2, TGFB3, TNFRSF11B,TNFSF15); some of these have been impli-cated in bone fracture repair.
Discussion
The healing of bone fractures is complex, involving the inflammatory, repair and remodelling processes [71,72]. The initial trauma with disruption of the blood supply is followed by the formation of a hematoma, which contains peripheral blood inflammatory cells and pro-inflammatory cytokines. With the release of pro-inflammatory and angiogenic factors, macrophage subsets and endothelial cells are attracted to the fracture site and then to the hematoma. The former cells then in-fluence intramembranous bone formation and endo-chrondral ossification, while the latter cells drive new blood vessel formation and provide the associated peri-cytes or MSCs for osteogenic repair. These MSCs also suppress the inflammatory response [71, 72]. Delayed
fracture healing can be caused by poor vascularisation and inadequate osteoprogenitor cell numbers, as ele-gantly reviewed in [73].
As new blood vessel formation is critical to bone fracture repair, we analysed, in this manuscript, the potential of clonally derived hBM MSC both to simultaneously support angio-/vasculo-genesis and for osteogenesis. We found that the majority of hBM MSC clones, which supported increased blood vessel formation in vitro were amongst those CFU-F-derived hBM MSCs which supported tri-lineage (AOC), and to a lesser extent bi-lineage (OC), differentiation. It is notable that the majority of the clones possessed these charac-teristics and hence it proved difficult to assess the con-tribution of other clones. However, the tri-lineage AOC clones at p1 were heterogeneous in their relative levels of vascular supportive potential. When we compared quantitatively the osteogenic or adipogenic differenti-ation potential of all the CFU-F-derived clones (whether they exhibited tripotent (AOC), bipotent (AO, AC or OC) or unipotent (O or A) potential) with their vascular tubule supportive capacity, we found a moderately strong correlation between increased osteogenesis and
Fig. 5Comparison of hBM MSC RNA sequencing results with W8B2+ hBM MSC dataset.aVenn diagram showing the number of expressed genes shared between the datasets from this study (UoOX hBM MSCs) and from the published W8B2+ hBM MSCs data of Zhang et al. [68].b
increased vascular supportive activity for two of three bone marrow donors examined. Thus, the correlation was donor dependent. There was no correlation between vascular supportive potential and increased adipogenesis of the CFU-F clones.
Our previous studies [73] have demonstrated that human cardiac-derived MSCs (termed cardiosphere-derived cells) from patients with ischemic heart disease also possess dif-ferent donor-dependent levels of vascular supportive ability. In those studies, we showed that the potency of the cardiac-derived MSCs in reparative healing in an in vivo surrogate model of myocardial infarction was associated with their vascular supportive ability. This provides a con-sistent theme that assessing vascular supportive activity and, in this manuscript, also osteogenic potential, would very likely assist in identifying those patients who would benefit most from the use of autologous hBM MSC for rep-arative healing of large bone fractures and thus provides a basis for future studies. Why these differences in potency of hBM MSCs exist has not been fully explored. Likely mecha-nisms include both a genetic basis and environmental influ-ences. Indeed, our recent studies suggest that environmental factors during pregnancy and early post-natal life can alter the molecular signature of cells leading to reduced blood vessel formation post-natally and increasing disease risk in later life [74,75].
When we compared the transcriptomic profiles of 16 selected CFU-F clones with those found in the freshly isolated immature W8B2+ hBM MSC subset described by Zhang et al. [68], 26.6% of the expressed genes were shared. These included many genes with osteogenic (SPARC/OSTEONECTIN, BMP3/OSTEOGENIN, BMP4, TNFRS11B/OSTEOPROTEGERIN, OMD/OSTEOMO-DULIN, FGF2) and vascular (ANGLT4, EPGN, FGF2, FZD7, FGF2, GHR, GJA1, JAG1, NOG, PDGD, SFRP1, TGFB2,TGFB3,TNFSF15) regulatory functions. To bet-ter define the molecular signatures of clonal hBM MSC CFU-F, which display high osteogenic potential and also support high levels of new blood vessel formation, we further examined the RNAseq profiles of defined CFU-F clones at P1 with these characteristics.
A number of genes that regulate blood vessel formation were also differentially expressed in the CFU-F clones with high osteogenic and good vascular supportive activities in vitro. Interestingly, we observed upregulation of CXCL12, and enrichment for the VEGF signalling pathway (e.g.BAD, the BCL2-associated agon-ist of cell death involved in cell survival) in the CFU-F clones with high osteogenic potential. VEGF signalling not only couples osteogenesis to angiogenesis, but also controls osteoblast differentiation and function (reviewed in [72]). Notably, CXCL12 co-operates with VEGF to promote hBM MSC-induced new blood vessel formation [48,76] by upregulating the CXCL12 receptor
CXCR4 on endothelial cells. This serves to enhance vas-cular network formation by allowing endothelial tip-like cells to extend towards the CXCL12 guidance cue on ad-jacent endothelial cells or by promoting the integration of endothelial precursors (termed ECFC) into the devel-oping vascular networks [48]. We also found that the lnc-RNA, MALAT1 (metastasis-associated lung adeno-carcinoma transcript 1) was enriched in hBM MSC clones with high osteogenic potential. This lnc-RNA has an important role in osteogenic differentiation, promot-ing bone formation and mineralisation [77]. MALAT1 also promotes the proliferation of human endothelial stalk cells and suppresses endothelial migratory activity [78]. Since MALAT1 has been reported to promote cancer-induced angiogenesis through exosomal transfer from stromal cells to other cells in the tumour environ-ment [79], we might speculate that a similar mechanism occurs in bone regeneration between hBM MSCs with high osteoblastic potential and endothelial cells, thereby communicating the need for and promoting enhanced vessel formation during bone fracture repair. This is an area for further investigation and beyond the scope of this current manuscript. Additionally, LRIG2 (leucine-r-ich repeats and immunoglobulin-like domains 2) was upregulated in those AOC tri-lineage CFU-F clones with good vascular supportive activity. This molecule has been reported to enhance human vascular endothelial cell migration and tubule formation, a mechanism which may involve the VEGF signalling pathway [80].
evidence presented in this manuscript support the view that there is some degree of importance of either tri-lineage AOC or osteogenic, but not adipogenic, differ-entiation capacity in the ability of hBM MSCs to support endothelial tubule formation. However, it is likely that other factors (including donor variability in CFU-F con-tent and function) also come into play. These will likely become the focus of future research efforts that will aid the translation of these cells into optimal clinical practice.
Conclusion
In conclusion, we have identified a moderately strong correlation between osteogenic and vascular supportive potential of CFU-F clones at p1 but show that this is donor dependent. Furthermore, we have defined import-ant gene signatures which characterise the potential of these clones to promote osteogenesis and new blood ves-sel formation, processes required for enhancing the repair of significant bone fractures in difficult to treat patients.
Additional files
Additional file 1:Figure S1.Examples of assays used to assess potency
of CFU-F clonal cultures at P1. Left panel: Examples of high (left), inter-mediate (middle) and poor (right) levels of adipogenic, chondrogenic, osteogenic and vascular supportive capacity of CFU-F clones at P1. Right panel: Examples of positive (left) versus negative (right) control cultures (Control non CFU-F selected hBM MSC) for adipogenic, chondrogenic and osteogenic differentiation capacity. Also shown is an example of vas-cular tubule growth by HUVECs used as the positive control for standard-isation between experiments. (TIF 2171 kb)
Additional file 2:Table S1.Phenotype of hBM MSCs p1. (DOCX 14 kb)
Additional file 3:Figure S2.CFU-F clonal assay. a and b) show typical
morphology of CFU-F clones in culture at P1. c-e) show CFU-F clones from human bone marrow aspirates at D14, each set from the 3 different donors. (TIF 1206 kb)
Additional file 4:Figure S3.CFU-F morphologies at P1. Shown is the
spindle like fibroblastoid morphology for 24 individual CFU-F clones at P1 from bone marrow donor 1. (TIF 4276 kb)
Additional file 5:Figure S4.CFU-F morphologies at P1. Shown is the
spindle like fibroblastoid morphology for 28 individual CFU-F clones at P1 from bone marrow donor 2. (TIF 4980 kb)
Additional file 6:Figure S5.Correlations between osteogenic lineage
differentiation potential and vascular tubule supportive capacity. Clonal hBM MSC CFU-F cultures at p1 were assayed quantitatively for their osteogenic differentiation potential after culture in osteogenic differenti-ation media, relative to the control non CFU-F selected hBM MSC sample (Control), which was set at 100%, and the correlation between osteo-genic and vascular supportive activity assessed. A to C) Pearson’s correl-ation coefficient (r) was calculated for individually for each donor bone marrow aspirate (donor 1–3 respectively). The strongest positive relation-ship between the vascular tubule supportive function and the osteogenic potential was for CFU-F clones from donor 2 (B) when these were assessed quantitatively (p [2 tailed] < 0.0001;n= 63 clones). (TIF 466 kb)
Additional file 7:Figure S6.Correlations between adipogenic lineage
differentiation potential with osteogenic or vascular tubule supportive capacity. Clonal hBM MSC CFU-F cultures at p1 were assayed quantita-tively for their adipogenic, osteogenic or vascular supportive potential after culture in specific differentiation media or assays, relative to the con-trol non CFU-F selected hBM MSC sample (Concon-trol), which was set at 100%. Correlations were determined using Pearson’s correlation coeffi-cient (r) for the 3 bone marrow donor aspirates between A) osteogenic
and adipogenic lineage differentiation potential and B) adipogenic versus vascular supportive capacity for the 3 donor bone marrows tested. Both show poor correlations between osteogenic vs adipogenic potential and adipogenic vs vascular supportive activity. (TIF 6791 kb)
Additional file 8:Table S2.Reads Per Kilobase of transcript per Million
mapped reads (RPKM) for the sixteen sequenced clones. (XLSX 2919 kb)
Additional file 9:Figure S7.Pathways enriched in genes in the upper
expression quartile versus the lower expression quartile. The negative log of thepvalue returned by Metacore for association of genes with pathways. Red, upper quartile (Metacore objects exclusively associated with the most highly expressed genes); Blue, lower quartile (Metacore objects exclusively associated with the least highly expressed genes). Purple, Metacore objects in common between the two sets of genes. (TIF 774 kb)
Additional file 10:Table S3.Genes differentially Expressed between
clones with high osteogenic potential (HOP) and those with low osteogenic potential (LOP). (DOCX 81 kb)
Additional file 11:Figure S8.CFU-F clones with AOC tri-lineage
differ-entiation potential and differing vascular tubule supportive capacity se-lected for RNA sequencing. Clonal cultures from 3 different bone marrow donors were categorised into groups based on their AOC differentiation potential and this potency plotted against their ability to support day 14 vascular tubule formation in co-culture assays with HUVEC as measured by the total tubule length. The total tubule length was normalised as a percentage of that obtained using a control non CFU-F selected hBM MSC sample (Control) which was set at 100%. The bar represents the mean total tubule length (TTL) for each lineage subgroup. The red coloured dots were clones from the AOC subset selected for sorting and RNA sequencing. (TIF 205 kb)
Additional file 12:Table S4.Genes differentially expressed between
good and poor vascular supportive CFU-F clones. (DOCX 285 kb)
Abbreviations
A:Adipogenic; BSA: Bovine serum albumin; C: Chondrogenic; CFU-F: Colony forming unit-fibroblastoid; DAPI: 4′,6-Diamidino-2-phenylindole,
dihydrochloride; EGM2: Endothelial growth medium 2; FACS: Fluorescence-activated cell sorter; FDR: False discovery rate; hBM MSCs: Human bone marrow mesenchymal stem/stromal cells; HUVEC: Human umbilical vein endothelial cell; MSCGM: Mesenchymal stem/stromal cell growth medium; MSCs: Mesenchymal stem/stromal cells; MSPCs: Mesenchymal stem and progenitor cells; O: Osteogenic; P1: Passage 1; PBS: Phosphate-buffered saline; PFA: Paraformaldehyde; RNAseq: RNA sequencing; SSCs: Skeletal stem cells; TTL: Total tubule length; UoOx: University of Oxford
Acknowledgements
Not applicable.
Funding
We thank the High-Throughput Genomics Group at the Wellcome Trust Centre for Human Genetics (funded by Wellcome Trust grant reference 090532/Z/09/Z) for the generation of the sequencing data. SMW received grant support for these studies from the National Institute of Health Research under its Programme Grants Scheme (RP-PG-0310-1001 and -1003), the NHSBT Trust Fund, NHS Blood and Transplant, Restore Burns and Wound Healing Trust, EU Merlin FP7 grant (602363) and the University of Oxford. PH received support for these studies from the Uni-versity of Oxford. The views expressed in this publication are those of the authors and not necessarily those of NHS, NHS Blood and Transplant, NIHR or the Depart-ment of Health.
Availability of data and materials
Our data are available through National Center for Biotechnology Information Gene Expression Omnibus using accession number GSE117844: (https://www.ncbi.nlm.nih.gov/geo/query/acc.cgi?acc=GSE117844).
Authors’contributions
assembled and interpreted the cellular data, and contributed to manuscript writing. PH designed, performed, analysed, assembled and interpreted the qPCR data, and critically revised the manuscript. ER carried out bioinformatics analyses, assembly and interpretation. NA contributed to the RNAseq experiments and their design. SYL provided transcriptomic databases for W8B5 sample comparison. SMW designed experiments, provided financial support, analysed and interpreted data, and wrote the manuscript. All authors reviewed the manuscript and gave their permission to submit it for publication.
Ethics approval and consent to participate
Not applicable.
Consent for publication
Not applicable.
Competing interests
The authors declare that they have no competing interests.
Publisher’s Note
Springer Nature remains neutral with regard to jurisdictional claims in published maps and institutional affiliations.
Author details 1
Stem Cell Research, Nuffield Division of Clinical Laboratory Medicine, Radcliffe Department of Medicine, University of Oxford, John Radcliffe Hospital, Oxford OX3 9BQ, UK.2Stem Cell Research, NHS Blood and Transplant, John Radcliffe Hospital, Oxford OX3 9BQ, UK.3Weatherall Institute of Molecular Medicine, Radcliffe Department of Medicine, John Radcliffe Hospital, Oxford OX3 9BQ, UK.4Department of Surgery, University of Melbourne, Fitzroy, Victoria 3065, Australia.5O’Brien Institute Department, St. Vincent’s Institute of Medical Research, Fitzroy, Victoria 3065, Australia.
Received: 21 August 2018 Revised: 28 November 2018 Accepted: 30 November 2018
References
1. Bianco P, Robey PG. Skeletal stem cells. Development. 2015;142(6):1023–7. 2. Boulais PE, Frenette PS. Making sense of hematopoietic stem cell niches.
Blood. 2015;125(17):2621–9.
3. Fierro FA, Nolta JA, Adamopoulos IE. Concise review: stem cells in osteoimmunology. Stem Cells. 2017;35(6):1461–7.
4. Kfoury Y, Scadden DT. Mesenchymal cell contributions to the stem cell niche. Cell Stem Cell. 2015;16(3):239–53.
5. Le Blanc K, Davies LC. MSCs-cells with many sides. Cytotherapy. 2018;20(3):273–8. 6. Samsonraj RM, Raghunath M, Nurcombe V, et al. Concise review:
multifaceted characterization of human mesenchymal stem cells for use in regenerative medicine. Stem Cells Transl Med. 2017;6(12):2173–85. 7. Watt SM, Gullo F, van der Garde M, et al. The angiogenic properties of
mesenchymal stem/stromal cells and their therapeutic potential. Br Med Bull. 2013;108:25–53.
8. Bernardo ME, Fibbe WE. Mesenchymal stromal cells: sensors and switchers of inflammation. Cell Stem Cell. 2013;13:392–402.
9. Caplan AI. MSCs: the sentinel and safe-guards of injury. J Cell Physiol. 2016; 231(7):1413–6.
10. Fontaine MJ, Shih H, Schäfer R, et al. Unraveling the mesenchymal stromal cells' paracrine immunomodulatory effects. Transfus Med Rev. 2016;30(1):37–43. 11. Hoogduijn MJ. Are mesenchymal stromal cells immune cells? Arthritis Res
Ther. 2015;17:88.
12. Najar M, Raicevic G, Fayyad-Kazan H, et al. Mesenchymal stromal cells and immunomodulation: a gathering of regulatory immune cells. Cytotherapy. 2016;18(2):160–71.
13. Prockop DJ. Inflammation, fibrosis, and modulation of the process by mesenchymal stem/stromal cells. Matrix Biol. 2016;51:7–13.
14. Bianco P. Mesenchymal‘stem’cells. Annu Rev Cell Dev Biol. 2014;30:677–704. 15. Dimmeler S, Ding S, Rando TA. Translational strategies and challenges in
regenerative medicine. Nat Med. 2014;20:814–21.
16. Trounson A, McDonald C. Stem cell therapies in clinical trials: progress and challenges. Cell Stem Cell. 2015;17(1):11–22.
17. Castro-Malaspina H, Gay RE, Resnick G, et al. Characterization of human bone marrow fibroblast colony-forming cells (CFU-F) and their progeny. Blood. 1980;56:289–301.
18. Friedenstein AJ, Petrakova KV, Kurolesova AI, et al. Heterotopic of bone marrow. Analysis of precursor cells for osteogenic and hematopoietic tissues. Transplantation. 1980;6(2):230–47.
19. Friedenstein AJ, Chailakhyan RK, Latsinik NV, et al. Stromal cells responsible for transferring the microenvironment of the hemopoietic tissues. Cloning in vitro and retransplantation in vivo. Transplantation. 1974;17:331–40.
20. Pittenger MF, Mackay AM, Beck SC, et al. Multilineage potential of adult human mesenchymal stem cells. Science. 1999;284:143–7.
21. Dominici M, Le Blanc K, Mueller I, et al. Minimal criteria for defining multipotent mesenchymal stromal cells. The International Society for Cellular Therapy position statement. Cytotherapy. 2006;8:315–7. 22. Muraglia A, Cancedda R, Quarto R. Clonal mesenchymal progenitors from
human bone marrow differentiate in vitro according to a hierarchical model. J Cell Sci. 2000;113(Pt 7):1161–6.
23. Banfi A, Muraglia A, Dozin B, et al. Proliferation kinetics and differentiation potential of ex vivo expanded human bone marrow stromal cells: implications for their use in cell therapy. Exp Hematol. 2000;28(6):707–15.
24. Russell KC, Phinney DG, Lacey MR, et al. In vitro high-capacity assay to quantify the clonal heterogeneity in trilineage potential of mesenchymal stem cells reveals a complex hierarchy of lineage commitment. Stem Cells. 2010;28:788–98.
25. Grisendi G, Annerén C, Cafarelli L, et al. GMP-manufactured density gradient media for optimized mesenchymal stromal/stem cell isolation and expansion. Cytotherapy. 2010;12(4):466–77.
26. Horn P, Bork S, Diehlmann A, et al. Isolation of human mesenchymal stromal cells is more efficient by red blood cell lysis. Cytotherapy. 2008; 10(7):676–85.
27. Woodell-May JE, Tan ML, King WJ, et al. Characterization of the cellular output of a point-of-care device and the implications for addressing critical limb ischemia. Biores Open Access. 2015;4(1):417–24.
28. Aslan H, Zilberman Y, Kandel L, et al. Osteogenic differentiation of noncultured immunoisolated bone marrow-derived CD105+ cells. Stem Cells. 2006;24:1728–37.
29. Battula VL, Treml S, Bareiss PM, et al. Isolation of functionally distinct mesenchymal stem cell subsets using antibodies against CD56, CD271, and mesenchymal stem cell antigen-1. Haematologica. 2009;94:173–84. 30. Boiret N, Rapatel C, Veyrat-Masson R, et al. Characterization of nonexpanded
mesenchymal progenitor cells from normal adult human bone marrow. Exp Hematol. 2005;33:219–25.
31. Bühring HJ, Battula VL, Treml S, et al. Novel markers for the prospective isolation of human MSC. Ann N Y Acad Sci. 2007;1106:262–71. 32. Churchman SM, Ponchel F, Boxall SA. Transcriptional profile of native CD271+
multipotential stromal cells: evidence for multiple fates, with prominent osteogenic and Wnt pathway signaling activity. Arthritis Rheum. 2012;64(8):2632–43. 33. Churchman SM, Boxall SA, McGonagle D, et al. Predicting the remaining
lifespan and cultivation-related loss of osteogenic capacity of bone marrow multipotential stromal cells applicable across a broad donor age range. Stem Cells Int. 2017;2017:6129596.
34. Crisan M, Yap S, Casteilla L, et al. A perivascular origin for mesenchymal stem cells in multiple human organs. Cell Stem Cell. 2008;3:301–13. 35. Gronthos S, Zannettino AC, Hay SJ, et al. Molecular and cellular
characterisation of highly purified stromal stem cells derived from human bone marrow. J Cell Sci. 2003;116:1827–35.
36. Harkness L, Zaher W, Ditzel N, et al. CD146/MCAM defines functionality of human bone marrow stromal stem cell populations. Stem Cell Res Ther. 2016;7:4. 37. Jones E, English A, Churchman SM, et al. Large-scale extraction and
characterization of CD271+ multipotential stromal cells from trabecular bone in health and osteoarthritis: implications for bone regeneration strategies based on uncultured or minimally cultured multipotential stromal cells. Arthritis Rheum. 2010;62(7):1944–54.
38. Li H, Ghazanfari R, Zacharaki N, et al. Low/negative expression of PDGFR-α identifies the candidate primary mesenchymal stromal cells in adult human bone marrow. Stem Cell Reports. 2014;3(6):965–74.
39. Mabuchi Y, Morikawa S, Harada S, et al. LNGFR(+)THY-1(+)VCAM-1(hi+) cells reveal functionally distinct subpopulations in mesenchymal stem cells. Stem Cell Rep. 2013;1:152–65.
41. Sacchetti B, Funari A, Michienzi S, et al. Self-renewing osteoprogenitors in bone marrow sinusoids can organize a hematopoietic microenvironment. Cell. 2007;131(2):324–36.
42. Simmons PJ, Torok-Storb B. Identification of stromal cell precursors in human bone marrow by a novel monoclonal antibody, STRO-1. Blood. 1991;78:155–62. 43. Tormin A, Li O, Brune JC, et al. CD146 expression on primary
nonhematopoietic bone marrow stem cells is correlated with in situ localization. Blood. 2011;117:5067–77.
44. Zhou BO, Yue R, Murphy MM, et al. Leptin-receptor-expressing mesenchymal stromal cells represent the main source of bone formed by adult bone marrow. Cell Stem Cell. 2014;15:154–68.
45. Robey PG, Kuznetsov SA, Ren J, et al. Generation of clinical grade human bone marrow stromal cells for use in bone regeneration. Bone. 2015;70:87–92. 46. Galipeau J, Krampera M, Barrett J, et al. International Society for Cellular
Therapy perspective on immune functional assays for mesenchymal stromal cells as potency release criterion for advanced phase clinical trials. Cytotherapy. 2016;18:151–9.
47. Athanassopoulos A, Tsaknakis G, Newey SE, et al. Microvessel networks pre-formed in artificial clinical grade dermal substitutes in vitro using cells from haematopoietic tissues. Burns. 2012;38(5):691–701.
48. Newey SE, Tsaknakis G, Khoo CP, et al. The hematopoietic chemokine CXCL12 promotes integration of human endothelial colony forming cell-derived cells into immature vessel networks. Stem Cells Dev. 2014; 23(22):2730–43.
49. Roubelakis MG, Tsaknakis G, Pappa KI, et al. Spindle shaped human mesenchymal stem/stromal cells from amniotic fluid promote neovascularization. PLoS One. 2013;8(1):e54747.
50. Walker NG, Mistry AR, Smith LE, et al. A chemically defined carrier for the delivery of human mesenchymal stem/stromal cells to skin wounds. Tissue Eng Part C Methods. 2012;18(2):143–55.
51. Carpenter L, Malladi R, Yang CT, et al. Human induced pluripotent stem cells are capable of B-cell lymphopoiesis. Blood. 2011;117(15):4008–11. 52. French A, Yang CT, Taylor S, et al. Human induced pluripotent stem
cell-derived B lymphocytes express sIgM and can be generated via a hemogenic endothelium intermediate. Stem Cells Dev. 2015;24(9):1082–95.
53. Yang CT, French A, Goh PA, et al. Human induced pluripotent stem cell derived erythroblasts can undergo definitive erythropoiesis and co-express gamma and beta globins. Br J Haematol. 2014;166(3):435–48.
54. Zhou B, Tsaknakis G, Coldwell KE, et al. A novel function for the
haemopoietic supportive murine bone marrow MS-5 mesenchymal stromal cell line in promoting human vasculogenesis and angiogenesis. Br J Haematol. 2012;157(3):299–311.
55. Barabaschi GD, Manoharan V, Li Q, et al. Engineering pre-vascularized scaffolds for bone regeneration. Adv Exp Med Biol. 2015;881:79–94. 56. Eman RM, Meijer HA, Öner FC, et al. Establishment of an early vascular
network promotes the formation of ectopic bone. Tissue Eng Part A. 2016; 22(3–4):253–62.
57. Grosso A, Burger MG, Lunger A, et al. It takes two to tango: coupling of angiogenesis and osteogenesis for bone regeneration. Front Bioeng Biotechnol. 2017;5:68.
58. Hu K, Olsen BR. Osteoblast-derived VEGF regulates osteoblast differentiation and bone formation during bone repair. J Clin Invest. 2016;126(2):509–26. 59. Seebach C, Henrich D, Wilhelm K. Endothelial progenitor cells improve
directly and indirectly early vascularization of mesenchymal stem cell-driven bone regeneration in a critical bone defect in rats. Cell Transplant. 2012; 21(8):1667–77.
60. Picelli S, Faridani OR, Bjorklund AK, et al. Full-length RNA-seq from single cells using smart-seq2. Nat Protoc. 2014;9:171–81.
61. Dobin A, Davis CA, Schlesinger F, et al. STAR: ultrafast universal RNA-seq aligner. Bioinformatics. 2013;29:15–21 Version 2.4.0.
62. Li H, Handsaker B, Wysoker A, et al. The sequence alignment/map format and SAMtools. Bioinformatics. 2009;25:2078–9.
63. Liao Y, Smyth GK, Shi W. featureCounts: an efficient general purpose program for assigning sequence reads to genomic features. Bioinformatics. 2014;30:923–30.
64. Liao Y, Shi W. The Subread package: a toolkit for processing next-gen sequencing data.http://subread.sourceforge.netSourceForge package version. 2013; 1.4.5. Accessed 16 Feb 2017.
65. Robinson MD, McCarthy DJ, Smyth GK. edgeR: a Bioconductor package for differential expression analysis of digital gene expression data.
Bioinformatics. 2010;26:139–40.
66. Sturn A, Quackenbush J, Trajanoski Z. Genesis: cluster analysis of microarray data. Bioinformatics. 2002;18:207–8.
67. Oliveros JC. Venny. An interactive tool for comparing lists with Venn’s diagrams.http://bioinfogp.cnb.csic.es/tools/venny/. (2007-2015). 68. Zhang Y, Sivakumaran P, Newcomb AE, et al. Cardiac repair with a novel
population of mesenchymal stem cells resident in the human heart. Stem Cells. 2015;33:3100–13.
69. Alessio N, Bohn W, Rauchberger V, et al. Silencing of RB1 but not of RB2/P130 induces cellular senescence and impairs the differentiation potential of human mesenchymal stem cells. Cell Mol Life Sci. 2013; 70(9):1637–51.
70. Tabas-Madrid D, Nogales-Cadenas R, Pascual-Montano A. GeneCodis3: a non-redundant and modular enrichment analysis tool for functional genomics. Nucleic Acids Res. 2012;40(Web Server issue):W478–83. 71. Claes L, Recknagel S, Ignatius A. Fracture healing under healthy and
inflammatory conditions. Nat Rev Rheumatol. 2012;8(3):133–43. 72. Hu K, Olsen BR. Vascular endothelial growth factor control mechanisms in
skeletal growth and repair. Dev Dyn. 2017;246(4):227–34.
73. Harvey E, Zhang H, Sepúlveda P, et al. Potency of human cardiosphere-derived cells from patients with ischemic heart disease is associated with robust vascular supportive ability. Stem Cells Transl Med. 2017;6(5): 1399–411.
74. Yu GZ, Aye CY, Lewandowsk AJ, et al. Association of maternal antiangiogenic profile at birth with early postnatal loss of microvascular density in offspring of hypertensive pregnancies. Hypertension. 2016;68(3):749–59.
75. Yu GZ, Reilly S, Lewandowski AJ et al. Neonatal micro-RNA profile determines endothelial function in offspring of hypertensive pregnancies. Hypertension, 2018 (in press).
76. Stratman AN, Davis MJ, Davis GE. VEGF and FGF prime vascular tube morphogenesis and sprouting directed by hematopoietic stem cell cytokines. Blood. 2011;117(14):3709–19.
77. Peng S, Cao L, He S, et al. An overview of long noncoding RNAs involved in bone regeneration from mesenchymal stem cells. Stem Cells Int. 2018;2018:8273648. 78. Michalik KM, You X, Manavski Y, et al. Long noncoding RNA MALAT1 regulates
endothelial cell function and vessel growth. Circ Res. 2014;114(9):1389–97. 79. Sun Z, Yang S, Zhou Q, et al. Emerging role of exosome-derived long
non-coding RNAs in tumor microenvironment. Mol Cancer. 2018;17(1):82. 80. Yang HK, Chen H, Mao F, et al. Downregulation of LRIG2 expression inhibits
angiogenesis of glioma via EGFR/VEGF-A pathway. Oncol Lett. 2017;14(4):4021–8. 81. Regan J, Long F. Notch signaling and bone remodeling. Curr Osteoporos
Rep. 2013;11(2):126–39.
82. Izu Y, Ezura Y, Koch M, et al. Collagens VI and XII form complexes mediating osteoblast interactions during osteogenesis. Cell Tissue Res. 2016;364(3): 623–35 Erratum in: Cell Tissue Res 2016 Jun;364(3):677–9.
83. Sato T, Kokabu S, Enoki Y, et al. Functional roles of netrin-1 in osteoblast differentiation. In Vivo. 2017;31(3):321–8.
84. Xu H, Han Y, Liu B, et al. Unc-5 homolog B (UNC5B) is one of the key downstream targets of N-α-acetyltransferase 10 (Naa10). Sci Rep. 2016;6:38508. 85. Qiu W, Hu Y, Andersen TE, et al. Tumor necrosis factor receptor superfamily
member 19 (TNFRSF19) regulates differentiation fate of human
mesenchymal (stromal) stem cells through canonical Wnt signaling and C/ EBP. J Biol Chem. 2010;285(19):14438–49.
86. Ríos CN, Skoracki RJ, Mathur AB. GNAS1 and PHD2 short-interfering RNA support bone regeneration in vitro and in an in vivo sheep model. Clin Orthop Relat Res. 2012;470(9):2541–53.
87. HoWangYin KY, Loinard C, Bakker W, et al. HIF-prolyl hydroxylase 2 inhibition enhances the efficiency of mesenchymal stem cell-based therapies for the treatment of critical limb ischemia. Stem Cells. 2014;32(1):231–43. 88. Ko SH, Nauta AC, Morrison SD, et al. PHD-2 suppression in
mesenchymal stromal cells enhances wound healing. Plast Reconstr Surg. 2018;141(1):55e–67e.