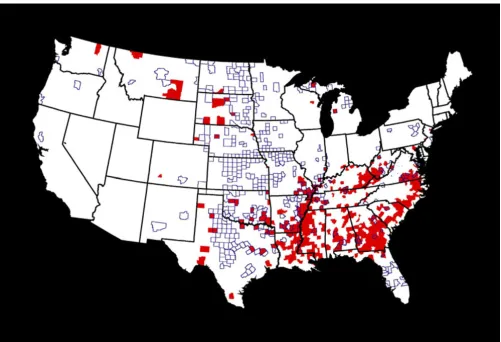
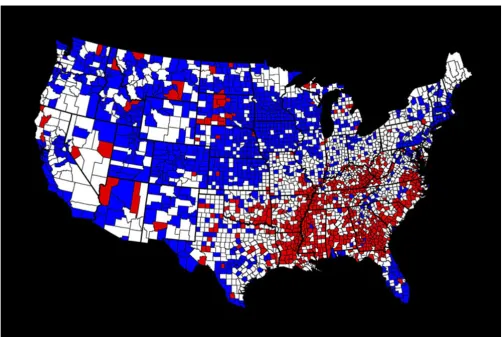
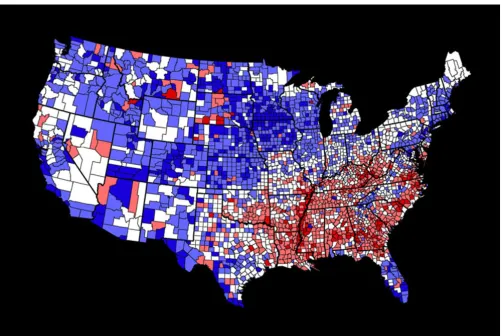
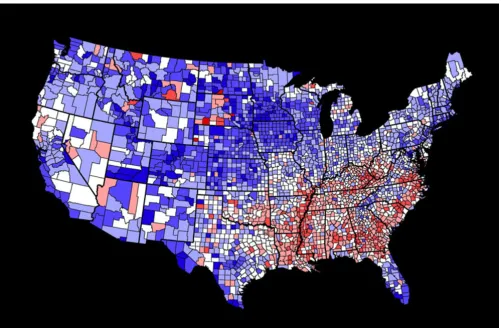
A brief visual primer for the mapping of mortality trend data
Full text
Figure


Related documents
Full complexity of multimode information logistics is seen when the combinations of internal and external networks of logistics for monitoring of conceptual correspondence
In the case of federalization (with pending privatization), we cannot find any consistent evidence across the different estimation techniques. Restructuring, on the other hand,
The presence and extent of myocardial fi brosis assessed by cardiac magnetic resonance (CMR) and high levels of cTnT predict poor prognosis in various cardiomyopathies.. However,
Articles’ descriptions of subjects’ body sizes were often found to differ from coders’ estimates, and subjects described as obese tended to represent the higher values of the obese
ISPITANICI I METODE: U istraživanje su uključeni ispitanici s dijagnozom adenokarcinoma pluća (32 muškaraca i 23 žene) kod kojih je provedeno testiranje na ALK i
Here, we have conducted next- generation sequencing of the miRNAs from three breast cancer cell lines – one ER+ line that is estrogen-dependent (MCF-7), and two ER+ long-term
(This is because the DPSS discards, or flushes, any outstanding requests whenever a new request arrives. For example, the TerraVision application sends a list of block requests
Although, there is a reduction in the observed shear failure from the state plot (Fig. 7) as compared to that of 2835 m, however, the extent of the horizontal,
