RESEARCH
Access to and availability of exercise facilities
in Madrid: an equity perspective
Luis Cereijo
1,2,3, Pedro Gullón
1,4*, Alba Cebrecos
1, Usama Bilal
4, Jose Antonio Santacruz
2,
Hannah Badland
3and Manuel Franco
1,5Abstract
Background: Identifying socioeconomic determinants that are associated with access to and availability of exercise facilities is fundamental to supporting physical activity engagement in urban populations, which in turn, may reduce health inequities. This study analysed the relationship between area-level socioeconomic status (SES) and access to, and availability of, exercise facilities in Madrid, Spain.
Methods: Area-level SES was measured using a composite index based on seven sociodemographic indicators. Exercise facilities were geocoded using Google Maps and classified into four types: public, private, low-cost and ses-sional. Accessibility was operationalized as the street network distance to the nearest exercise facility from each of the 125,427 residential building entrances (i.e. portals) in Madrid. Availability was defined as the count of exercise facili-ties in a 1000 m street network buffer around each portal. We used a multilevel linear regression and a zero inflated Poisson regression analyses to assess the association between area-level SES and exercise facility accessibility and availability.
Results: Lower SES areas had a lower average distance to the closest facility, especially for public and low-cost facili-ties. Higher SES areas had higher availability of exercise facilities, especially for private and seasonal facilifacili-ties.
Conclusion: Public and low-cost exercise facilities were more proximate in low SES areas, but the overall number of facilities was lower in these areas compared with higher SES areas. Increasing the number of exercise facilities in lower SES areas may be an intervention to improve health equity.
Keywords: Exercise, Socio-economic status, Exercise facilities, Inequities, Urban health
© The Author(s) 2019. This article is distributed under the terms of the Creative Commons Attribution 4.0 International License (http://creat iveco mmons .org/licen ses/by/4.0/), which permits unrestricted use, distribution, and reproduction in any medium, provided you give appropriate credit to the original author(s) and the source, provide a link to the Creative Commons license, and indicate if changes were made. The Creative Commons Public Domain Dedication waiver (http://creat iveco mmons .org/ publi cdoma in/zero/1.0/) applies to the data made available in this article, unless otherwise stated.
Background
Physical inactivity and sedentarism are major health con-cerns, as they are estimated to cause 3.2 million deaths globally annually, predominantly through chronic dis-eases, especially cardiovascular diseases [1–4]. Several studies have shown a social gradient in physical activity. For example, in Spain, those with the highest level of edu-cation also have the highest physical activity levels (73.4% classified as sufficiently active), compared with those with medium or low education levels (63.1% and 38.8% clas-sified as sufficiently active, respectively) [5]. Moreover,
this social gradient represents a health equity issue in the prevalence of overweight and obesity in Madrid; resi-dents that live in areas of lower SES have higher preva-lence of obesity and overweight [6].
Population approaches [7] seek to change the dis-tribution of risk factors within a population, through changing social determinants or environmental factors. An example of this is the neighbourhood built environ-ment [8, 9]. Systematic variation in the characteristics of the area of residence can contribute to disparities in physical activity [10]. For instance, access to physical activity resources may vary according to the sociode-mographic characteristics of the neighbourhood, such as the predominant ethnic group, the median income level, deprivation or the ageing distribution [10–14]. These may contribute to some of the differences shown
Open Access
*Correspondence: [email protected]
1 Social and Cardiovascular Epidemiology Research Group, School
of Medicine and Health Sciences, University of Alcalá, 28871 Alcalá de Henares, Madrid, Spain
between physical activity accumulation and individual-level socio-economic status [5].
Living closer to destinations that support physical activity (e.g. parks) has been associated with higher lev-els of physical activity [15–19]. In one hand, previous studies have showed how facility-rich environments encourage physical activity through the visual stimuli provided by the facilities presence and the numerous exercise models that they offer [20]. Secondly, it is usual that people report travel problems as a reason for quit-ting exercise programs [21]; living close to sport facili-ties reduces some psychological and physical barriers to exercise, such as travel time and traffic-related stress [20].
Evidence exists showing greater local access to sports facilities, such as gyms and sports fields, is indepen-dently associated with lower levels of adiposity [22]; other research has shown associations between the avail-ability of exercise facilities and exercise [20]. Areas with a higher combined availability of local exercise facilities and parks have lower odds of obesity [23]. Moreover, activities supported through exercise facilities (e.g. gyms) tend to be structured and at moderate to vigorous inten-sity (MVPA) [24], which produces greater health benefits [25, 26]. Moreover, the structured nature of the activities of this type of facilities make this activity more related with exercise. To wit, a physical activity that is planned, structured, repetitive, and purposive in the sense that improvement or maintenance of one or more compo-nents of physical fitness is an objective [27]. Despite this, relatively little research has examined the distribution of access to and availability of exercise facilities, such as gyms or swimming pools, by SES [22].
Previous studies show a clear social gradient in the practice of physical activity [28]. In low SES areas, where crime, or perceptions of crime, is often higher [29], exer-cise facilities play an important role in supporting health behaviours, as the streetscape and public open spaces may not be safe and aesthetically pleasing [30]. Iden-tifying whether there are inequities in access and avail-ability of exercise facilities by area-level disadvantage is an important step to informing urban planning policies that can improve population health through the pathway of physical activity engagement. While some studies have looked at perceptions of exercise facility availability and its relationship with physical activity, fewer studies have used objective indicators [31, 32]. Of these studies, some lack a classification of facility types [22, 33], and those that do have a classification, have not included variables that condition access, such us price, ownership or ser-vices, but instead utilise a general typology classification [20, 34]. This is problematic because it does not allow us to know differentiated tendencies depending on the
different types of facilities, specially between public and private facilities.
However, a gap in the exercise facility literature relates to the concepts of accessibility and availability. Accord-ing to Penchansky and Thomas [35], accessibility incor-porates the physical location of services in relation to individuals and resources required, such as transport and monetary or time costs to reach a service; mean-while availability refers to the supply of health services, including the number and type of existing services [35]. Some studies define accessibility as the number of facili-ties available at a range of distances (buffers) around residents’ homes [34] or by zip code [14]; others as the number of facilities available per 1000 population [36], or whether facilities were pay- or free-for-use [13]. We argue examining accessibility and availability simulta-neously provides a more nuanced understanding of the exercise facility environment for a given region. Yet, to our knowledge, no research has examined both concepts of exercise facilities within the same study.
Building on these gaps in the evidence, the aim of the study was to investigate the associations between area-level socioeconomic status with access to and availability of different types of exercise facilities and its spatial dis-tribution using the case study of Madrid.
Methods Study setting
The study is part of the Heart Healthy Hoods project, which broadly aims to study associations between the social and physical urban environment with cardiovascu-lar health and inequity across Madrid, Spain [37].
This study was conducted across the municipality of Madrid, the capital of Spain. Madrid has a population of 3.2 M residents and is divided into 21 districts that house 128 neighbourhoods. Within each neighborhood there are small geographical administrative units of ~ 1500 people each, called census sections (N = 2415) [38]. Madrid’s socio-spatial configuration is one of the most segregated in Europe [39].
Exposure: area‑level socioeconomic status
The main exposure used in this study was a composite area-level socioeconomic status index created using seven socioeconomic status indicators: (1) low educa-tion; (2) high educaeduca-tion; (3) part-time employment; (4) temporary employment; (5) manual occupational class; (6) average housing prices (per m2); and (7)
the neighbourhood level. The area-level disadvantage index was calculated for each census section of the study area. The index has been used in other research [41], and further details regarding index construction are described in Additional file 1. For the purposes of this paper, the index was collapsed into deciles, where 1 = most disadvantaged census sections and 10 = least disadvantaged census sections.
Outcomes: exercise facilities
Exercise facilities were defined as indoor exercise facili-ties, both public and private, which offered physical activity programs, both with monthly subscription or pay per session (e.g. fitness clubs, sport centres, dance clubs, Pilates studios). Informal facilities (e.g. public parks or outdoor playing fields), cycling paths, private clubs (e.g. exercise facilities not accessible to the public, schools, or private sport clubs) were excluded.
Exercise facility information was collected by ‘MAS
Servicios Integrales’ between April and October of
2015. All exercise facilities across Madrid were identi-fied by Google Maps. Information about the programs and services were sourced through telephone and face-to-face interviews with facility managers. All facilities were visited physically to check the information col-lected. Data collection was carried out by four trained observers. Quality assurance was carried out by repeat-ing the above process again in two districts usrepeat-ing differ-ent trained data collectors.
The database used in this study comprised of 595 exercise facilities with five variables on facility char-acteristics. These were: (1) Name of the facility; (2) Address; (3) Monthly price; (4) Type of sports programs and services offered; (5) Ownership (public vs private). The exercise facilities were further classified into four exercise facility ‘types’, as described in Table 1. Similar classifications have been used in previous studies [14, 34].
Portal
We identified all residential building entrances in the city from CARTOCIUDAD [42] by identifying all external access identifiers located in a residential land use (total n of 125,440. We exclude entrances whose nearest facil-ity was located more than 6 km away (N = 13), as these entrances were located in the edge of the city of Madrid, and their closest exercise facility might not be in the city in Madrid, but in a surrounding small region. All the spatial measures were calculated using ArcGIS 10.1 software.
Measure of accessibility to exercise facilities
We calculated the distance from each portal (origin) to the nearest exercise facility (destination) using a street network analysis; this better represents the true spatial distance between points when compared with a Euclid-ean distance [43]. We calculated the distance to “any” exercise facility less than 6 km, and the distance to the nearest facility of each type (Table 1).
Measure of availability of exercise facilities
We calculated the availability (count) of exercise facilities in total and by type using a 1000 m street network buffer. There is empirical evidence suggesting 1000 m is the dis-tance people are most likely to walk to fulfil daily activi-ties [43]. In fact, previous studies showed that 1000 m from home to an exercise facility is the distance with the highest correlation with moderate to vigorous physi-cal activity [44], and this distance has previously been applied in exercise facility research [22, 44, 45].
Mapping of spatial distribution
Two cartographic maps were developed to facilitate the visualization of the spatial distribution of exercise facili-ties in terms of accessibility and availability. Those maps were made from the calculation of the average distance to the nearest exercise facility (accessibility) and number
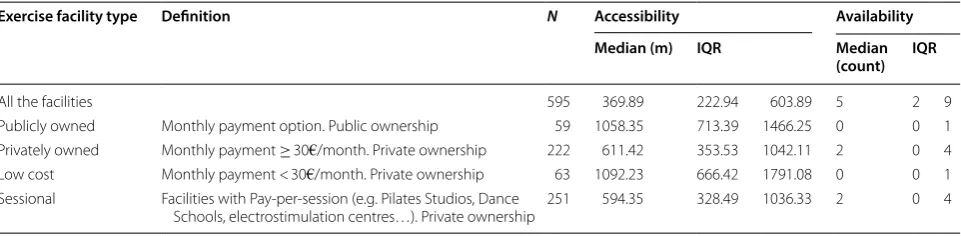
Table 1 Descriptive analysis of the exercise facilities about accessibility and availability
IQR interquartile range; m meters
Exercise facility type Definition N Accessibility Availability Median (m) IQR Median
(count) IQR
All the facilities 595 369.89 222.94 603.89 5 2 9
Publicly owned Monthly payment option. Public ownership 59 1058.35 713.39 1466.25 0 0 1 Privately owned Monthly payment ≥ 30€/month. Private ownership 222 611.42 353.53 1042.11 2 0 4 Low cost Monthly payment < 30€/month. Private ownership 63 1092.23 666.42 1791.08 0 0 1 Sessional Facilities with Pay-per-session (e.g. Pilates Studios, Dance
of exercise facilities 1000 m around (availability) of each census section.
Statistical analyses
To study the association between accessibility to the nearest exercise facility and area-level SES we used lin-ear mixed models with log transformed distance as the dependent variable and the SES index as the independ-ent variable. This was a three-level model with a random intercept for neighbourhood and for census section. We included the independent variable (SES Index) opera-tionalized as deciles, with the first decile (lowest SES) as the reference, group. To study the relationship between availability of exercise facilities and area-level SES, we used a Zero Inflated Poisson (ZIP) model. We chose a ZIP model instead of a mixed effects Poisson due to the high number of 0’s in the distribution of the dependent variable. We estimated robust standard errors clustered by census section to take into account the intra-census section correlation. We ran all models for all facilities and stratified by type of facility. All analyses were conducted using Stata/SE 14.1 for Mac (StataCorp., College Station, TX, USA).
Results
Overall, the median distance to the nearest exer-cise facility (any type) from each portal was 364 m (IQR =220 m–596 m). By type, low-cost facili-ties were furthest away (median distance = 1090 m, IQR = 663 m–1789 m), and sessional facilities were most proximate (median distance = 596 m, IQR = 331 m; 1035 m) (Table 1).
All portals had two or more exercise facilities of any type located within 1000 m, and half of the portals had
at least five facilities available at this distance. However, half of the portals had neither public exercise facilities nor low cost facilities available within 1000 m. Private and sessional facilities had the highest availability, with at least two exercise facilities available within 1000 m for half the portals.
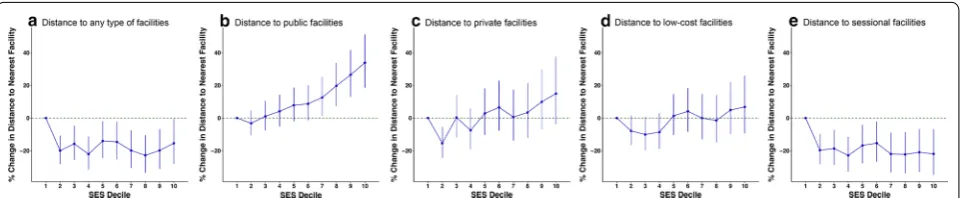
Exercise facility accessibility and SES
Overall, there was a social gradient in public, private and sessional facilities, where portals in low SES areas have better accessibility to the nearest exercise facility com-pared with higher SES areas (Fig. 1b–d). However, this association differed by type of facility. Areas with lower SES had higher accessibility to public exercise facili-ties (Fig. 1b). Similar patterns, though less strong, were observed for privately owned facilities (Fig. 1c) and low-cost facilities (Fig. 1d). In the case of sessional facilities, this gradient was unclear. Despite this, portals in the low-est SES areas (decile 1) had the lowlow-est accessibility to the nearest exercise facility. This was shown for all types of exercise facilities when compared with the next least-deprived SES decile.
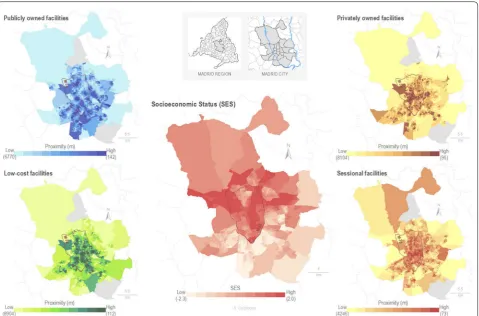
The spatial distribution of area-level SES and average distance to the nearest exercise facilities by type is shown in Fig. 2. The portals of the down-town area of Madrid (inside the M-30 orbital motorway of Madrid) show shorter distances to exercise facilities. Public exercise facilities are more accessible in the southern areas of the city when compared with the north, meanwhile the ses-sional exercise facilities show the opposite relationship. Low-cost and private exercise facilities were located most proximally in the downtown and southeastern areas. Pri-vate exercise facilities were located most proximally in the southwestern region.
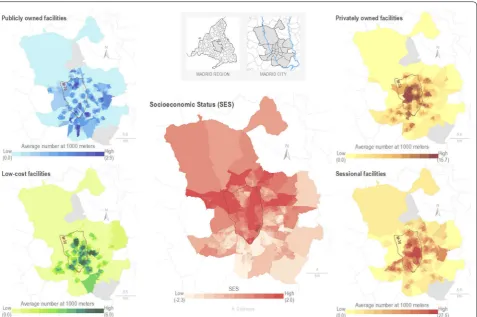
Exercise facility availability and SES
There is a reverse social gradient in the association to availability of exercise facilities (Fig. 3), as there is a higher density of facilities in higher SES areas. The strongest associations with availability were shown for private and sessional exercise facilities, with the number of facilities increasing in areas of higher SES. This pat-terning was not present when public or low cost exercise facilities were considered.
Figure 4 shows differences in the spatial distribution of the availability of exercise facility types between the down-town area of Madrid and the periphery of the city. Down-town and northern areas (high SES) have greater availability of all types of exercise facilities. Public facilities have a higher level of availability when compared with other facil-ity types, especially in the southern part of the cfacil-ity. Private and low-cost facilities have higher availability in the lower SES areas of the south than sessional facilities, which are more present in the higher SES areas of the north.
Fig. 2 Spatial distribution of census section average distance from each portals to the nearest exercise facilities by type, and Area-Level Socio-Economic Status Index by deciles in the census section (N = 2415) of the city of Madrid. Note m = meters; SES = socio-economic status
Discussion
This study showed that, while people in Madrid living in low SES areas had better access to exercise facilities, residents in higher SES areas had greater availability of exercise facilities. The relationship between accessibil-ity and area-level SES varied depending on the type of exercise facility, yet all types (except sessional facilities) presented a social gradient where distances generally tended to be more proximal in low SES areas. This gradi-ent was most strong for the publicly owned and low-cost facilities. The availability analysis showed an increased likelihood of having more than one facility available as area-level SES increased. This pattern was clearest with private and sessional facility types. Our paper builds on this novelty research by further classifying exercise facili-ties into types, collecting primary data, and examining the socio-spatial patterning of exercise facilities by access and availability.
Our results are consistent with previous research that showed a negative association between area-level SES and proximity, in terms of distance, to recreational facili-ties [46–48], green spaces [47, 49, 50], and playgrounds
[51, 52]. However, other studies have shown a greater proximity of green spaces for high SES areas, but not for other facilities [53–55]. This suggests that exercise facili-ties accessibility could act as a barrier of social disadvan-taged, as an “advantage in the disadvantaged [41, 56].
Our availability results are consistent with previous studies that demonstrated higher density of facilities in areas of higher SES [13, 14, 34, 57]. Other studies, devel-oped in different countries, found that there are more facilities in lower-SES areas [58, 59], while others have reported mixed or null results [60]. A previous study car-ried out in Madrid with older adults and secondary data sources showed similar availability of exercise facilities to those of our study. It concluded that reduced availability of exercise facilities in disadvantaged populations was a contributor to physical inactivity in older adults [36].
While the low SES areas had better accessibility and lower availability of exercise facilities, the higher SES areas presented opposite relationships. This could be explained by a high concentration of exercise facilities in the centre of Madrid, where census sections tended to have higher SES; on the other hand, the neighbourhoods
on the periphery of the city (lower SES, especially in the south) have a more dispersed distribution of exercise facilities.
Strengths and limitations
This is the first multilevel study that: (1) analysed exer-cise facilities, in terms of accessibility and availability, and examined this in relation to area-level disadvantage; and (2) classified and examined exercise facilities based on price, subscription type and ownership.
The results show the importance of doing research that incorporates both access and availability measures simul-taneously, and when combined with SES, can reveal dif-ferent (and sometimes opposite) social-spatial patterning and social gradients. Examining the different types of exercise facilities yielded diverse results when consid-ered by area-level SES, particularly in relation to generat-ing a better understandgenerat-ing of the (in)equities of delivery. Another strength was the use of primary data for exercise facilities and accessibility and availability measures in Madrid. Finally, using the whole municipality of Madrid provided a high level of population variation to examine the socio-spatial distribution of exercise facilities.
Some limitations of this study should be highlighted. This research did not take into account the impact of the acces-sibility and availability of exercise facilities with behaviours of the population, such as facility use or physical activity engagement. There have also been concerns that area-level SES measures may not be suitable proxies for individual-level SES because of potential disagreement between contextual and compositional effects [61]. Because of the absence of individual data, portals were used to estimate accessibility and availability of exercise facilities from the residences of the Madrid population; however, exercise facilities around workplaces and/or study centers, may also be important but were not investigated. Finally, our focus was exercise facilities, therefore, we might have missed other physical activity destinations, such as playgrounds or parks. However, we chose to restrict to study exercise facil-ities since the activfacil-ities supported in exercise facilfacil-ities (e.g. gyms) tend to be more structured and include moderate to vigorous intensities (MVPA) [24], which produces greater health benefits [25, 26].
Policy recommendations
Presence of exercise facilities have a great importance on the physical activity engagement of the populations. Not only for the type of the structured activities provided [24], but also for the impact on the neighbourhood envi-ronment [20].
In one hand, previous studies have pointed how the facility-rich environment encourage physical activ-ity through the visual stimuli provided by the own
facilities and the numerous role models presence thanks to the nearby facilities [20]. Secondly, is usual that people report inconvenience and travel problems as reasons for quitting of exercise programs [21]; to live near facilities reduce some psychological and physical barriers to exer-cise, such as travel time and traffic-related stress [20].
Previous studies have reported a positive relationship between the availability of exercise facilities and moderate to vigorous physical activity [62] and a negative relationship with adiposity [22]. Therefore, the low availability of exer-cise facilities detected in areas with low SES brings a dou-ble disadvantaged scenario for those populations, such as in the southern districts of Villaverde and Puente de Vallecas, as well as some areas in the southeast part of the city.
An increase of opportunities for physical activity in more disadvantaged areas, either through subsidy sys-tems of private facilities or increasing the availability of public facilities, could produce an upturn in the aggregate demand of physical activity. This planned growth should focus on low fixed price or no cost facilities, as those with a variable price (such as sessional) are negatively related to participation in physical activity [63], and may be a barrier for those who are disadvantaged people.
Research agenda
Future studies should try to extend our findings using individual-level behavioural data to better understand how exercise environment is associated with facility use and physical activity engagement. In future, a wider range of internal characteristics of the facilities should be assessed (e.g. service quality, cultural appropriate-ness, timetabling), alongside understanding how these attributes are associated with facility use. Also, a quali-tative approach to evaluate the characteristics of exercise facilities could improve our understanding of the barri-ers/enablers people face when selecting (or not) exercise facilities to attend, and whether this differs by SES.
Conclusions
Our findings showed that associations between accessi-bility and availaaccessi-bility of exercise facilities with area-level SES varied depending on facility type. Areas with lower SES demonstrated better accessibility in general to exer-cise facilities, whereas higher SES areas had greater facil-ity availabilfacil-ity, especially when privates and sessional types were considered.
Additional file
Additional file 1. Area Level Socioeconomic status indicators.
Abbreviations
SES: socio-economic status; MVPA: moderate to vigorous physical activity.
Acknowledgements
The authors would like to thank MAS Servicios Integrales for facilitating the access to their data on exercise facilities, and to the Heart Healthy Hoods team for the support. We also would like to thank to Prof. David Valadés PhD, for his advice and support during the development of the present study.
Authors’ contributions
LC, PG and MF conceived the idea. UB developed the area-level socioeco-nomic status index. JAS and LC collected and clean the database of exercise facilities. LC and PG carried out the statistical analysis. AC carried out the spatial analysis and the cartography. LC drafted the manuscript. All authors provided critical intellectual contributions. All authors read and approved the final manuscript.
Funding
This study forms part of the Heart Healthy Hoods, project funded by the European Research Council under the European Union’s Seventh Framework Programme (FP7/2007-2013/ERC Starting Grant Heart Healthy Hoods Agree-ment No. 336893). PG was supported by the 2018 Alfonso Martín Escudero Research Grant. HB is supported by an RMIT University Vice Chancellor’s Senior Research Fellowship and is the Australian Health Promotion Association Thinker in Residence. UB was supported by the Office of the Director of the National Institutes of Health under Award Number DP5OD26429.
Availability of data and materials
The data that support the findings of this study are available from MAS Ser-vicios Integrales but restrictions apply to the availability of these data, which were used under license for the current study, and so are not publicly avail-able. Data are however available from the authors upon reasonable request and with permission of MAS Servicios Integrales.
Ethics approval and consent to participate
We conducted this study in accordance with the Declaration of Helsinki, and received ethical approval by the Madrid Primary Care Research Committee. There were no human subjects involved in the study.
Consent for publication Not applicable.
Competing interests
The authors declare that they have no competing interests.
Author details
1 Social and Cardiovascular Epidemiology Research Group, School of Medicine
and Health Sciences, University of Alcalá, 28871 Alcalá de Henares, Madrid, Spain. 2 Management and Sports Training Research Group, School of Medicine
and Health Sciences, University of Alcalá, 28871 Alcalá de Henares, Madrid, Spain. 3 Centre for Urban Research, RMIT University, Melbourne, Australia. 4 Urban Health Collaborative, Drexel Dornsife School of Public Health,
Phila-delphia, PA, USA. 5 Department of Epidemiology, Johns Hopkins Bloomberg
School of Public Health, Baltimore, MD, USA.
Received: 25 March 2019 Accepted: 24 June 2019
References
1. Global status report on noncommunicable diseases 2014 [Internet].
Geneva: World Health Organization; 2014. https ://apps.who.int/iris/bitst
ream/handl e/10665 /14811 4/97892 41564 854_eng.pdf.
2. Chau JY, van der Ploeg HP, Merom D, Chey T, Bauman AE. Cross-sectional associations between occupational and leisure-time sitting, physical activity and obesity in working adults. Prev Med (Baltim). 2012;54:195– 200. https ://doi.org/10.1016/j.ypmed .2011.12.020.
3. Booth FW, Roberts CK, Laye MJ. Lack of exercise is a major cause of chronic diseases. Compr Physiol. 2012;2:1143–211.
4. Unick J, Lang W, Tate D, Bond D, Espeland M. Objective estimates of physi-cal activity and sedentary time among young adults. J Obes. 2017. https ://doi.org/10.1155/2017/92575 64.
5. Encuesta de hábitos deportivos en España [Internet]. Madrid: Consejo Superior de Deportes. Ministerio de Educación Cultura y Deporte. Gobi-erno de España; 2015. http://www.cultu rayde porte .gob.es/servi cios-al-ciuda dano/estad istic as/depor tes/encue sta-habit os-depor tivos -en-espan a.html.
6. Estudio de Salud de la ciudad de Madrid 2018 [Internet]. Madrid: Madrid Salud, Ayuntamientio de Madrid; 2019. http://madri dsalu d.es/wp-conte nt/uploa ds/2019/01/AVANC E-ESTUD IO-SALUD -21-ENERO -2019.pdf. 7. Rose G. Sick individuals and sick populations. Int J Epidemiol.
1985;14:32–8.
8. Franco M, Bilal U, Diez-Roux AV. Preventing non-communicable diseases through structural changes in urban environments. J Epidemiol Com-munity Health. 2014;69:509–11. https ://doi.org/10.1136/jech-2014-20386 5.
9. Bauman AE, Reis RS, Sallis JF, Wells JC, Loos RJF, Martin BW, et al. Physical activity 2 correlates of physical activity: why are some people physically active and others not? Lancet. 2012;380:258–71. https ://doi.org/10.1016/ S0140 -6736(12)60735 -1.
10. Wylie BJ, Singh MP, Coull BA, Quinn A, Yeboah- K, Sabin L, et al. Dispari-ties in physical activity resource availability in six US regions. Prev Med (Baltim). 2015;34:355–68.
11. Abercrombie LC, Sallis JF, Conway TL, Frank LD, Saelens BE, Chapman JE. Income and racial disparities in access to public parks and private recrea-tion facilities. Am J Prev Med. 2008;34:9–15.
12. Cohen DA, Lapham S, Evenson KR, Williamson S, Golinelli D, Ward P, et al. Use of neighbourhood parks: does socio-economic status matter? A four-city study. Public Health. 2013;127:325–32. https ://doi.org/10.1016/j. puhe.2013.01.003.
13. Estabrooks PA, Lee RE, Gyurcsik NC. Resources for physical activity participation: does availability and accessibility differ by neighborhood socioeconomic status? Ann Behav Med. 2003;25:100–4. https ://doi. org/10.1207/S1532 4796A BM250 2_05.
14. Powell LM, Slater S, Chaloupka FJ, Harper D. Availability of physical activ-ity-related facilities and neighborhood demographic and socioeconomic characteristics: a national study. Am J Public Health. 2006;96:1676–80. 15. Coombes E, Jones AP, Hillsdon M. The relationship of physical
activ-ity and overweight to objectively measured green space accessibilactiv-ity and use. Soc Sci Med. 2010;70:816–22. https ://doi.org/10.1016/j.socsc imed.2009.11.020.
16. Coutts C, Chapin T, Horner M, Taylor C. County-level effects of green space access on physical activity accessibility of green space. J Phys Act Health. 2013;10:232–40.
17. Gordon-Larsen P, Nelson MC, Page P, Popkin BM. Activity and obesity inequality in the built environment underlies key health disparities in physical inequality in the built environment underlies key health dispari-ties in physical activity and obesity. Pediatrics. 2006;117:417–24. https :// doi.org/10.1542/peds.2005-0058.
18. Hanibuchi T, Kawachi I, Nakaya T, Hirai H, Kondo K. Neighborhood built environment and physical activity of Japanese older adults: results from the Aichi Gerontological Evaluation Study (AGES). BMC Public Health. 2011;11:657. https ://doi.org/10.1186/1471-2458-11-657.
19. Van Cauwenberg J, Nathan A, Barnett A, Barnett DW, Cerin E, Council on Environment and Physical Activity (CEPA)-Older Adults Working Group. Relationships between neighbourhood physical environmental attrib-utes and older adults’ leisure-time physical activity: a systematic review and meta-analysis. Sport Med. 2018;48:1635–60. https ://doi.org/10.1007/ s4027 9-018-0917-1.
21. Andrew GM, Oldridge NB, Parker JO, Cunningham DA, Rechnitzer PA, Jones NL, et al. Reasons for dropout from exercise programs in post-coronary patients. Med Sci Sports Exerc. 1981;13:164–8.
22. Mason KE, Pearce N, Cummins S. Associations between fast food and physical activity environments and adiposity in mid-life: cross-sectional, observational evidence from UK Biobank. Lancet Public Health. 2018;3:e16–23. https ://doi.org/10.1016/S2468 -2667(17)30212 -8. 23. Hobbs M, Griffiths C, Green MA, Jordan H, Saunders J, McKenna J.
Asso-ciations between the combined physical activity environment, socioeco-nomic status, and obesity: a cross-sectional study. Perspect Public Health. 2018;138(3):169–72. https ://doi.org/10.1177/17579 13917 74835 3. 24. Ainsworth BE, Haskell WL, Whitt MC, Irwin ML, Swartz AM, Strath SJ, et al.
Compendium of physical activities: an update of activity codes and MET intensities. Med Sci Sport Exerc. 2000;32(Supplement):S498–516. https :// doi.org/10.1097/00005 768-20000 9001-00009 .
25. Blair SN, Cheng Y, Scott Holder J. Is physical activity or physical fitness more important in defining health benefits? Med Sci Sports Exerc. 2001;33(Supplement):S379–99. https ://doi.org/10.1097/00005 768-20010 6001-00007 .
26. Lear SA, Hu W, Rangarajan S, Gasevic D, Leong D, Iqbal R, et al. The effect of physical activity on mortality and cardiovascular disease in 130,000 people from 17 high-income, middle-income, and low-income countries: the PURE study. Lancet. 2017;390:2643–54. https ://doi.org/10.1016/S0140 -6736(17)31634 -3.
27. Caspersen CJ, Powell KECG. Physical activity, exercise and physical fitness: definitions and distinctions for health related research. Public Health Rep. 1985;100:126–31.
28. Beenackers MA, Kamphuis CBM, Giskes K, Brug J, Kunst AE, Burdorf A, et al. Socioeconomic inequalities in occupational, leisure-time, and transport related physical activity among European adults: a systematic review. Int J Behav Nutr Phys Act. 2012;9:116.
29. Foster S, Giles-Corti B. The built environment, neighborhood crime and constrained physical activity: an exploration of inconsistent findings. Prev Med (Baltim). 2008;47:241–51.
30. Ball K, Salmon J, Giles-corti B, Crawford D. How can socio-economic dif-ferences in physical activity among women be explained? A qualitative study. Women Health. 2006;43:93–113. https ://doi.org/10.1300/J013v 43n01 _06.
31. Rütten A, Abel T, Kannas L, Von Lengerke T, Lüschen G, Rodriguez Diaz JA, et al. Self reported physical activity, public health, and perceived environment: results from a comparative European study. J Epidemiol Community Health. 2001;55:139–46.
32. Humpreys B. Economic determinants of participation in physical activity and sport. Working Paper Series International Association of Sports Economists. 2006;4410, August: 06-13.
33. Ellaway A, Lamb KE, Ferguson NS, Ogilvie D. Associations between access to recreational physical activity facilities and body mass index in Scottish adults. BMC Public Health. 2016;16:1–9. https ://doi.org/10.1186/s1288 9-016-3444-8.
34. Hillsdon M, Panter J, Foster C, Jones A. Equitable access to exercise facili-ties. Am J Prev Med. 2007;32:506–8.
35. Penchansky R, Thomas JW. The concept of access definition and relation-ship to consumer satisfaction. Med Care. 2015;19:127–40.
36. Pascual C, Regidor E, Álvarez-del Arco D, Alejos B, Santos JM, Calle ME, et al. Sports facilities in Madrid explain the relationship between neigh-bourhood economic context and physical inactivity in older people, but not in younger adults: a case study. J Epidemiol Community Health. 2013;67:788–94. https ://doi.org/10.1136/jech-2013-20258 3.
37. Franco M. Heart Healthy Hoods Project: http://www.hhhpr oject .eu. Start-ing Grant 2013 European Research Council. 2013. http://www.hhhpr oject .eu.
38. INE. Estadísticas del padrón continuo 2014. Madrid, 2014. 2014. 39. Leal J, Sorando D. Economic crisis, social change and segregation
processes in Madrid. In: Tammaru T, Marcińczak S, van Ham M, Musterd S, editors. Socio-Economic Segregation in European Capital Cities. East meets West. London (UK): Routledge; 2015. p. 214–337.
40. Avanzando hacia la equidad. Propuesta de políticas e intervenciones para reducir las desigualdades sociales en salud en España [Internet]. Madrid: Ministerio de Sanidad Servicios Sociales e Igualdad. Gobierno de España; 2015, p. 17–23. https ://www.mscbs .gob.es/profe siona les/salud Publi ca/
prevP romoc ion/promo cion/desig ualda dSalu d/docs/Propu esta_Polit icas_Reduc ir_Desig ualda des.pdf
41. Gullon P, Bilal U, Cebrecos A, Badland HM, Galan I, Franco M. Intersection of neighborhood dynamics and socioeconomic status in small-area walk-ability: the Heart Healthy Hoods project. Int J Health Geogr. 2017;16:21.
https ://doi.org/10.1186/s1294 2-017-0095-7.
42. Instituto Geográfico Nacional. CARTOCIUDAD Project. 2014. http://www. carto ciuda d.es. Accessed 1 Sept 2017.
43. Koohsari MJ, Mavoa S, Villianueva K, Sugiyama T, Badland H, Kaczynski AT, et al. Public open space, physical activity, urban design and public health: concepts, methods and research agenda. Health Place. 2015;33:75–82.
https ://doi.org/10.1016/j.healt hplac e.2015.02.009.
44. Eriksson U, Arvidsson D, Sundquist K. Availability of exercise facilities and physical activity in 2,037 adults: cross-sectional results from the Swedish neighborhood and physical activity (SNAP) study. BMC Public Health. 2012;12:1. https ://doi.org/10.1186/1471-2458-12-607.
45. Kaufman TK, Rundle A, Neckerman KM, Sheehan DM, Lovasi GS, Hirsch JA. Neighborhood recreation facilities and facility membership are jointly associated with objectively measured physical activity. J Urban Health. 2019. https ://doi.org/10.1007/s1152 4-019-00357 -1.
46. Giles-Corti B, Donovan RJ. Socioeconomic status differences in recrea-tional physical activity levels and real and perceived access to a support-ive physical environment. Prev Med (Baltim). 2002;35:601–11.
47. Mavoa S, Koohsari MJ, Badland HM, Davern M, Feng X, Astell-Burt T, et al. Area-level disparities of public open space: a geographic informa-tion systems analysis in metropolitan melbourne. Urban Policy Res. 2015;33:306–23.
48. Pearce J, Witten K, Hiscock R, Blakely T. Are socially disadvantaged neighbourhoods deprived of health-related community resources? Int J Epidemiol. 2007;36:348–55.
49. Kessel A, Green J, Pinder R, Wilkinson P, Grundy C, Lachowycz K. Multi-disciplinary research in public health: a case study of research on access to green space. Public Health. 2009;123:32–8. https ://doi.org/10.1016/j. puhe.2008.08.005.
50. Hobbs M, Green MA, Griffiths C, Jordan H, Saunders J, Grimmer H, et al. Access and quality of parks and associations with obesity: a cross-sec-tional study. SSM Popul Health. 2017;3:722–9.
51. Smoyer-Tomic KE, Hewko JN, Hodgson MJ. Spatial accessibility and equity of playgrounds in Edmonton, Canada. Can Geogr. 2004;48:287–302. 52. Cradock AL, Kawachi I, Colditz GA, Hannon C, Melly SJ, Wiecha JL, et al.
Playground safety and access in Boston neighborhoods. Am J Prev Med. 2005;28:357–63.
53. Rigolon A, Flohr T. Access to parks for youth as an environmental justice issue: access inequalities and possible solutions. Buildings. 2014;4:69–94. 54. Harris CD, Paul P, Zhang X, Fulton JE. Park access among School-Age
Youth in the United States. J Phys Act Health. 2015;12(6 Suppl 1):S94–101. 55. Wen M, Zhang X, Harris CD, Holt JB, Croft JB. Spatial disparities in the
distribution of parks and green spaces in the USA. Ann Behav Med. 2013;45(Suppl. 1):2304–12.
56. King KE, Clarke PJ. A disadvantaged advantage in walkability: findings from socioeconomic and geographical analysis of national built environ-ment data in the United States. Am J Epidemiol. 2015;181:17–25. 57. Macintyre S. The social patterning of exercise behaviours: the role of
personal and local resources. Br J Sports Med. 2000;34:6. https ://doi. org/10.1136/bjsm.34.1.6.
58. Ogilvie D, Lamb KE, Ferguson NS, Ellaway A. Recreational physical activity facilities within walking and cycling distance: sociospatial pattern-ing of access in Scotland. Health Place. 2011;17:1015–22. https ://doi. org/10.1016/j.healt hplac e.2011.07.003.
59. Weyers S, Diehl K, Gruber J, D’Agostino A, Schneider S. Neighborhood deprivation and physical activity facilities—no support for the depriva-tion amplificadepriva-tion hypothesis. J Phys Act Health. 2014;12:990–7. 60. Jacobs J, Alston L, Needham C, Backholer K, Strugnell C, Allender S, et al.
Variation in the physical activity environment according to area-level socio-economic position—a systematic review. Obes Rev. 2018;2019:1– 15. https ://doi.org/10.1111/obr.12818 .
•fast, convenient online submission •
thorough peer review by experienced researchers in your field
• rapid publication on acceptance
• support for research data, including large and complex data types
•
gold Open Access which fosters wider collaboration and increased citations maximum visibility for your research: over 100M website views per year •
At BMC, research is always in progress.
Learn more biomedcentral.com/submissions
Ready to submit your research? Choose BMC and benefit from: 62. Wang L, Tang Y, Luo J. School and community physical activity
charac-teristics and moderate-to-vigorous physical activity among Chinese school-aged children: a multilevel path model analysis. J Sport Health Sci. 2017;6:416–22. https ://doi.org/10.1016/j.jshs.2017.09.001.
63. Anokye NK, Pokhrel S, Buxton M, Fox-Rushby J. The demand for sports and exercise: results from an illustrative survey. Eur J Health Econ. 2012;13:277–87.
Publisher’s Note