R E S E A R C H
Open Access
Is a change in mode of travel to school
associated with a change in overall physical
activity levels in children? Longitudinal results
from the SPEEDY study
Lee Smith
1,2, Shannon Sahlqvist
1,2, David Ogilvie
1,2, Andy Jones
3, Kirsten Corder
2, Simon J Griffin
1,2and Esther van Sluijs
1,2*Abstract
Background:Children who use active modes of travel (walking or cycling) to school are more physically active than those who use passive (motorised) modes. However, less is known on whether a change in mode of travel to school is associated with a change in children’s physical activity levels. The purpose of this analysis was to
investigate the association between change in mode of travel to school and change in overall physical activity levels in children.
Methods:Data from 812 9–10 year old British children (59% girls) who participated in the SPEEDY study were analysed. During the summer terms of 2007 and 2008 participants completed a questionnaire and wore an accelerometer for at least three days. Two-level multiple linear regression models were used to explore the association between change in usual mode of travel to school and change in objectively measured time spent in MVPA.
Results:Compared to children whose reported mode of travel did not change, a change from a passive to an active mode of travel was associated with an increase in daily minutes spent in MVPA (boys: beta 11.59, 95% CI 0.94 to 22.24; girls: beta 11.92, 95% CI 5.00 to 18.84). This increase represented 12% of boys’and 13% of girls’total daily time spent in MVPA at follow-up.
Conclusion:This analysis provides further evidence that promoting active travel to school may have a role in contributing to increasing physical activity levels in children.
Keywords:Transport, Active travel, Physical activity, School children
Background
Physical activity is known to be positively associated with overall health in children [1,2]. Active travel pro-vides an opportunity for children to incorporate physical activity into their daily lives and has been shown to be associated with health outcomes. For example, a system-atic review identified nine high quality studies of the as-sociation between walking and cycling (active travel) to
school and weight status or body composition in young people, of which 55% demonstrated a significant inverse association [3]. However, the proportion of UK children walking to school has decreased since 1995 and now stands at less than 50% [4].
Cross-sectional studies identified in systematic reviews suggest that young people who walk or cycle to school can accumulate between 5 and 37 additional minutes per day (min/day) of moderate-to-vigorous physical ac-tivity (MVPA) compared to those who use motorised (passive) modes of transport [5,6]. Associations between walking or cycling to school and physical activity have been shown to differ by sex, although the evidence is * Correspondence:[email protected]
1
MRC Epidemiology Unit, Institute of Metabolic Science, Addenbrooke’s Hospital, Box 285, Cambridge CB2 0QQ, UK
2
UKCRC Centre for Diet and Activity Research (CEDAR), Institute of Public Health, Forvie Site, Robinson Way, Cambridge CB2 0SR, UK
Full list of author information is available at the end of the article
inconsistent. For example, Rosenberg et al. found stron-ger associations in boys than in girls [7] whereas Cooper et al. found an association only in girls [8]. Using cross-sectional data from the Sport Physical Activity and Eat-ing Behaviour: Environmental Determinants in Young People (SPEEDY)study, Panter et al. found that girls and boys who walked to school spent an additional 6.9 min/ day and 3.3 min/day, respectively, in overall MVPA com-pared to those who used passive modes of transport. Girls and boys who cycled to school spent an additional 3.7 min/day and 6.5 min/day, respectively, in overall MVPA [9].
These findings suggest that active travel is associated with higher overall levels of physical activity [5,6]. How-ever, given their cross-sectional nature it is difficult to establish the direction of causality. More importantly from a public health perspective, it remains unclear whether changing from a passive to an active mode of travel is necessarily associated with an increase in overall physical activity. It is possible that children might com-pensate for a change to an active mode of travel with a decrease in other forms of physical activity (activity compensation) [10,11]. On the other hand, a previous study investigated the association between taking up cyc-ling to school and cardiorespiratory fitness over a six-year follow-up showed that taking up cycling to school was a significant predictor of increased cardiorespiratory fitness at follow-up [12]. One possible explanation is that taking up cycling to school may have increased partici-pants’ overall physical activity levels and thus cardiore-spiratory fitness. Alternatively participants who became more physically active in general between baseline and follow-up, and therefore improved their cardiorespira-tory fitness, may then have taken up cycling to school.
In order to assess the potential role of active travel for increasing population levels of physical activity, it is im-portant to investigate whether the above association can be found when using physical activity rather than fitness as an outcome. We therefore investigated the association between change in mode of travel to school and change in objectively measured physical activity over a one-year period in 9–10 year old British school children taking part in the SPEEDY study.
Methods
Full details of participant recruitment and study proce-dures are provided elsewhere [13,14]. In brief, the SPEEDY study is a prospective population-based cohort study examining factors associated with physical activity and dietary behaviour in pupils aged 9–10 years (at base-line) sampled through schools in the county of Norfolk, UK. A total of 157 schools were approached, of which 92 (59%) agreed to participate. All Year 5 (9–10 years old) pupils in these schools (n=3619) were invited and a
participation rate of 57% (n=2064) was achieved. Two waves of data collection were carried out during the summer terms (April to July) of 2007 and 2008. At base-line, both pupils and their parents were asked to complete separate questionnaires about the pupils’ diet-ary and physical activity behaviour. Pupils were also asked to complete an additional questionnaire at follow-up. At both time points pupils were asked to wear an Actigraph accelerometer (GTIM, Actigraph LCC, Pensa-cola, US) for seven consecutive days. Accelerometers were programmed to store activity data at five second intervals. Questionnaires and accelerometers were admi-nistered at the same point in time at baseline (by re-search staff directly) and at follow-up (by post) in an attempt to maximise coherence between measures. Written parental consent was obtained prior to data col-lection and ethical approval was granted by the Univer-sity of East Anglia research ethics committee.
Exposure measure
To assess travel behaviour, pupils answered the same question at both time points:‘How do you usually travel
to school?’ Children were asked to indicate the main
travel mode used: (a) car, (b) bus or train, (c) walk, or (d) bike (cycle). Use of the car, bus, or train was defined as ‘passive travel’and walking and cycling were defined as‘active travel’, consistent with other studies of the rela-tionship between travel mode and physical activity [7,8]. Depending on their responses to this question at both time points, pupils were categorised into one of four ex-posure categories: 1)‘consistent active travel’, 2) ‘consist-ent passive travel’, 3) ‘change from passive to active travel’and 4)‘change from active to passive travel’.
Outcome measures
time ≥500 min/day) of data were required at both base-line and follow-up. To be included in the total daily ana-lysis, three or more valid weekdays or weekend days of data were required at both baseline and follow-up. The choice of a three-day criterion reflected adequate reli-ability of the accelerometry measures across three or more valid wear days in this dataset (intraclass correl-ation coefficient = 0.78).
To assess whether change in mode of travel between baseline and follow-up was associated with change in physical activity, and to allow results to be expressed in a meaningful metric, the difference in the number of minutes spent in MVPA between baseline and follow-up was calculated for each participant for both weekday and total daily analysis. To account for any difference in ac-celerometer wear time between the two measurement periods, the change in time spent in MVPA was calcu-lated for every 1000 minutes of wear time as follows: (1-year follow-up MVPA x 1000/1-(1-year follow-up wear
time) – (baseline MVPA x 1000/baseline wear time).
The constant of 1000 was chosen as it is approximately equal to the highest observed daily accelerometer wear time in the dataset (1053 min) and corresponds to a rea-sonable maximum realistic daily wear time in this age group (~17 hours).
Covariates
At baseline pupils reported their sex and age, and their parent or main carer reported household car ownership and their own highest educational qualification (in cat-egories). Objective measures of urban/rural status and network distance from home to school (based on home postcode) were estimated using a Geographic Informa-tion System [16]. Trained research assistants measured pupils’ height and weight (whilst children wore light clothing) according to standard operating procedures from which body mass index (BMI) was calculated in kg/m2. These covariates were selected because they were hypothesised to be independently associated with both the exposure (change in travel behaviour) and the out-come (change in physical activity).
Analysis
Characteristics of the study population at baseline and follow-up were summarised using descriptive statistics. To assess whether change in mode of travel was asso-ciated with change in physical activity, two-level linear regression models were used with pupils at level 1 and school at level 2, to account for the clustering of out-comes amongst children within the same schools. The outcomes were change in average weekday time spent in MVPA and change in average total daily time spent in MVPA (computed as described above). The exposure was change in travel mode (categorised as described
above). Next, pre-specified covariates as well as baseline time spent in MVPA (min/day) were entered into the models as potential confounders. To account for the well documented sex differences in the association be-tween physical activity and active travel, [5,6] analyses were also stratified by sex.
Results
A total of 2064 pupils took part at baseline, of whom 55.1% were girls and 96.2% were white. Of the 1019 pupils who took part at follow-up, 954 returned an activ-ity monitor. 812 pupils were entered into the weekday analyses owing to incomplete or missing MVPA (n=96) or travel mode (n=46) data. The same 812 pupils were entered into total daily (weekdays plus weekend days) analyses. After excluding cases with missing data for po-tential confounders (predominantly parental education), final adjusted models included 772 pupils. There were no significant differences between the characteristics (sex, ethnicity, BMI, urban/rural status, parental educa-tion or baseline MVPA: all p>0.05) of pupils who partici-pated at baseline only (n=1244) and those included in the final adjusted models (n=772). 59% of pupils included in analyses were girls and 97% were white.
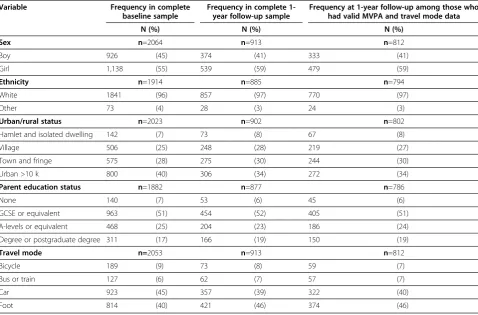
Table 1 shows participant demographics and frequency of travel mode at baseline and follow-up. At both time points, most pupils either walked or were driven to school. 40.6% (n=330) of pupils were categorised as reporting‘consistent passive travel’and 44.1% (n=358) as reporting ‘consistent active travel’. 6.1% of pupils (n=50) were categorised as having changed from an active to a passive mode of travel, and 9.2% (n=75) from a passive to an active mode.
Pupils who changed their usual mode of travel did not differ significantly from the total study sample in terms of sex, ethnicity or home location. Table 2 shows that pupils who changed to an active mode of travel and those who changed to a passive mode recorded a mean total daily increase and decrease respectively in minutes spent in MVPA. Table 3 shows similar findings for change in mean weekday minutes spent in MVPA.
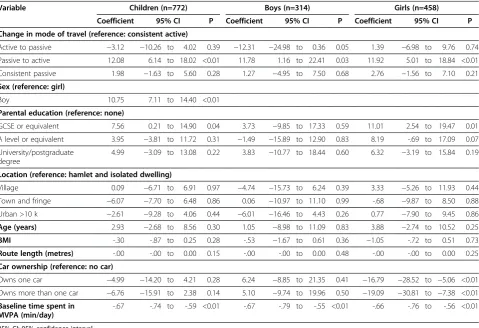
In two-level multiple linear regression analyses
(Tables 4 and 5), change to an active mode of travel was positively associated with an increase in weekday and total daily time spent in MVPA compared with the reference category of ‘consistent active travel’. This association remained after adjustment for potential confounders and was observed in boys and girls separ-ately, with the exception of weekday MVPA for boys for which no significant association was found. No sig-nificant associations were found for other change in travel mode groups.
participants were all in the ‘consistent active travel’ (n=18) or ‘consistent passive travel’ (n=16) groups. Ex-cluding these participants from the analyses made no substantive difference to the findings (results not shown).
Discussion
In this population-based longitudinal study of 9–10 year old children, boys and girls who changed to an active mode of travel increased their total daily MVPA by an average of 9 min and 6 min respectively. This represents
12% of boys’ and 13% of girls’ total daily time spent in MVPA at follow-up. The total daily MVPA of children who did not change their travel mode, or who changed to a passive mode, decreased over the same period. It should be noted however that boys and girls who chan-ged to an active mode spent less time in MVPA (6 min/ day and 22 min/day, respectively) at baseline than chil-dren in the other exposure categories and may therefore have had greater potential to increase their physical ac-tivity levels. However, models were adjusted for students’ baseline time spent in MVPA, to control for potential Table 1 Participant demographics and travel behaviour at baseline and follow-up
Variable Frequency in complete baseline sample
Frequency in complete 1-year follow-up sample
Frequency at 1-year follow-up among those who had valid MVPA and travel mode data
N (%) N (%) N (%)
Sex n=2064 n=913 n=812
Boy 926 (45) 374 (41) 333 (41)
Girl 1,138 (55) 539 (59) 479 (59)
Ethnicity n=1914 n=885 n=794
White 1841 (96) 857 (97) 770 (97)
Other 73 (4) 28 (3) 24 (3)
Urban/rural status n=2023 n=902 n=802
Hamlet and isolated dwelling 142 (7) 73 (8) 67 (8)
Village 506 (25) 248 (28) 219 (27)
Town and fringe 575 (28) 275 (30) 244 (30)
Urban >10 k 800 (40) 306 (34) 272 (34)
Parent education status n=1882 n=877 n=786
None 140 (7) 53 (6) 45 (6)
GCSE or equivalent 963 (51) 454 (52) 405 (51)
A-levels or equivalent 468 (25) 204 (23) 186 (24)
Degree or postgraduate degree 311 (17) 166 (19) 150 (19)
Travel mode n=2053 n=913 n=812
Bicycle 189 (9) 73 (8) 59 (7)
Bus or train 127 (6) 62 (7) 57 (7)
Car 923 (45) 357 (39) 322 (40)
Foot 814 (40) 421 (46) 374 (46)
Table 2 Unadjusted mean (SD) changes in total daily minutes spent in MVPA from baseline to follow-up
Change in mode of travel to school between baseline and one-year follow-up
Boys (n=332) Girls (n=480)
Total daily time spent in MVPA at baseline
Change in total daily time
spent in MVPAa Total daily time spent inMVPA at baseline Change in total daily timespent in MVPAa
Active to passive (n=50)
84 (22) −17 (81) 67 (14) −6 (22)
Passive to active (n=75)
78 (29) 9 (31) 45 (17) 6 (29)
Consistent active (n=358)
84 (23) −5 (27) 66 (26) −6 (25)
Consistent passive (n=330)
84 (24) −5 (31) 67 (20) −4 (26)
regression to the mean. The results presented here, al-though using a more proximal outcome, support previ-ous work by Cooper et al. who found that boys and girls who took up cycling to school during a 6-year period had better cardiorespiratory fitness than those who did not cycle to school at either baseline or follow-up [12].
For boys who changed to an active mode of travel, no significant association was observed with time spent in
MVPA on weekdays. However, a significant association was observed with daily time spent in MVPA over the entire week. These findings suggest that the observed as-sociation between active travel and overall physical
activ-ity may reflect the combined effect of the journeys
themselves, spontaneous play during the journeys and an encouragement of active behaviour in other areas of children’s lives [6]. It is also possible that increases in Table 3 Unadjusted mean (SD) changes in weekday minutes spent in MVPA from baseline to follow-up
Change in mode of travel to school between baseline and one-year follow-up
Boys (n=332) Girls (n=480)
Weekday time spent in MVPA at baseline
Change in weekday time
spent in MVPAa Weekday time spent inMVPA at baseline Change in total daily timespent in MVPAa
Active to passive (n=50)
82 (29) −12 (20) 68 (19) −4 (24)
Passive to active (n=75)
80 (24) 8 (28) 65 (16) 10 (28)
Consistent active (n=358)
82 (23) 1 (27) 66 (20) −3 (24)
Consistent passive (n=330)
83 (23) −1 (30) 66 (18) 0 (22)
n=812,atime spent in MVPA is expressed as (1-year follow-up MVPA x 1000/1-year follow-up wear time)–(baseline MVPA x 1000/baseline wear time).
Table 4 Associations between change in mode of travel to school and change in mean total daily minutes spent in MVPA
Variable Children (n=772) Boys (n=314) Girls (n=458)
Coefficient 95% CI P Coefficient 95% CI P Coefficient 95% CI P
Change in mode of travel (reference: consistent active)
Active to passive −3.12 −10.26 to 4.02 0.39 −12.31 −24.98 to 0.36 0.05 1.39 −6.98 to 9.76 0.74
Passive to active 12.08 6.14 to 18.02 <0.01 11.78 1.16 to 22.41 0.03 11.92 5.01 to 18.84 <0.01
Consistent passive 1.98 −1.63 to 5.60 0.28 1.27 −4.95 to 7.50 0.68 2.76 −1.56 to 7.10 0.21
Sex (reference: girl)
Boy 10.75 7.11 to 14.40 <0.01
Parental education (reference: none)
GCSE or equivalent 7.56 0.21 to 14.90 0.04 3.73 −9.85 to 17.33 0.59 11.01 2.54 to 19.47 0.01
A level or equivalent 3.95 −3.81 to 11.72 0.31 −1.49 −15.89 to 12.90 0.83 8.19 -.69 to 17.09 0.07
University/postgraduate degree
4.99 −3.09 to 13.08 0.22 3.83 −10.77 to 18.44 0.60 6.32 −3.19 to 15.84 0.19
Location (reference: hamlet and isolated dwelling)
Village 0.09 −6.71 to 6.91 0.97 −4.74 −15.73 to 6.24 0.39 3.33 −5.26 to 11.93 0.44
Town and fringe −6.07 −7.70 to 6.48 0.86 0.06 −10.97 to 11.10 0.99 -.68 −9.87 to 8.50 0.88
Urban >10 k −2.61 −9.28 to 4.06 0.44 −6.01 −16.46 to 4.43 0.26 0.77 −7.90 to 9.45 0.86
Age (years) 2.93 −2.68 to 8.56 0.30 1.05 −8.98 to 11.09 0.83 3.88 −2.74 to 10.52 0.25
BMI -.30 -.87 to 0.25 0.28 -.53 −1.67 to 0.61 0.36 −1.05 -.72 to 0.51 0.73
Route length (metres) -.00 -.00 to 0.00 0.15 -.00 -.00 to 0.00 0.48 -.00 -.00 to 0.00 0.25
Car ownership (reference: no car)
Owns one car −4.99 −14.20 to 4.21 0.28 6.24 −8.85 to 21.35 0.41 −16.79 −28.52 to −5.06 <0.01
Owns more than one car −6.76 −15.91 to 2.38 0.14 5.10 −9.74 to 19.96 0.50 −19.09 −30.81 to −7.38 <0.01
Baseline time spent in MVPA (min/day)
-.67 -.74 to -.59 <0.01 -.67 -.79 to -.55 <0.01 -.66 -.76 to -.56 <0.01
active travel may reflect a change in travel mode prefer-ence resulting from a more general increase in physical activity; in other words, children who become more ac-tive in general may then choose to travel to school by active means. Further analyses using multiple time points are needed to investigate these potential causal pathways.
Children who consistently used either an active or a passive mode of travel recorded decreases in MVPA over the one-year study period, as did children who changed from an active to a passive mode. This suggests that while taking up an active mode of travel may negate the downward trend in MVPA that is typically seen in this age group [14,17], continuing active travel is not suffi-cient to do so. The decline in MVPA seen among chil-dren who remained active travellers highlights a need for interventions that prevent a decline in physical activity in other areas of children’s lives, for example during and after school, as well as interventions to promote active travel.
In this study only 9.2% of pupils changed to an active mode of travel, while 40.6% consistently used passive
modes. In 2005, 43% of UK children were driven to school [4]. Interventions that promote active modes of travel to school therefore have the potential to increase the activity levels of large numbers of pupils, which may have important public health implications [1,18]. How-ever, a recent systematic review found that to date,
inter-ventions promoting active travel to school have
produced only small effects, suggesting a need for fur-ther research as to how best to achieve such behaviour change in practice [19].
Two-level regression models showed that parental
education — an indicator of socioeconomic status
(SES) — predicted changes in girls’ time spent in
MVPA but not boys’. Since boys participate in more
active play in their free time than girls [20], it is possible that parents encourage their daughters, or girls choose, to accumulate MVPA in other ways such as organised sports. The costs associated with participating in orga-nised sports (such as those of equipment and member-ship fees) might contribute to explaining why parental SES appears to be an important influence on girls’time spent in MVPA and not associated with boys’.
Table 5 Associations between change in mode of travel to school and change in mean weekday minutes spent in MVPA
Variable Children (n=772) Boys (n=314) Girls (n=458)
Coefficient 95% CI P Coefficient 95% CI P Coefficient 95% CI P
Change in mode of travel (reference: consistent active)
Active to passive −4.63 −12.19 to 2.92 0.23 −15.12 −28.52 to −1.72 0.02 1.08 −7.74 to 9.91 0.80
Passive to active 10.81 4.51 to 17.11 <0.01 7.66 −3.65 to 18.97 0.18 11.95 4.67 to 19.24 <0.01
Consistent passive 1.96 −1.87 to 5.79 0.31 0.28 −6.28 to 6.84 0.93 3.78 -.78 to 8.36 0.10
Sex (reference: girl)
Boy 4.99 1.12 to 8.86 0.01
Parental education (reference: none)
GCSE or equivalent 8.60 0.80 to 16.40 0.03 0.46 −14.20 to 15.13 0.95 13.85 4.91 to 22.79 <0.01
A level or equivalent 5.02 −3.20 to 13.26 0.23 −5.62 −21.11 to 9.86 0.47 11.91 2.53 to 21.29 0.01
University/postgraduate degree
7.40 −1.18 to 16.00 0.09 2.19 −13.58 to 17.98 0.78 10.51 0.47 to 20.56 0.04
Location (reference: hamlet and isolated dwelling)
Village −1.15 −8.48 to 6.16 0.75 −1.80 −13.85 to 10.24 0.76 0.94 −8.14 to 10.04 0.83
Town and fringe −1.27 −9.12 to 6.58 0.75 2.79 −9.59 to 15.18 0.65 −3.92 −13.75 to 5.89 0.43
Urban >10 k -.23 −7.37 to 6.90 0.94 -.47 −11.72 to 10.78 0.93 1.62 −7.55 to 10.81 0.72
Age (years) 1.24 −4.75 to 7.23 0.68 0.86 −9.80 to 11.53 0.87 0.64 −6.36 to 7.66 0.85
BMI -.36 -.96 to .22 0.22 -.17 −1.39 to 1.05 0.78 -.37 −1.02 to 0.27 0.26
Route length (metres) -.00 -.00 to .00 0.65 0.00 -.00 to 0.00 0.87 -.00 -.00 to 0.00 0.42
Car ownership (reference: no car)
Owns one car 1.60 −8.14 to 11.36 0.74 6.39 −9.73 to 22.53 0.43 −5.36 −17.75 to 7.02 0.39
Owns more than one car 0.12 −9.58 to 9.82 0.98 4.55 −11.37 to 20.49 0.57 −6.98 −19.36 to 5.39 0.26
Baseline time spent in MVPA (min/day)
-.27 -.35 to -.18 <0.01 -.27 -.39 to -.14 <0.01 -.26 -.37 to -.15 <0.01
Strengths and limitations
Strengths of this study include its prospective design, the use of objective measures of physical activity and that it was conducted in a large population-based sample of UK primary school children. The one year interval
separating baseline and follow-up data collection
ensured seasonally matched data, thereby reducing the risk of artefactual changes in either usual travel behav-iour or measured physical activity attributable to differ-ent weather conditions at the two time points. It also provided sufficient time to result in changes to children’s usual travel behaviour. However, despite the prospective design, it remains unclear whether children become more physically active and then changed to an active mode of travel, or vice versa. A longitudinal dataset in-cluding measurement at three or more time points or a controlled intervention study would be needed to an-swer this question with confidence.
Although the analysis sample comprised approxi-mately one-third of the pupils recruited at baseline, we found no significant differences between the characteris-tics (sex, BMI, urban rural/status, parental education or baseline MVPA) of pupils included in and excluded from the analysis. However, we have previously shown that in comparison to the Norfolk population a smaller propor-tion of obese children took part in the SPEEDY study, and that the demographic profile of the county of Nor-folk (with only 3.8% non-white children) is not represen-tative of the whole of the UK [13].
The measure of travel mode was relatively crude and did not allow multi-modal trips or the daily breakdown of travel behaviour to be ascertained. Moreover, to our knowledge there is no published validation of questions to ascertain ‘usual travel mode’ in children. However, similar measures have been used in previous studies examining the association between travel mode and physical activity in children [8,21]. Furthermore, an in-sufficient proportion (6%) of pupils used public transport at baseline to allow public transport to be treated as a separate category. Consequently, if we had disaggregated travel mode further into car, public transport, walking and cycling our statistical models would had been underpowered to detect associations. As in previous studies, public transport was therefore combined with passive travel [22]. Although travelling by public trans-port usually includes some walking, school bus services in the UK often pick up pupils close to their homes and it is therefore reasonable to assume that these journeys might have included relatively little active travel. In sup-port of this assumption, van Sluijs et al. found that UK children who walked to school had significantly higher average weekly accelerometer counts per minute and total minutes of MVPA than those classified as using the car or public transport to travel to school [23].
Moreover, removing pupils who used public transport from the current analyses made no substantive differ-ences to the findings (results not shown). Distance from home to school has consistently been found to be asso-ciated with mode of travel to and from school [24,25]. Although network distance was included as a covariate in analysis, it was not possible to stratify the analysis by this measure owing to small cell sizes.
Accelerometers as used in this study are calibrated to record ambulatory activity (hip movement) and there-fore underestimate the intensity of physical activity undertaken whilst cycling. In this study only 9% and 7% of pupils reported cycling to school at baseline and follow-up respectively, so the influence of this limitation of measurement is likely to be small. Criteria for classify-ing accelerometer non-wear time vary within the litera-ture [26,27]. For the present analysis 10 minutes of continuous zero counts were used to define non-wear. It appears reasonable to assume that 9–10 year old chil-dren are unlikely to remain sufficiently still to register no movement on an accelerometer for more than 10 minutes when awake, and this criterion has been applied in previous studies [26,28].
Conclusion
Taking up active travel to school is associated with increased levels of MVPA in primary school children. This study provides further evidence that promoting ac-tive travel to school may have a role in contributing to increasing physical activity levels in children.
Competing interest
The authors declare that there are no conflicts of interest.
Authors’contributions
A.J, K.C, S.J.G and E.S designed the SPEEDY study and coordinated its implementation. L.S conducted the statistical analyses and drafted the manuscript. A.J, K.C, S.J.G, E.S, D.O and S.S assisted in interpreting the statistical analyses and drafting the manuscript. All authors read and approved the final manuscript.
Acknowledgments
We thank the schools, pupils and parents for their participation in the SPEEDY study. We also thank everyone who helped with the data collection and Norfolk Children’s Services for their invaluable input and support. The SPEEDY study is funded by the National Prevention Research Initiative (http://www.npri.org.uk), consisting of the following Funding Partners: British Heart Foundation; Cancer Research UK; Department of Health; Diabetes UK; Economic and Social Research Council; Medical Research Council; Health and Social Care Research and Development Office for the Northern Ireland; Chief Scientist Office, Scottish Government Health Directorates; Welsh Assembly Government and World Cancer Research Fund.
expressed in this publication are those of the authors and not necessarily those of the Department of Health or other funders.
Author details
1MRC Epidemiology Unit, Institute of Metabolic Science, Addenbrooke’s
Hospital, Box 285, Cambridge CB2 0QQ, UK.2UKCRC Centre for Diet and Activity Research (CEDAR), Institute of Public Health, Forvie Site, Robinson Way, Cambridge CB2 0SR, UK.3School of Environmental Sciences, University of East Anglia, Norwich NR4 7JT, UK.
Received: 29 March 2012 Accepted: 9 November 2012 Published: 21 November 2012
References
1. Strong WB, Malina RM, Blimkie CJR, Daniels SR, Dishman RK, Gutin B, Hergenroeder AC, Must A, Nixon PA, Pivarnik JM,et al:Evidence based physical activity for school-age youth.J Pediatr2005,146:732–737. 2. Ortega FB, Ruiz JR, Castillo MJ, Sjostrom M:Physical fitness in childhood
and adolescence: a powerful marker of health.Int J Obes2008,32:1–11. 3. Lubans DR, Boreham CA, Kelly P, Foster CE:The relationship between
active travel to school and health-related fitness in children and adolescents: a systematic review.Int J Behav Nutr Phys Act2011,8:5. 4. Department for Transport:Transport Trends. London: TSO Publications; 2006. 5. Faulkner GE, Buliung RN, Flora PK, Fusco C:Active school transport,
physical activity levels and body weight of children and youth: a systematic review.Prev Med2009,48:3–8.
6. Lee MC, Orenstein MR, Richardson MJ:Systematic review of active commuting to school and childrens physical activity and weight.J Phys Act Health2008,5:930–949.
7. Rosenberg DE, Sallis JF, Conway TL, Cain KL, McKenzie TL:Active transportation to school over 2 years in relation to weight status and physical activity.Obesity (Silver Spring)2006,14:1771–1776.
8. Cooper AR, Wedderkopp N, Wang H, Andersen LB, Froberg K, Page AS:
Active travel to school and cardiovascular fitness in Danish children and adolescents.Med Sci Sports Exerc2006,38:1724–1731.
9. Panter J, Jones A, Van Sluijs E, Griffin S:The influence of distance to school on the associations between active commuting and physical activity.
Pediatr Exerc Sci2011,23:72–86.
10. van Sluijs E, McMinn A, Griffin S:Effectivness of interventions to promote physical activity in children and adolescents: systematic review of controlled trials.BMJ2007,335:703.
11. Fremeaux A, Mallam K, Metcalf B, Hosking J, Voss L, Wilkin T:The impact of school-time activity on total physical activity: the activitystat hypothesis.
Int J Obes2011,35:1277–1283.
12. Cooper AR, Wedderkopp N, Jago R, Kristensen PL, Moller NC, Froberg K, Page AS, Andersen LB:Longitudinal associations of cycling to school with adolescent fitness.Prev Med2008,47:324–328.
13. van Sluijs EM, Skidmore PM, Mwanza K, Jones AP, Callaghan AM, Ekelund U, Harrison F, Harvey I, Panter J, Wareham NJ,et al:Physical activity and dietary behaviour in a population-based sample of British 10-year old children: the SPEEDY study (Sport, Physical activity and Eating behaviour: environmental Determinants in Young people).BMC Public Health2008,8:388.
14. Corder K, van Sluijs EM, Ekelund U, Jones AP, Griffin SJ:Changes in children's physical activity over 12 months: longitudinal results from the SPEEDY study.Pediatrics2010,126:e926–e935.
15. Ekelund U, Sardinha LB, Anderssen SA, Harro M, Franks PW, Brage S, Cooper AR, Andersen LB, Riddoch C, Froberg K:Associations between objectively assessed physical activity and indicators of body fatness in 9- to 10-y-old European children: a population-based study from 4 distinct regions in Europe (the European Youth Heart Study).Am J Clin Nutr2004,
80:584–590.
16. Panter JR, Jones AP, Van Sluijs EM, Griffin SJ:Neighborhood, route, and school environments and children's active commuting.Am J Prev Med
2010,38:268–278.
17. Kimm SY, Glynn NW, Kriska AM, Barton BA, Kronsberg SS, Daniels SR, Crawford PB, Sabry ZI, Liu K:Decline in physical activity in black girls and white girls during adolescence.N Engl J Med2002,347:709–715. 18. Telama R, Yang X, Viikari J, Valimaki I, Wanne O, Raitakari O:Physical activity
from childhood to adulthood: a 21-year tracking study.Am J Prev Med
2005,28:267–273.
19. Chillon P, Evenson KR, Vaughn A, Ward DS:A systematic review of interventions for promoting active transportation to school.Int J Behav Nutr Phys Act2011,8:10.
20. Fox K, Riddoch C:Charting the physical activity patterns of contemporary children and adolescents.Proc Nutr Soc2000,59(4):497–504.
21. Cooper AR, Andersen LB, Wedderkopp N, Page AS, Froberg K:Physical activity levels of children who walk, cycle, or are driven to school.Am J Prev Med2005,29:179–184.
22. Smith L, Sahlqvist S, Ogilvie D, Jones A, Griffin S, van Sluijs E:Is active travel to non-school destinations associated with physical activity in primary school children?Prev Med2012,10:1016. j.ypmed.2012.01.006. 23. van Sluijs E, Fearne V, Mattocks C, Riddoch C, Griffin S, Ness A:The
contribution of active travel to children’s physical activity levels: cross-sectional results from the ALSPAC study.Prev Med2009,48:519–524. 24. Timperio A, Ball K, Salmon J, Roberts R, Giles-Corti B, Simmons D, Baur LA,
Crawford D:Personal, family, social, and environmental correlates of active commuting to school.Am J Prev Med2006,30:45–51. 25. Nelson NM, Foley E, O'Gorman DJ, Moyna NM, Woods CB:Active
commuting to school: How far is too far?Int J Behav Nutr Phys Act2008,
5:1.
26. Eiberg S, Hasslestrom H, Gronfeldt V, Froberg K, Svensson J, Andersen L:
Maximum oxygen uptake and objectivley measured physical activity in Danish children 6–7 years of age: The Copenhagen school child intervention study.Br J Sports Med2005,39:725–730.
27. Van Coervering P, Harnak K, Schmitz J, Fulton D, Galuska S:Feasibility of using accelerometers to measure physical activity in young adolescents.
Med Sci Sports Exerc2005,37:867–871.
28. Mattocks C, Ness A, Leary S, Tilling K, Blair S, Shield J, Deere K, Saunders J, Kirkby J, Smith G, Wells J, Wareham N, Reilly J, Riddoch C:Use of accelerometers in a large field-based study of children: protocols, design issues, and effects on precision.J Phys Act Health2008,1:S98–S111.
doi:10.1186/1479-5868-9-134
Cite this article as:Smithet al.:Is a change in mode of travel to school associated with a change in overall physical activity levels in children? Longitudinal results from the SPEEDY study.International Journal of Behavioral Nutrition and Physical Activity20129:134.
Submit your next manuscript to BioMed Central and take full advantage of:
• Convenient online submission
• Thorough peer review
• No space constraints or color figure charges
• Immediate publication on acceptance
• Inclusion in PubMed, CAS, Scopus and Google Scholar
• Research which is freely available for redistribution