RESEARCH ARTICLE
Developing a non-invasive tool to assess
the impact of oxidation on the structural
integrity of historic wool in Tudor tapestries
Nanette Kissi
1, Katherine Curran
1*, Constantina Vlachou‑Mogire
2, Tom Fearn
3and Lisa McCullough
4Abstract
Near infrared spectroscopy (NIR) can be a useful diagnostic tool in the assessment of quality in textile, agricultural and various other industries. In cultural heritage applications, NIR as a non‑invasive assessment tool is advantageous for understanding the composition or degradation of fragile historic objects that cannot be sampled. The direct interpretation of measured NIR spectra is complicated by overlapping bands produced from overtone and combi‑ nation bands of chemical bonds. However, in combination with multivariate partial least squares (PLS) models and principal component analysis, the physicochemical properties of historic materials can potentially be identified by calibrating against a measured component. In this research, wool fibres from a sacrificial collection of historic tap‑ estry fragments housed at Hampton Court Palace were analysed. The cystine oxidation products of historic wools which can be related to the embrittlement of fibres and ultimately fibre loss, were recorded using Fourier transform infrared (FTIR) spectroscopy. A PLS predictive model was then developed using previously measured NIR spectra for the same historic tapestry fragments to predict the ratios of the cystine oxidation species in historic wools measured in this research. The prediction of a validation set of historic tapestry fragments with known oxidation product ratios was found to be accurate to root mean squared errors of prediction (RMSEP) of 0.11 for cysteic acid/cystine dioxide, 0.03 for an oxidation ratio of cysteic acid/cystine monoxide and 0.06 for cystine dioxide/cystine monoxide. The model was applied successfully to an independent set of historic tapestry fragments with unknown oxidation ratios with an M‑distance pass limit of 3. The models were also applied to NIR measurements of historic tapestries on open display with limited success. Alternative methods to investigate and account for errors in this research are proposed. The potential for NIR to be used by conservators as a non‑invasive tool for the assessment of textiles, complementing cur‑ rent condition audit practices in use at heritage institutions is also discussed.
Keywords: Near infrared spectroscopy, Oxidation, Historic tapestries, Fourier transform infrared spectroscopy
© The Author(s) 2017. This article is distributed under the terms of the Creative Commons Attribution 4.0 International License (http://creativecommons.org/licenses/by/4.0/), which permits unrestricted use, distribution, and reproduction in any medium, provided you give appropriate credit to the original author(s) and the source, provide a link to the Creative Commons license, and indicate if changes were made. The Creative Commons Public Domain Dedication waiver (http://creativecommons.org/ publicdomain/zero/1.0/) applies to the data made available in this article, unless otherwise stated.
Background
The preservation of historic tapestries is essential for the longevity of future public engagement with these objects. These highly elaborate objects consist of organic animal protein fibres (silk and wool) and inorganic material (sil-ver or gold and sil(sil-ver gilt metal threads). During their construction, historic tapestries were often woven side-ways due to loom width restrictions. Consequently, they
are hung in the weft direction when on display rather than the warp direction, which is the structural frame on which the pictorial element is built. Wool fibres are a major structural and decorative component in tapestries and may arguably play a significant role in enabling the tapestries to bear their own weight.
Previous research
During their lifetime, historic tapestries have been exposed to various physical and environmental changes that pose a risk of damage to their fibres. Concerns for the mechanical stability of historic tapestries led to “the monitoring of damage to historic tapestries” (MODHT)
Open Access
*Correspondence: [email protected]
1 Institute for Sustainable Heritage, University College London, 14 Upper Woburn Place, London WC1H 0NN, UK
project through which the highly fragile nature of the tapestries became known [1, 2]. In this European-wide project, a variety of instrumental techniques including Fourier transform infrared spectroscopy attenuated total reflectance (FTIR-ATR), liquid chromatography mass spectrometry (LC/MS) and tensile measurements were used to analyse dyed and unaged model fibres, historic, and artificially light degraded and thermally aged mate-rials [2–4]. The results of this research identified several chemical markers of degradation for materials in historic tapestries. These markers included the presence of cys-tine oxidation products in historic and artificially light aged wool fibres [3].
Chemical stability and the oxidation of historic wool fibres A key feature of the chemical structure of wool keratin proteins is their high cystine content. These amino acids with disulfide cross-links are important for the structural integrity of the fibres [5, 6]. Weaker hydrogen bonds and salt bridges between COO− and NH3+ ions also
influ-ence the structural properties of wool. In the assessment of wool degradation, the integrity of protein backbone and crosslinks are the “main chemical entities of interest” as noted by Weatherall [7]. For this reason, the cystine breakdown products formed from scission of disulfide bonds warrant study for historic tapestries and were investigated in this research. The intramolecular and intermolecular disulfide network is a significant compo-nent of the wool keratin cellular substructure [8]. The arrangement of cells within the wool substructure essen-tially define the physical properties of the fibre, providing resistance to chemical attack.
The mechanism for the process of disulfide oxidation in wool keratins is uncertain. One proposed pathway [9,
10] is thought to proceed as described in Fig. 1 with light being one known cause of oxidation, although other envi-ronmental risks may contribute. In terms of quantitative detection, lower concentration intermediate products like cystine dioxide (CD) and cystine monoxide (CM) are diminished over time as they are converted to other products [11]. Cysteic acid (CA), a more stable oxidation product is easily identified and has been used as a marker for physicochemical change in historic and model tapes-tries in the past [3, 12].
Through FTIR, SO and SO2 peaks related to wool oxi-dation breakdown products (such as CM, CD and CA) can easily be identified. Other peaks relevant to the oxi-dation process such as the peaks relating to the disulfide (450–550 cm−1), thiol (2500–2600 cm−1) or sulfur car-bon groups (590–700 cm−1) can appear as very weak bands that may be masked by background noise [13, 14]. Rather such groups are often identified through Raman spectroscopy [15–18], where such bands are typically
stronger than in FTIR and NIR. Though useful in follow-ing chemical changes that occur in wool proteins [19–
22], FTIR-ATR is ultimately destructive, requiring sacrificial samples that are not always accessible in his-toric collections. For hishis-toric tapestries, it is not possible to take samples from the front of the tapestry. In the MODHT project this sampling issue was addressed by removing fibres from the back of the tapestries. Behind the tapestry the microclimate may differ from that expe-rienced on the surface of the tapestries. Fibres at the back of the tapestries are also better protected from the effects of exposure to light. In FTIR-ATR analysis sample com-pression is necessary and may cause further physical damage to already vulnerable objects. Diffuse reflectance infrared spectroscopy (DRIFTS) can be used for a non-invasive approach, however the rough and uneven sur-face of fibres in tapestries may produce erroneous results and spectra that are difficult to interpret [23]. In previous unpublished research by McCullough1, DRIFTS was
una-ble to produce spectra containing useful chemical infor-mation for historic tapestry fragments at Hampton Court Palace.
Following the MODHT project, other studies have investigated the strain experienced by tapestries as well as the chemical degradation pathways leading to the loss of fibre strength. Through finite element analysis, con-centrated areas of stress were pinpointed within the slits in the tapestry weave structure (in Ph.D. research by Duf-fus2 unpublished). Digital image correlation is another
method that has been used to non-invasively monitor strain deformation in tapestries while on display [26, 27]. The development of a science based strategy for the con-servation protection of the 16th century tapestries in the GH and GWC at Hampton Court Palace led to the estab-lishment of an ongoing long-term environmental moni-toring campaign known as the “Tudor tapestry environmental protection project”.3 A large number of
1 See Ref. [24]. 2 See Ref. [25]. 3 See Ref. [28].
sensors were deployed in front of the tapestries, where the data collected revealed the distribution of the envi-ronmental risks (relative humidity, temperature, light and dust) on these large objects. The strain experienced by the tapestries because of these environmental changes has stimulated another area of this investigation, as well as the development of a non-invasive tool for the in situ condition assessment of the tapestries.
Since the late 20th century conservation practices for tapestries have evolved from reweaving and restoration to a minimally invasive approach [29, 30]. To evaluate the state of historic tapestries and other historic tex-tiles, condition is commonly described using a visual set of criteria that relies on the conservator’s expertise [31]. Observations are of cumulative damage that has already occurred to the material to the point that fibre strength and image detail of areas may already be compromised. It is therefore difficult to anticipate damage since structural and fibre loss has already occurred and the uncertainty on how best to prioritise the treatment of these objects remains [32].
Through non-invasive quantitative assessments, there is the potential to address the need for objective and semi-quantitative condition assessments of his-toric tapestries by predicting areas that are susceptible to physical and chemical damage. As a technique NIR is non-invasive, portable and easy to use but must be calibrated against reference data. Multivariate analysis is then needed to extract information from both the NIR spectra and measured reference data. On its own NIR, can be difficult to interpret because of the overlapping overtones and combination bands that dominate in the near infrared region. These overlapping bands make it difficult to extract quantitative information from spec-tra due to the overlap of specspec-tral features in this region (700–2500 nm) compared to the intense absorptions observed from fundamental vibrations in the mid infra-red region (2500–25,000 nm) used in FTIR [33]. The condition and physicochemical properties of materials gained through NIR and multivariate analysis has been widely researched in agriculture, the textile industry, as well as in cultural heritage for historic silk and cellulosic materials [34–39]. NIR has also been used to determine material quality as seen in the development of partial least squares (PLS) regression models for alpaca wool [40]. As NIR provides an in situ non-invasive approach to understanding the mechanical or chemical prop-erties of a material, NIR was used in a recent study by McCullough to assess the physical damage that occurs to historic tapestries and was based on tensile reference data measured for yarns removed from a collection of historic tapestry fragments housed at Hampton Court Palace (unpublished).
Research aims
The aim of this research was a continuation of the pre-viously mentioned work, focusing on the development of a non-invasive tool to measure chemical damage spe-cifically the oxidation of historic wool yarns. Degradation can be caused by light, though there are other factors that contribute to the oxidation of wool such as temperature, dyes and mordants. The oxidation products formed as a result of cystine scission can result in further fibre degra-dation through acidic hydrolysis and autocatalytic break-down processes [6, 41]. Through the examination of the cystine breakdown products and peak intensity changes, the extent of protein degradation can be inferred [20–
22]. The NIR measurements had already been recorded for the historic tapestry weft yarns in McCullough’s work and are relevant for this research as they were used to calibrate the PLS models against the oxidation prod-ucts measured in this study. New NIR spectra were then recorded in an on-site non-invasive application to pre-dict the oxidation products of the tapestries on display in the great watching chamber (GWC) and great hall (GH). On-site NIR measurements could be useful in predict-ing the chemical changes that occur and manifest as fibre strength loss. The knowledge of chemical properties such as the presence of oxidation products may then assist conservators in prioritising areas for treatment using NIR as non-invasive diagnostic instrument complementing existing audit practices.
Experimental Sampling strategy
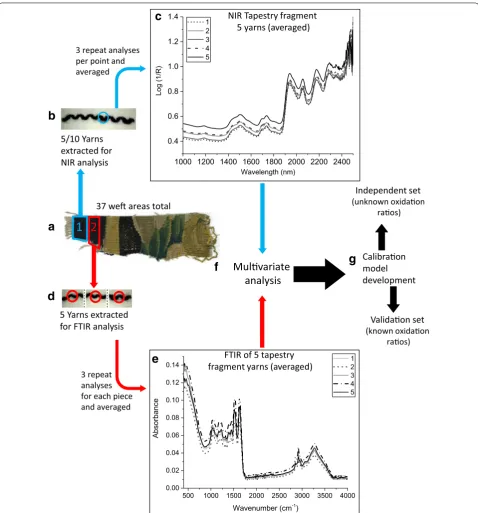
With permission from Historic Royal Palaces, wool fibres from a sacrificial collection of historic tapestry fragments housed within the scientific laboratory at Hampton Court Palace were analysed (Fig. 2). As the conservation of his-toric tapestries at Hampton Court Palace has been in
practice for over 100 years, these tapestry fragments are most likely the remnants of past interventive treatments where weak areas were removed and rewoven. The col-lection of these tapestry fragments constitutes a valuable source of sacrificial samples, presenting similar manu-facturing and ageing characteristics to the historic tapes-tries on display at Hampton Court Palace. These yarns were dyed different colours during original manufacture although the dyes were not identified. Like the tapestries on display, the historic tapestry fragments yarns will have experienced varying levels of light exposure, temperature and RH differences and other environmental parameters. These tapestry fragments were the same sample sets used to develop the previously mentioned NIR model. Where possible yarns were unravelled from the same weft areas adjacent to where they had been removed previously (Fig. 3a).
Weft yarns were unravelled and removed from the weave structure prior to FTIR measurements to reduce the likelihood of spectra being recorded for the under-lying warp fibres especially where weft threads had significant material loss. The reproducibility of con-ducting FTIR measurements on removed historic yarns was assessed in a pilot study for replicate measure-ments (unpublished results). Five unravelled yarns were removed per weft area in a tapestry fragment with 37 different weft areas of varying condition analysed and 190 unravelled yarns removed in total for FTIR analysis (Fig. 3a, d, e). The yarns were then prepared by cutting to approximately 0.5 mm in length. Each piece of yarn was analysed separately and the spectra for all pieces from one yarn were averaged.
FTIR‑ATR method
FTIR spectra was collected for 180 yarn fibres from his-toric tapestry fragments that were dyed a range of col-ours during original manufacture, for 5 model undyed and unaged wool tapestry yarns and 5 undyed artificially light degraded tapestry yarns (aged at 600 h of 150,000 lx in a Xenotest light aging chamber) from the MODHT project. FTIR-ATR was used to measure the peak inten-sities of the functional groups related to cystine oxida-tion products (see Fig. 3a, d, e). Spectra were recorded using a Bruker Alpha FTIR spectrometer (Ettlingen, Germany) with an ATR Platinum Diamond single reflec-tion module. Sixty-four scans were collected with a 4 cm−1 resolution over the range of 4000–375 cm−1. Results were processed using Opus software (version 7). The spectra were averaged and normalised by divid-ing by the amide III absorption band resultdivid-ing from C–N stretching and N–H bending vibrations at 1232 cm−1 following procedures used in other research [3, 10, 42,
43].
Multivariate analysis
1000 1200 1400 1600 1800 2000 2200 2400 0.4
0.6 0.8 1.0 1.2 1.4
)
R/
1(
go
L
Wavelength (nm) 1
2 3 4 5
a
500 1000 1500 2000 2500 3000 3500 4000
0.00 0.02 0.04 0.06 0.08 0.10 0.12 0.14
ec
na
br
os
b
A
Wavenumber (cm-1)
1 2 3 4 5 NIR Tapestry fragment
5 yarns (averaged)
Calibraon model development
5 Yarns extracted for FTIR analysis
2
1
3 repeat analyses per point and averaged
5/10 Yarns extracted for NIR analysis
Mulvariate
analysis
37 we areas total
FTIR of 5 tapestry fragment yarns (averaged) 3 repeat
analyses for each piece and averaged
f
e
d
c
b
g
Validaon set (known oxidaon
raos) Independent set (unknown oxidaon
raos)
model was later validated using an independent test set of historic fragment yarn samples that had not been used for calibration with known oxidation ratios calculated from the results of FTIR spectra. The R2 of prediction was then calculated for each model from the independent set. The confidence in the model prediction of the valida-tion set was expressed as the root mean squared error of prediction (RMSEP). Grams IQ predict software (version 9.1) was later used to validate and predict separate set of
historic tapestry fragment yarns with unknown oxida-tion product ratios. The software was also used to predict the unknown oxidation ratios of the on-site analysis at Hampton Court Palace on tapestries within the GH and GWC.
On‑site NIR procedure
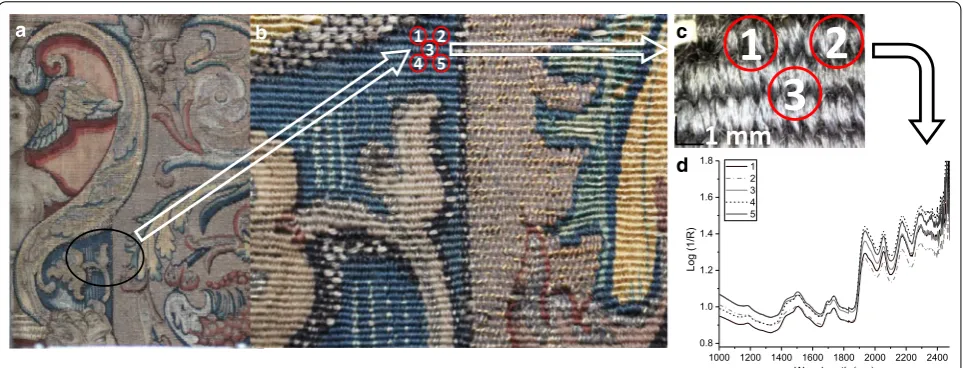
Measurements were recorded using a Labspec 5000 spectrometer (ASD, Colorado, United States) equipped with a fibre optic probe (3 mm diameter) and a spec-tralon white reflectance standard. NIR spectra were collected over 100 scans (10 nm resolution) over a wave-length range of 1000–2500 nm to include the region used in protein determination [50] at around 2168– 2180 nm (Fig. 4). The visible range was excluded as peaks in this region may be linked to mainly colour properties from the dyes present in the historic yarns rather than molecular changes related to fibre strength properties. A review of the literature did not reveal cystine peaks that could be used directly and while S–H groups have been reported as presenting weak overtone bands [51] in the near infrared (at around 1970–1980 nm), tertiary amides, OH groups and other functional groups can also absorb in this spectral region [52]. For each sampling area, 5 points were measured with 3 repeat measure-ments averaged at each point (Fig. 5). The results were processed using Indico Pro Spectral Acquisition Soft-ware. The NIR measurements of the historic tapestry fragments analysed in the previous unpublished report, were performed using the same method and were subse-quently used in this study to calibrate PLS models inves-tigated in this research.
1000 1200 1400 1600 1800 2000 2200 2400 0.2
0.4 0.6 0.8 1.0 1.2
)
R/
1(
go
L
Wavelength (nm)
N-H bend 2ndovertone
+ C=O stretch/N-H in plane bending/ C-N stretch combinaon bands
N-H stretch 1stovertone
Bound water
Fig. 4 NIR spectrum of a historic wool yarn. The peak observed at 2180 nm is used to indicate the presence of proteins as it relates to different functional groups that reside along the protein backbone. Note the step circled around 1820–1840 nm where the detector changes to accommodate longer wavelengths
1 3
5 4
2
1
3
2
a b c
d
1000 1200 1400 1600 1800 2000 2200 2400 0.8
1.0 1.2 1.4 1.6 1.8
)
R/
1(
go
L
Wavelength (nm) 1
2 3 4 5
1 mm
Fig. 5 a NIR sampling area from “the meeting of Abraham and Melchizedek” in the GH. b The sampling points within the area are numbered 1–5.
The 16th century tapestries on display at Hampton Court Palace within the GH are thought to originate from the same artisan workshop and contain wool, silk and metal threads. Conversely the tapestries within the GWC contain no metal threads. Sampling areas were provided from microscopy and digital images taken during a previ-ously conducted dust microscopy survey that took place at the locations of environmental monitors within the GH and GWC. NIR spectra were collected at the lower (0.4 m height) and middle levels (1.2 m height) at a spac-ing interval of approximately 2 m. Measurements were taken from tapestries along the north and south walls in the GH and GWC (see Table 1). Additional measure-ments were taken along the east and west wall in the GWC. More measurements were recorded in the GWC because these tapestries were thought to have more vari-ability in the material composition as they are older than the GH tapestries. Areas with varying condition were selected based on the dust microscopy survey and the modified criteria mentioned from the previous work.
Results and discussion
Comparison of peak intensities for unaged, light aged and historic wool
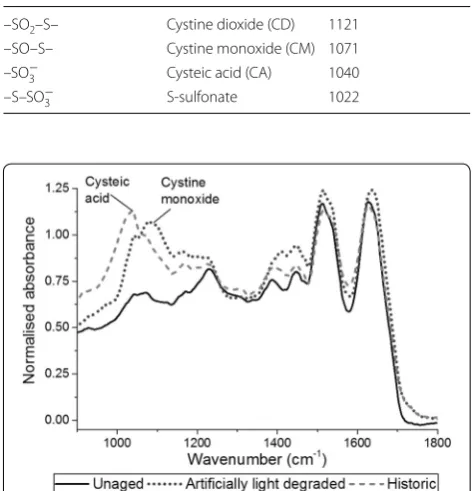
The key peaks in FTIR spectra related to the oxidation products of interest can be seen in Table 2. There is a relationship between oxidation products and photo-age-ing which can be observed when comparphoto-age-ing the spec-tra for an artificially light aged yarn and historic yarn to an unaged wool yarn (Fig. 6). The FTIR spectra for an unaged and undyed yarn sample had lower peak inten-sities for what appears to be a mixture of CM and CA components. The artificially light aged sample displays a higher intensity peak for what may represent a mixture of CM and CA or the conversion of the monoxide into
the acid. When compared to the historic fibre removed from a sample area in poor condition, this peak is mainly dominated by the presence of CA indicating full conver-sion towards this product and a more progressed state of oxidation [12].
Table 1 Locations and description of analysed tapestries within the GWC and GH (courtesy of Historic Royal Palaces)
Room Location Code Tapestry Date Dimensions (m)
Great hall North wall N1 The departure of Abraham c.1541–43 4.82 × 7.80
N2 The separation of Abraham and Lot c.1541–43 4.88 × 7.92
N3 The meeting of Abraham and Melchizedek c.1541–43 4.78 × 7.90
South wall S1 The sacrifice of Isaac c.1541–43 4.83 × 7.93
S2 The oath and departure of Eliezar c.1541–43 4.88 × 8.54
S3 Eliezar and Rebekah at the well c.1541–43 4.77 × 7.77
Great watching chamber North wall N1 Romance c.1515 3.95 × 7.56
East wall E1 Triumph of fame over death (triumph) c.1515 4.08 × 8.10
E2 The virtues challenge the vices as Christ begins his ministry (Anglesey) c.1515 4.08 × 4.29
South wall S1 Justice disarmed by mercy (music) c.1515 3.92 × 5.70
West wall W2 The death of Hercules (Hercules) c.1515 3.915 × 5.28
W3 Aeneas departing from Carthage (Aeneas) c.1525 3.45 × 3.90
Table 2 Typical peak absorption frequencies associated with cystine oxidation products [3, 10]
Chemical functional
group Chemical names Wavenumber (cm
−1)
–SO2–S– Cystine dioxide (CD) 1121
–SO–S– Cystine monoxide (CM) 1071
–SO−
3 Cysteic acid (CA) 1040
–S–SO−
3 S‑sulfonate 1022
NIR model development
Using the NIR spectra collected from historic tapes-try fragments as part of McCullough’s previous unpub-lished study, a model was developed to test whether NIR spectroscopy could be used as a non-destructive tool to predict the ratios of FTIR peaks relevant to oxida-tion products such as CA, CD, CM. As stated, although FTIR in DRIFTS mode can be used as a non-destructive technique on historic objects, previous work has shown that it is not possible to obtain usable FTIR spectra from tapestry samples using DRIFTS. When using FTIR-ATR, it is necessary to remove yarns for analysis to be able to identify the relevant peaks. FTIR-ATR analysis can thus be considered a “destructive” technique in this context, with NIR acting as a surrogate technique to predict the outcomes of FTIR-ATR analysis non-destructively. The developed model was validated using a separate training set of spectra, before being trialled on-site at Hampton Court Palace.
PCA spectral outliers of NIR measurements
PCA was conducted on the NIR spectral data from the previous study. This analysis was necessary to identify possible outliers from spectra that would be introduced into the training set when creating PLS calibration mod-els. The PCA for the NIR data identified fibres from arti-ficially aged, 28.2, 99.1, and 106.1 weft areas as outlier data points that did not cluster with the rest of the group in the PCA score plots (Additional file 1). These points were then considered as potential samples to be removed from the data set during PLS cross validation experi-ments. The identification of the artificially aged sample as an outlier may be explained by the FTIR results, since the artificially aged samples are potentially at an earlier stage of oxidation than yarns from the historic tapestry frag-ments. This result also supports the findings from the MODHT project where model samples though artificially aged, were much stronger chemically and physically than the historic tapestries on display (Hacke4 [53]
unpublished).
Calibration model development
The optimal parameters for the calibration model can be found in Table 3. The models with the lowest correlation were found for the CA/CM ratio. As the monoxide is an unstable intermediate product that is often difficult to detect, it is possible that the intensities were too low or too varied to produce meaningful results. The best cali-bration models from the leave-one-out cross validation experiments were found for the CD/CM and CA/CD
4 See Ref. [53].
ratios which both had calculated R2 values of measured vs predicted results above 0.6 (Table 3). These results were comparable to the previous work where similar R2 values were reported. A R2 value of 0.6 is inadequate in the case of quantitative applications where high corre-lations are necessary (i.e. in agriculture and drug appli-cations). These correlations though not excellent, are useful as they help interpret the variability observed in the results for the historic wool fragments. An R2 of 0.69 CA/CD may be potentially acceptable given the complex-ity of analysing highly variable historic samples, while the remaining correlations for the CA/CM and CD/CM ratios are mainly promising for future experiments with enlarged datasets. To test whether the R2 values were the result of random correlations, a series of permuta-tion tests were performed for each oxidapermuta-tion ratio and repeated 3 times for each ratio. The results of the permu-tation tests were significantly lower than the original R2 values, confirming that the correlations were not coinci-dental (Additional file 2). The usefulness of the R2 values is discussed further in the validation of the calibration models. The mahalanobis distance (M-distance) [54, 55] measures the distance of outlier points from the mean of the group samples, according to a scale derived from the variability in the training set. This method was found to be unsuccessful in identifying outliers in cross-validation experiments as none of the samples were identified as outliers except for the model unaged and light aged sam-ples. The M-distance limit is set to 3 which means that samples within the training set that lie outside 3 standard deviations from the group mean, will be classified as sep-arate from the group. Instead the model was optimized by removing spectral and concentration residual outliers using an F-ratio probability that samples differed from the training set by a probability of 99%.
Validation of the calibration models
been exposed to an open environment with temperature and humidity fluctuations while on open display over the last century. These fluctuations are in addition to vari-ous other environmental risks that have contributed to their fibre weakening and material loss over 5 centuries. The ageing of these historic objects is therefore signifi-cantly more complex and cumulative compared to what is simulated in artificial light ageing conditions. The arti-ficially light aged samples are arguably more comparable to the historic fragments than the unaged samples due to the oxidation experienced through artificial ageing, however this oxidative degradation had not progressed to the extent that the historic fragments had degraded (Fig. 6). In fact, during the CA/CD cross-validation experiments (a potentially more progressed state of oxi-dation) the artificially light aged fibre samples occasion-ally appeared as outliers. This difference correlates with results from the MODHT where artificially aged model samples (dyed and undyed) remained stronger and in better condition than their historic counterparts. In this research, the undyed unaged and undyed artificially light aged fibre samples are less useful to the models needed to assess historic fibres susceptible to further damage. Both the undyed unaged and undyed light aged samples ignore other parameters that play a role in the degrada-tion of the exposed wool fibres in the historic tapestries on open display (such as the original dyes, their dete-rioration and subsequent impact on the degradation of
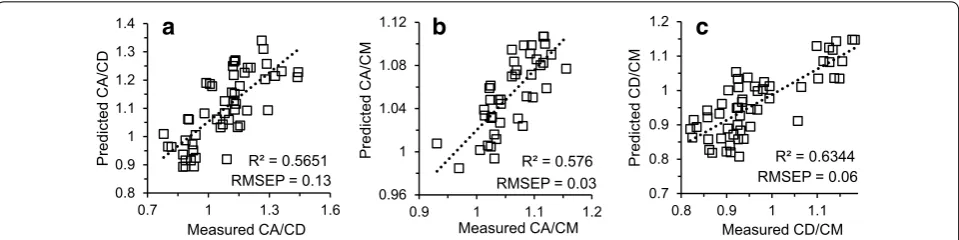
wool). Therefore, these model undyed samples which have stronger properties even when some oxidation has taken place for the light aged model samples, are a less useful benchmark and are less representative than the historic fragments for the historic tapestries. However, these unaged and light aged model samples do provide useful insight into how the oxidative degradation process progresses in historic wools. Upon removal of the unaged sample from the validation set, the R2 of prediction was improved. On comparison of the measured vs predicted results for the validation set, all the R2 values for the oxi-dation ratios were close to 0.6 (Fig. 7). The CD/CM ratio produced the best correlation (R2 = 0.63) and calculated RMSEP (no units) of 0.06 followed by CA/CD (R2 0.57 of and RMSEP 0.11) and CA/CM (R2 = 0.58 and RMSEP 0.03). The results from the PLS models, though not excel-lent are promising as they assist in interpreting the varia-bility observed in the NIR and FTIR results of the historic fragments. With the introduction of larger data sets there is the potential to improve future results. A value of 0.6 may be considered a sufficient correlation as it explains at least 60% of the variance for complex non-homogeneous historic materials. For this research, higher R2 values are not necessarily the goal. It is assumed that there are many factors that influence the degradation pathways for his-toric wools that are over 500 years old and the damage they have experience is the result of cumulative effects. Wool fibres themselves can differ chemically by: the age,
Table 3 Optimal parameters determined for Gap 1st derivative cross validation experiments
Product ratio Spectral region
(nm) Pathlength correction (1st derivative) SECV Factors R
2 PRESS Number of outliers (spec‑ tral, residual outliers with F test uncertainty 99%)
CA/CD 1400–1820
1840–2300 SNV‑detrend 0.09 7 0.69 1.21 4
CA/CM 1300–1820
1840–2300 SNV‑detrend 0.03 4 0.50 0.11 19
CD/CM 1400–1820
1840–2300 MSC 0.07 6 0.66 0.72 5
R² = 0.5651 0.8
0.9 1 1.1 1.2 1.3 1.4
0.7 1 1.3 1.6
D
C/
A
C
det
ci
der
P
Measured CA/CD
RMSEP = 0.13 R² = 0.576
0.96 1 1.04 1.08 1.12
0.9 1 1.1 1.2
Predicted
CA/C
M
Measured CA/CM RMSEP = 0.03
a
b
c
R² = 0.6344
0.7 0.8 0.9 1 1.1 1.2
0.8 0.9 1 1.1
Predicted
CD/C
M
Measured CD/CM RMSEP = 0.06
location, breed of sheep [56] and the resultant macro-structure of wool, by the presence of dyes and dye dete-rioration over time due to exposure to environmental risks which may increase the rate of oxidation of the wool fibres further. Higher R2 values would be more suitable for more quantitative analyses in areas that require a high degree of correlation, e.g. in agricultural or pharmaceu-tical applications. However, since we are dealing with complex non-homogeneous materials with varying states of degradation there is a more semi-quantitative element of the research. Therefore, an indication of areas that are more oxidised and potentially more susceptible to fibre loss or damage compared to less oxidised areas is likely more useful to conservators. This information could be then used as a screening tool to target and examine these areas that at risk of damage and prioritise treatment of these areas.
An independent set of historic fragments not intro-duced to the calibration model with unknown oxidation products was predicted in GRAMS IQ predict software. The software determines the efficacy of the prediction using a threshold based on M-distance pass/fail limits. Where values were above 3, samples were flagged as out-liers and deemed a “fail”. At values between 1–2, sam-ples were described as “possible” or marginal and below 1 a “pass” or acceptable. Of the 50 independent samples tested, 2 samples failed the limit test. 22 samples resulted in a “possible” match with M-distances between 1–2 and total were tested and 26 passed the threshold limit below an M-distance of 1. This pass criteria gives confidence that the model can be used on independent sets of sam-ples of historic wool fragments.
On‑site trial of the predictive model
On-site analysis of the historic tapestries at Hampton Court Palace took place, to trial the developed model in a real heritage setting. NIR spectroscopic analysis of the tapestries was performed and then assessed in rela-tion to the spectra used to develop the model. Unfortu-nately, the on-site measurements did not meet the pass criteria of an M-distance of 3, meaning that predictions of oxidation products, although possible, were not per-formed as confidence in them would have been low. The prediction of unknowns also proved to be difficult when the previous specific stress model was applied to these areas. This prediction points to a discrepancy between the developed model and the on-site results. One pos-sible reason for this difference may be explained by the scale of the oxidation product ratios seen in Fig. 7. The ratios varied over small ranges (0.9–1.2 for CD/CM) and in some cases had a relatively high error (RMSEP 0.11 CD/CM). This error could translate into a larger error in the on-site trial measurements as indicated by the much
higher M-distances that ranged between approximately 4–20. Other reasons for the discrepancy in results may relate to soiling differences between the tapestries on display within the GH and GWC and the laboratory his-toric pieces. There may have been errors in the measure-ment as the probe was held perpendicular to a vertical surface that was not flush against the wall, compared to the samples used for the model which were analysed on a laboratory bench. The environment may have played a detrimental role as measurements were conducted during the summer and due to its hygroscopic proper-ties, the wool fibres will adsorb moisture from the sur-rounding air as the humidity increases. Environmental data from the surface of the tapestries was missing as the monitors had been removed prior to the surface clean-ing of the tapestries. However, ambient data for the GWC revealed minimum and maximum RH levels of 48 and 65% RH respectively over 1 week with an average of 58% RH. These RH levels were higher in comparison to 39–51% RH when the previous laboratory NIR meas-urements were conducted. Though it is not possible to control the environment, by excluding the region where bound water appears (1940 nm) it may be possible to improve results. This research also highlights an issue with using previously conducted NIR results to calibrate the predictive model as instrumental deterioration may have played a significant role in the discrepancy between predicted and measured results. Another important fac-tor that may have played a role can be found in the optics of the spectrometer which are known to degrade over time and after regular use [57]. Since the measurements in this research were recorded 2 years since the previous model measurements, some wear on the instrument dur-ing this time may have contributed to the error observed. To avoid this issue, the instrument should be calibrated against samples with known FTIR data prior to use on-site by conservators to account for such discrepancies.
It is possible that the M-distance limit of 3 is unrealistic for this series of experiments. In the on-site trial reported here, M-distance values were well above 3. In some dis-crimination methods, M-distance limits of 10–15 for maximum variance have been reported for classifying samples but threshold values vary according to the type of sample and application [44]. Raising the M-distance limit should therefore be done with some caution. This research therefore demonstrates the complexity of trans-lating a model developed in the laboratory to a real herit-age setting. Consistency between the analysis procedure used for both model development and on-site work is paramount, including sample preparation, environmental conditions and instrument performance.
quantities of oxidative damage to an area within a tapes-try, as both spatial and spectral information is collected using a mapping method for the distribution of chemi-cal damage within tapestry areas [58]. To investigate the possible link between fibre strength loss and oxidation a combination of both FTIR and FT-Raman spectros-copy (FTR) could be used. FTR is often used to assess the loss of disulfide functionality in studies of hair and wool [12, 15, 16, 20] since sulfur itself is not NIR active [59]. In combination with the oxidation products meas-ured through FTIR, it may be possible to understand the effects of oxidation on fibre strength more closely.
Conclusion
In this research, FTIR was used to examine the cystine oxidation products in wool yarns removed from historic tapestry fragments housed at Hampton Court Palace compared to undyed unaged wool and undyed artifi-cially light aged undyed wool yarns. The level of oxida-tion of artificially aged wool was found to be lower than that of historic wools, supporting previous research car-ried out as part of the MODHT that the historic yarns were significantly more fragile than the artificially aged model samples. This research has demonstrated that it is possible to observe the progression of oxidation that historic wools in historic tapestries experience, poten-tially highlighting areas more susceptible to fibre strength and material loss. In this work, a conservative calibra-tion model was developed using previously measured NIR spectra of historic tapestry fragments and the oxi-dation products of the same historic tapestry fragments measured in this research. Ratios were predicted for a validation set of historic tapestry fragments with known oxidation product ratios accurate to RMSEP of 0.11 for cysteic acid/cystine dioxide, 0.03 for an oxidation ratio of cysteic acid/cystine monoxide and 0.06 for cystine diox-ide/cystine monoxide. Within a laboratory context it was demonstrated that it is possible to predict the unknown oxidation ratios of historic fragments using previous NIR results as demonstrated with an M-distance pass limit of 3, however this prediction does not yet translate to real on-site applications within a heritage context. While there is a known relationship between light induced oxi-dation and the formation of cystine breakdown products, historic wool yarns in tapestries are non-homogeneous materials having undergone cumulative damage due to exposure to various environmental risks. This oxida-tion process may have been influenced by the original chemicals treatments to fibres through dyeing and early conservation methods used to treat the tapestries. These risks may have both accelerated the formation of oxida-tion products and may have produced chemical break-down products other than those caused by light. For
this reason, there are likely other additional factors that influence the relationship between chemical degradation products and strength.
The number of different weft areas and subsequently yarns used to calibrate the model should be reviewed as more measurements may be necessary to better represent the tapestries on display. The issue of representativeness becomes amplified when using a predictive model to pre-dict unknown areas that have undergone chemical dam-age in an on-site heritdam-age application. To improve NIR spectral data collection, the instrument should be recali-brated with the same samples before use if possible. Near infrared hyperspectral imaging may also help to improve the relationship between the predicted quantities of oxi-dative damage to an area within a historic tapestry, as it allows for both spatial and spectral information to be collected. The environment may play a role in the dis-crepancy between model and on-site measurements par-ticularly if there was a difference in the moisture content of the fibres. For further research, wavelengths at which moisture plays a role could be excluded during develop-ment of the model. It may also be useful to investigate the use of FT-Raman in addition to FTIR spectroscopy as the oxidation products may then be related to the disap-pearance of the disulfide band which cannot be observed NIR. If calibration of the model is carried out prior to in situ measurement, there is the potential to use NIR as a quantitative non-invasive tool to complement audits used by conservators to quantitatively assess the condi-tion of historic tapestries and other heritage textiles. The addition of the data used to measure the chemical break-down processes that manifest as a loss of fibre strength and predict such losses may assist in prioritising textile for treatment.
Authors’ contributions
NK, KC and CV developed the concept of this work. CV provided the samples for the research and participated with NK in the set up for the on‑site meas‑ urements. NK conducted sample preparation and measurements. NK, KC and TF participated in the development and interpretation of the models. LM provided the previous NIR data from which the model was developed and advised on the development of the model. NK wrote the manuscript KC, TF and CV edited parts of the manuscript. All authors read and approved the final manuscript.
Additional files
Additional file 1. Principal component analysis score and loading plots of the first 5 principal components from NIR data of undyed unaged wool, undyed light aged wool (600 h, 150,000 lx) and historic fragment wool yarns. Outlier points have been highlighted in red.
Author details
1 Institute for Sustainable Heritage, University College London, 14 Upper Woburn Place, London WC1H 0NN, UK. 2 Conservation and Collections Care, Historic Royal Palaces, Hampton Court Palace, Surrey KT8 9AU, UK. 3 Department of Statistical Science, University College London, Gower Street, London WC1E 6BT, UK. 4 National Trust, 20 Grosvenor Gardens, Belgravia, London SW1W 0DH, UK.
Acknowledgements
This collaborative research project was conducted within the frame of the MRes SEAHA programme at UCL and the Historic Royal Palaces Heritage Sci‑ ence Scholarship scheme of which financial support is gratefully acknowl‑ edged. Thanks are extended to Matija Strlič and Josep Grau‑Bové for their help and advice on this research. Many thanks to Eveliina Ojanne, Ian Gibb and the tapestry conservators at Hampton Court Palace for their help and insight to the research.
Competing interests
The authors declare that they have no competing interests.
Ethics approval and consent to participate Not applicable.
Publisher’s Note
Springer Nature remains neutral with regard to jurisdictional claims in pub‑ lished maps and institutional affiliations.
Received: 23 March 2017 Accepted: 11 November 2017
References
1. Band J. The survival of Henry VIII’s History of Abraham tapestries: an account of how they were perceived, used and treated over the cen‑ turies. In: Lennard F, Hayward M, editors. Tapestry Conserv Princ Pract. Oxford: Butterworth‑Heinemann; 2006. p. 20–7.
2. Quye A, Hallett K, Herrero Carretero C. “Wroughte in gold and silk”: preserving the art of historic tapestries. Edinburgh: National Museums Scotland; 2009.
3. Odlyha M. Studies on woolen threads from historical tapestries. AUTEX Res J. 2007;7:9–18.
4. Odlyha M, Wang Q, Foster MG, de Groot J, Horton M, Bozec L. Ther‑ mal analysis of model and historic tapestries. J Therm Anal Calorim. 2005;82:627–36.
5. Feughelman M. Mechanical properties and structure of alpha‑keratin fibres: wool, human hair, and related fibres. Sydney: UNSW Press; 1997. 6. Tímár‑Balázsy Á. Chemical principles of textile conservation. Oxford:
Butterworth‑Heinemann; 1998.
7. Weatherall IL. The aging of wool fibers. In: Cardamone JM, Baker MT, editors. Hist Text Pap Polym Mus. Washington, DC: American Chemical Society; 2000. p. 115–26. https://doi.org/10.1021/bk‑2001‑0779.ch009. 8. Marshall RC, Orwin DFG, Gillespie JM. Structure and biochemistry of
mammalian hard keratin. Electron Microsc Rev. 1991;4:47–83. 9. Douthwaite FJ, Lewis DM, Schumacher‑Hamedat U. Reaction of cystine
residues in wool with peroxy compounds. Text Res J. 1993;63:177–83. 10. Kan CW, Chan K, Yuen CWM. Surface characterization of low temperature
plasma treated wool fiber. Fibers Polym. 2004;5:52–8.
11. Carr CM, Lewis DM. An FTIR spectroscopic study of the photodegradation and thermal degradation of wool. J Soc Dye Colour. 1993;109:21–4. 12. Jones DC, Carr CM, Cooke WD, Lewis DM. Investigating the photo‑
oxidation of wool using FT‑Raman and FT‑IR spectroscopies. Text Res J. 1998;68:739–48.
13. Stuart BH. Organic molecules. In: Infrared Spectrosc Fundam Appl. Lon‑ don: Wiley; 2004. p. 71–93. https://doi.org/10.1002/0470011149.ch4. 14. Stuart BH, Ando DJ. Spectrum interpretation: sulfur compounds. In: Biol
Appl Infrared Spectrosc. London: Wiley; 1997. p. 68–9. https://books. google.co.uk/books?id=EX‑Sy7dvA_EC.
15. Doherty B, Miliani C, Berghe IV, Sgamellotti A, Brunetti BG. Micro‑Raman spectroscopic study of artificially aged natural and dyed wool. J Raman Spectrosc. 2008;39:638–45.
16. Pande CM. FT‑Raman spectroscopy—applications in hair research. J Soc Cosmet Chem. 1994;45:257–68.
17. Kuzuhara A, Hori T. Analysis of heterogeneous reaction between reducing agents and keratin fibers using Raman spectroscopy and microspectro‑ photometry. J Mol Struct. 2013;1037:85–92.
18. Carter EA, Fredericks PM, Church JS, Denning RJ. FT‑Raman spectroscopy of wool—I. Preliminary studies. Spectrochim Acta Part Mol Spectrosc. 1994;50:1927–36.
19. Ji Y, Chen J, Lv J, Li Z, Xing L, Ding S. Extraction of keratin with ionic liquids from poultry feather. Sep Purif Technol. 2014;132:577–83.
20. Wojciechowska E, Włochowicz A, Wesełucha‑Birczyńska A. Application of Fourier‑transform infrared and Raman spectroscopy to study degradation of the wool fiber keratin. J Mol Struct. 1999;511–512:307–18.
21. Wojciechowska E, Włochowicz A, Wysocki M, Pielesz A, Wesełucha‑ Birczyńska A. The application of Fourier‑transform infrared (FTIR) and Raman spectroscopy (FTR) to the evaluation of structural changes in wool fibre keratin after deuterium exchange and modification by the orthosilicic acid. J Mol Struct. 2002;614:355–63.
22. Wojciechowska E, Rom M, Włochowicz A, Wysocki M, Wesełucha‑ Birczyńska A. The use of Fourier transform‑infrared (FTIR) and Raman spectroscopy (FTR) for the investigation of structural changes in wool fibre keratin after enzymatic treatment. J Mol Struct. 2004;704:315–21. 23. Smith MJ, Thompson K, Hermens E. Breaking down banners: analytical
approaches to determining the materials of painted banners. Heritage Sci. 2016;4:1–19.
24. McCullough L. A non‑destructive method for assessing the degradation of wool yarns within historic tapestries while in situ. London: UCL; 2014. 25. Duffus P. Manufacture, analysis and conservation strategies for historic
tapestries. Oxford: University of Manchester; 2013.
26. Khennouf D, Dulieu‑Barton JM, Chambers AR, Lennard FJ, Eastop DD. Assessing the feasibility of monitoring strain in historical tapestries using digital image correlation. Strain. 2010;46:19–32.
27. Lennard F, Dulieu‑Barton JM. Quantifying and visualizing change: strain monitoring of tapestries with digital image correlation. Stud Conserv. 2014;59:241–55.
28. Frame K, Vlachou‑Mogire C, Hallett K, Takami M. Balancing significance and maintaining ‘sense of place’ in the sustainable display of Tudor tapes‑ tries in the Great Hall, Hampton Court Palace. In: The 2018 International Institute for Conservation Turin Congress. (2017) (submitted). 29. Lennard F. Preserving image and structure: tapestry conservation in
Europe and the United States. Stud Conserv. 2006;51:43–53. 30. Finch K. Tapestries: conservation and original design. In: Conserv Tap‑
estries Embroideries Proc Meet Inst R Patrim Artist. Los Angeles: Getty Conservation Institute; 1989. p. 67–74.
31. Lennard F. The art of tapestry conservation. In: Hayward M, Lennard F, edi‑ tors. Tapestry Conserv Princ Pract. Oxford: Butterworth‑Heinemann; 2006. p. 3–12.
32. Cardamone JM. Historic textiles and paper. In: Hist Text Pap Polym Mus. Washington, DC: American Chemical Society; 2001. p. 2–7.
33. Weyer L, Workman J Jr. Introduction to near‑infrared spectra. In: Pract Guide Interpret Infrared Spectrosc. Boca Raton: CRC Press; 2007. p. 1–22. https://doi.org/10.1201/9781420018318.ch1.
34. Garside P, Wyeth P, Zhang X. Use of near IR spectroscopy and chemo‑ metrics to assess the tensile strength of historic silk. E‑Preserv Sci. 2011;8:68–73.
35. Luxford N. Reducing the risk of open display: optimising the preventive conservation of historic silks. Southampton: University of Southampton; 2009.
36. Kim J, Wyeth P. Towards a routine methodology for assessing the condi‑ tion of historic silk. E‑Preserv Sci. 2009;6:60–7.
37. Trafela T, Strlič M, Kolar J, Lichtblau DA, Anders M, Mencigar DP, et al. Non‑ destructive analysis and dating of historical paper based on IR spectros‑ copy and chemometric data evaluation. Anal Chem. 2007;79:6319–23. 38. Lichtblau D, Strlič M, Trafela T, Kolar J, Anders M. Determination of
39. Saeys W, Mouazen AM, Ramon H. Potential for onsite and online analysis of pig manure using visible and near infrared reflectance spectroscopy. Biosyst Eng. 2005;91:393–402.
40. Gishen M, Cozzolino D. Feasibility study on the potential of visible and near infrared reflectance spectroscopy to measure alpaca fibre character‑ istics. Anim Int J Anim Biosci. 2007;1:899–904.
41. Millington KR. 9—improving the whiteness and photostability of wool. In: Adv Wool Technol. Cambridge: Woodhead Publishing; 2009. p. 217–47. 42. Coderch L, Pons R, Erra P. A Fourier transform infra‑red spectroscopic
study of wool subjected to permonosulphuric acid treatments. J Soc Dye Colour. 1991;107:410–4.
43. Signori V, Lewis DM. FTIR investigation of the damage produced on human hair by weathering and bleaching processes: implementation of different sampling techniques and data processing. Int J Cosmet Sci. 1997;19:1–13.
44. Workman J, Springsteen A. Applied spectroscopy: a compact reference for practitioners. London: Elsevier Science; 1998. https://books.google. co.uk/books?id=OzAnX25h4soC.
45. Brereton RG. Experimental design. In: Appl Chemom Sci. London: Wiley; 2007. p. 9–62. https://doi.org/10.1002/9780470057780.ch2.
46. Weyer L, Workman J. Amino acids, peptides, and proteins. In: Pract Guide Interpret Infrared Spectrosc. Boca Raton: CRC Press; 2007. p. 93–6. https:// doi.org/10.1201/9781420018318.ch11.
47. Weyer L, Workman J. Amines and amides. In: Pract Guide Interpret Infrared Spectrosc. Boca Raton: CRC Press; 2007. p. 77–86. https://doi. org/10.1201/9781420018318.ch8.
48. Geladi P, MacDougall D, Martens H. Linearization and scatter‑correc‑ tion for near‑infrared reflectance spectra of meat. Appl Spectrosc. 1985;39:491–500.
49. Barnes RJ, Dhanoa MS, Lister SJ. Standard normal variate transformation and de‑trending of near‑infrared diffuse reflectance spectra. Appl Spec‑ trosc. 1989;43:772–7.
50. Workman Jr. J. 15—interpretive spectroscopy for near‑infrared. In: Handb Org Compd. Burlington: Academic Press; 2001. p. 143–82.
51. Weyer L, Workman J. P‑H and S‑H Pract Guide Interpret Infra‑ red Spectrosc. Boca Raton: CRC Press; 2007. p. 87–8. https://doi. org/10.1201/9781420018318.ch9.
52. Weyer L, Workman J. NIR absorption band charts ? An overview. In: Pract Guide Interpret Infrared Spectrosc. Boca Raton: CRC Press; 2007. p. 113–5. https://doi.org/10.1201/9781420018318.ax1.
53. Hacke A‑M. Investigation into the nature and ageing of tapestry materi‑ als. Manchester: University of Manchester; 2006.
54. Duckworth J. Spectroscopic qualitative analysis A2—workman, Jerry. In: Springsteen AW, editor. Appl Spectrosc. San Diego: Academic Press; 1998. p. 165–90.
55. Sharif MH, Djeraba C. A simple method for eccentric event espial using mahalanobis metric. In: Bayro‑Corrochano E, Eklundh J‑O, editors. Prog Pattern Recognit Image Anal Comput Vis Appl 14th Iberoam Conf Pattern Recognit CIARP 2009 Guadalaj Jalisco Mex Novemb 15–18 2009 Proc. Berlin: Springer; 2009. p. 417–24. https://doi. org/10.1007/978‑3‑642‑10268‑4_48.
56. Johnson NAG, Russell I. Advances in wool technology. London: Elsevier Science; 2008. https://books.google.co.uk/books?id=qQykAgAAQBAJ. 57. Pasquini C. Near infrared spectroscopy: fundamentals, practical aspects
and analytical applications. J Braz Chem Soc. 2003;14:198–219. 58. Manley M. Near‑infrared spectroscopy and hyperspectral imag‑
ing: non‑destructive analysis of biological materials. Chem Soc Rev. 2014;43:8200–14.
![Fig. 1 Proposed oxidation breakdown pathway for wool keratin drawn in ChemDraw (version 15.1) [9, 10]](https://thumb-us.123doks.com/thumbv2/123dok_us/846805.2079198/2.595.307.539.89.177/proposed-oxidation-breakdown-pathway-keratin-drawn-chemdraw-version.webp)