Published by Science and Education Publishing DOI:10.12691/ajrd-8-1-4
Climate Change and Farmer’s Perception for the
Sustainability of Farming in Khyber
Pakhtunkhwa-Pakistan
Muhammad Israr1,*, Muhammad Faraz2, Nafees Ahmad3
1
Department of Rural Development, The University of Agriculture, Peshawar Pakistan
2
AMKC Mardan, The University of Agriculture, Peshawar Pakistan
3
Department Name, Department of Economics, University of Malakand, Pakistan *Corresponding author: misrar@aup.edu.pk
Received April 22, 2020; Revised May 24, 2020; Accepted May 31, 2020
Abstract
This research was conducted in Swabi district of Khyber Pakhtunkhwa with the aims to study the knowledge of farmers and to evaluate the perceptions of the farmers about Climate Change (CC). To accomplish these objectives primary data was collected from 98 randomly selected farmers by structure questionnaire through face to face interview method and was analysed by using descriptive statistics. Findings revealed that majority (93%) of farmers were aware of CC phenomena and perceived changes in temperature (89%) and precipitation (86%) during the last decade. Crop diversification, soil and water management practices and application of necessary farm inputs were the farmer’s preferred adaptive strategies to CC. Barriers to adaptive strategies were the ineffective government support, lack of capital, information and extension services, traditional beliefs and high cost of farm inputs. The study concludes that climate is changing and the farmers are practicing different adaptive strategies to overcome this problem, but still there is a space for more scientifically verified strategies which can boost the farmer’s productivity and increased the overall wellbeing for the future sustainability of farming.Keywords
: climate, farming status and farmers perceptionsCite This Article:
Muhammad Israr, Muhammad Faraz, and Nafees Ahmad, “Climate Change and Farmer’s Perception for the Sustainability of Farming in Khyber Pakhtunkhwa-Pakistan.” American Journal of Rural Development, vol. 8, no. 1 (2020): 28-36. doi: 10.12691/ajrd-8-1-4.1. Introduction
Climate change (CC) is a long-term change in the weather patterns of a place or region over a long period of time. This could be a change in how much rain a place usually gets in a year. Or it could be a change in a place's usual temperature or humidity for a month or season. Climate takes hundreds or even millions of years to change while weather can change in just a few hours [1]. Due to these long-term changes in weather patterns largely affects natural and human made resources, agriculture, coastal regions, fisheries, forests, water resources, geological processes; floods and desertification for which have long-term effects on food security and human health in the world [2].
Like the other sectors climate changes have its negative impact on agriculture as well on one way or the other. The yield of many crops is being threatened severely due to increase in temperature in many parts of the word (OXFAM, 2009). Increase in temperature also results in increasing pests attack and diseases which results in low crop production. Negative impact of CC on crops and livestock poses a great threat to food security. CC
negatively affects the livestock production by reducing the availability of feed and fodder. Some of the predicted impacts of CC include increased variability in monsoon and winter rainfall patterns, increase in average temperatures, warmer winters, deteriorating ecosystems, the depression of glaciers in the Himalayas; and increased frequency of climatic extremes events like floods, cyclones, and droughts [3].
South Asia’s development are heavily dependent on agriculture makes it particularly vulnerable to CC and the local farmers are dependent on the open climate for their livelihoods and face the most severe challenges in term of CC. Among the South Asian countries Pakistan also has an agro-based economy which highly dependent on agriculture production and one of the most affected by CC. Pakistan is the 7th most exposed country to CC [4] and 6th largest country of the world in terms of population, consists of 207.8million individuals and majority of populations attached directly or indirectly to the agriculture sector [5]. The associated impacts of CC are disasters like flood, drought and fluctuation in precipitation patterns results in low yields, increase production risks and causing damage to livelihood of farmers.
activities. Recent changes in temperature and unpredicted weather pattern hardly affected the livelihoods of farmers in KP [6]. Knowing the importance of agriculture for rural livelihoods, the significance of CC adaptation is crucial. This research was conducted at Swabi District of KP which is also highly vulnerable to the impact of CC and causing extreme weather conditions and rising temperatures threating agriculture productivity and affect damage to farmer’s livelihood. To contribute to the existing literature on the aforementioned problems this research was conducted with the following objectives;
1.1. Objective of the Study
1. To study the perceptions of farmers about CC and its impacts.
2. To study the adaptive strategies preferred by the farmers.
2. Research Methodology
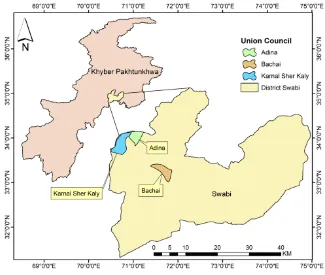
2.1. Description of the Research Area
Swabi district of Khyber Pakhtunkhwa (KP) was the research area and is the fourth most populous district of the province. The majority (83%) of population living in the rural area and mostly dependent on agriculture [5]. It lies between the rivers Indus and Kabul, in the west it is bounded with Mardan and Nowshera, to the north by district Buner, to the east by Haripur and to the south by district Attock. The district having four Tehsils i.e. Swabi, Razar, Topi, Lahore and 56 Union Councils (UCs). Among the Tehsils one Tehsil i.e. Razar was purposively selected because of the existing of highest numbers register farmers with the agriculture extension department of the district. Tehsil Razar consists of 20 UCs and among
these 3 UCs i.e. Adina (UC-I), Bachai (UC-II) and Karnal Sher Kaly (KSK, UC-III) were purposively selected (Figure 1). The reasons of purposively selection was the easily accessibility of the researcher to the farmers and the large time experience of the farmers in the farming.
2.2. Sampling and Sample Size
In the literature different approaches used for the selection of sample size includes sample size formula, already designed tables and precedence of others studies, but this study used percentage methods of sample size selection recommended by Kide [7], Belay et al., [8] and Kotu [9]. A total of 812 were registered farmers in the selected UCs. From the list 12% farmers were randomly selected in the Statistical Package of Social Sciences (SPSS, version-22) on 10% case basis for ensuring 9its randomility. The detail of sample size and its proportionate distribution presented in Table 1.
Table 1. Total registered farmers and sample size
UCs name Total farmers Sample farmers Adina (UC-I) 307 34 Bachai (UC-II) 298 35 KSK (UC-III) 207 29
Total 812 98
Source: Agriculture extension department district Swabi (2018) and own calculation.
2.3. Data Source Its Collection and Analysis
Primary data was collected by using a pre-tested structured questionnaire through face to face interview schedule using survey method. The collected data was edited and transferred to the SPSS-version-22 and STATA-version-12, by determining the simple frequency distribution and drawing of figures.
3. Results and Discussion
The results and discussion on CC in farmer’s perception their adaptive strategies pursued and factors affecting the adaptation presented as follows.
3.1. Age of the Farmers
The relation between farmer’s age and adaptation to CC determined by different researcher like Kide [7], Sanga et al., [10] and reported different findings. In the context of Pakistan Ali and Erenstein [11] reported that farmers having less than 50 years of age probably be more imaginative and quick to attempt new innovation and strategies towards CC. The data regarding farmer age are presented in Table 2, shows that age of the farmer are classified in to 5 class boundaries i.e. 20-30, 31-40, 41-50, 51-60 and 61-65. It is evident from the data that most (54%) of the farmers belongs to the age group of 31-50 years, while 39% of the farmers having age of 51-61 and above years. This shows that in the area majority of the farmers having the age from the middle one to the upper limits, the farmers during this age have the potential to work for the different CC adaptive strategies and to mitigate the problem. These findings are in line with Ali and Erenstein [11], stated that farmers having age of 50-65 years having a great curiosity to overcome the CC problems through adaptation process in Pakistan.
Table 2. Distribution of farmers on the basis of age
Age (Years)
UC-I (n=34) UC-II(n=35)
UC-III
(n=29) Total(n=98) No. % No. % No. % No. %
20-30 3 8.82 1 2.85 3 10.34 7 7.14 31-40 7 20.58 6 17.14 9 31.03 22 22.44 41-50 10 29.41 14 40 7 24.13 31 31.63 51-60 9 26.47 12 34.28 7 24.13 28 28.57 60-65 5 14.70 2 5.71 3 10.34 10 10.20
Source: Field data, 2018.
3.2. Household Size of the Farmers
Usually the number of people living in one home, share the expenses and eating from one kitchen are considered as one household and usually in one house there may or may not be more than one household [12]. The researchers Abid et al., [13] and Belay et al., [8], reported that Household Size (HHS) have positive relation to adaptations measures taking by the farmers to CC. Data regarding HHS of the farmers are tabulated in Table 3, which are classified into four class boundaries i.e. 2-5, 6-10, 11-15 and 16-20. The data shows that 47.95% of the farmers have 6-10 members in their households, in which 47.05% from UC-I, 57.14% from UC-II and 37.93% from UC-III. Also 25.51% of the farmers having HHS of 11-15 members. Thus it is cleared form the data that in the area the HHs size are large and thus contributing to the welfare of the HHs by allocating more labour to the farm and able to practice different adaptive strategies to CC. These results confirm the findings of Abid et al., [13] and Belay et al., [8], that in the large households size families having
more available labour for work at the field and hence increased the chances of the farmer’s to a particular adaptive strategies.
Table 3. Distribution of farmers on the basis of household’s size
Households size (numbers)
UC-I (n=34) UC-II (n=35)
UC-III
(n=29) Total (n=98)
No. % No. % No. % No. % 2-5 4 11.76 8 22.85 6 20.68 18 18.36 6-10 16 47.05 20 57.14 11 37.93 47 47.95 11-15 9 26.47 6 17.14 10 34.48 25 25.51 16-20 5 14.70 1 2.85 2 6.89 8 8.16
Sources; Field data, 2018.
3.3. Literacy Status and Level of Education of
the Farmers
Literacy status plays an important role in the farmer’s adaptive strategies to CC [8] because of awareness, the literate’s farmers have more abilities to adopt new and advanced technologies than illiterate. The data explaining the literacy statuses of the farmers are presented in Table 4, shows that majority (70.40%) of the farmers were literate and have different level of education while 29.59% were illiterate. Among the UCs 70.58% of farmers were literate in UC-I, 77.14% in UC-II and 62.06% in UC-III. Moreover, 33.33% of farmers have primary education, 23.18% matric, 21.73% middle, 14.49% intermediate, 4.34% bachelor and 2.89% of farmers have master level of education. These results show that literacy status was high in the area and helped the farmers in identifying the CC related risks and to adapt accordingly. This result is confirmed by the findings of Sanga et al., [10] pointed that the literate farmers perform a significant role in adaptive strategies to CC.
Table 4. Distribution of farmers on the basis of literacy status and level of education
Literacy Status
UC-I (n=34)
UC-II (n=35)
UC-III (n=29)
Total (n=98) No. % No. % No. % No. %
Literate 24 70.58 27 77.14 18 62.06 69 70.40 Illiterate 10 29.41 8 22.85 11 37.93 29 29.59
Level of education
Primary 9 37.5 6 22.22 8 44.44 23 33.33 Middle 7 29.16 5 18.51 3 16.66 15 21.73 Metric 4 16.66 7 25.92 5 27.77 16 23.18 intermediate 3 12.5 6 22.22 1 5.55 10 14.49 Bachelor 1 4.16 2 7.40 0 0 3 4.34
Master 0 0 1 3.70 1 5.55 2 2.89
Sources; Field data, 2018.
3.4. Farming Experience of the Farmers
18.36% having 10-15 years of experience. The average farming experience of the famers was 22.66 years with maximum 62 and the minimum 12 years. This implies that farmers have good experience of farming that’s helps them in perceiving the CC conditions. Kide [7], stated that the experienced farmers have more knowledge about weather patterns and its implications on crop productions compared to those who have less experience. These findings are also in line with the findings of Juana et al.,
[14] that higher farming experience increased the probability of taking different adaptive strategies.
Table 5. Distribution of farmers on the basis of farming experience
Farming experience
(years)
UC-I (n=34) UC-II (n=35)
UC-III (n=29)
Total (n=98)
No. % No. % No. % No. % 10-15 4 11.76 8 22.85 6 20.68 18 18.36 16-20 9 26.47 6 17.14 10 34.48 25 25.51 21-25 16 47.05 20 57.14 11 37.93 47 47.95 26 & above 5 14.70 1 2.85 2 6.89 8 8.16
Mean 21.37 23.71 20.88 22.66
Sources; Field data, 2018.
3.5. Farmers Tenure Status
Land tenure significantly contribute to CC adaptations process those who owned the lands adopt more than the tenant, also the land owners have more tendencies to the innovations [15]. The data in Table 6, shows the tenure status of the farmers. The data depicts that 39.79% of the farmers were owner cum tenant. Among the UCs 45.71% were in UC-II, 41.17% in UC-I and 31.03% of the farmers were owner cum tenants in UC-III. Adebanjo, [16]
mentioned that that farmers who own their land would increase the probability of using different adaptive strategies i.e. crop diversification, irrigation practices.
Table 6. Distribution of farmers on the basis of tenure status
Tenure Status UC-I (n=34) UC-II (n=35) UC-III (n=29) Total (n=98) NO. % No. % No. % No. %
Owner 11 32.35 8 22.85 13 44.82 32 32.65 Owner cum
tenant 14 41.17 16 45.71 9 31.03 39 39.79 Tenant 9 26.47 11 31.42 7 24.13 27 27.55
Sources; Field data, 2018.
3.6. Farmers Land Irrigation Status
The data regarding the type of farmer’s land irrigations status presented in Table 7. The data revealed that majority (81.63%) of the farmers having irrigated land. Across the different UCs UC-II and UC-III having more percentage of irrigated land than UC-I. Also 8.16% of the farmers having un-irrigated land and 10.02% of farmers having both irrigated and un-irrigated land. Un-irrigated land possession percentage are high in UC-I and III in comparison to UC-II. This may be due to the existence of irrigation sources in the different UCs. Results shows that farmers have access to water resources in the area which was also confirmed by the findings of Israr et al. [2], in Swabi, KP.
Table 7. Distribution of the farmers on the basis of irrigated and un-irrigated land Types UC-I (n=34) UC-II (n=35) UC-III (n=29) Total (n=98)
No. % No. % No. % No. % Irrigated 22 64.70 34 97.14 24 82.75 80 81.63 Un-irrigated 4 11.76 1 2.85 3 10.34 8 8.16
Both 8 23.52 0 0 2 6.89 10 10.20
Sources; Field data, 2018.
3.7. Farmer’s Farm Size
The data in Table 8 presents farmers farm size and is divided into 0.1-2, 2.1-4, 4.1-6, 6.1-8, and 8.1 & above acres. The data revealed that 42.85% of the farmers having a farm size of 4.1-6 acres, followed by 31.62% of the farmers having a farm size of 6.1-8.1 and above acres of land possession. More percentage was noted among the all selected UCs for 4.1-6 acres of farm size. Thus implies that the farmers holding the land ranging from different acres. Farm size is an important resource for agricultural production and other economic activities employment generation, livelihood and poverty alleviation [17]. According to Gbetibouo [18], and Daberkow and McBride,
[19] adoption of an innovation tends to take place earlier on those farmers who holding large size of land.
Table 8. Distribution of the farmers on the basis of farm size
Land holding
(acres)
UC-I (n=34) UC-II (n=35)
UC-III (n=29)
Total (n=98) No. % No. % No. % No. % 0.1-2 5 14.70 2 5.71 4 13.79 11 11.22 2.1-4 5 14.70 6 17.14 3 10.34 14 14.28 4.1-6 11 32.35 20 57.14 11 37.93 42 42.85 6.1-8 6 17.64 5 14.28 7 24.13 18 18.36 8.1 and
above 7 20.58 2 5.71 4 13.79 13 13.26 Sources; Field data, 2018.
3.8. Farmers Sources of Income
Different researcher i.e. [9,20,21] reported that the farmers have diversifies source of income would adopt to CC in better way as compared to those whose sources of income were only agriculture. The farmers of the selected area were involve in different income generating activities i.e. agriculture, off-farm income1 and non-farm income2
Table 9
. According to the results of , shows that agriculture was the main source of income of farmers which are mostly (63%) in which 55.88% from UC-I, 71.42% from UC-II and 55.17% from UC-III, while 24% of farmers involve in both agriculture and off-farm activities and the remaining 11% farmers have agriculture, off-farm and non-farm were the main sources of income among all the UCs. These findings were similar to the findings of [6]
that majority of the farmer’s income in district swabi was
1 Off-farm income=paid working in other farm, grain retailing/crops,
selling fuel wood/timber/grass, petty trade
2 Non-farm income=casual work, retailing goods, salaried worker, house
dependent on Agriculture, these finding were also followed by the report of government of Pakistan [22].
Table 9. Distribution of farmers on the basis main income sources
Sources
UC-I (n=34)
UC-II (n=35)
UC-III (n=29)
Total (n=98) No. % No. % No. % No. % Agriculturs 19 55.88 25 71.42 16 55.17 63 64.28 Agri+ off-farm 10 29.41 6 17.14 8 27.58 24 24.48 Agri+ off
+non-farm 5 14.70 3 8.57 3 10.34 11 11.22 Sources; Field data, 2018.
3.9. Cropping Pattern
Table 10. Distribution of the farmers on the basis of cropping pattern
Crops UC-I (n=34) UC-II (n=35) UC-III (n=29) Total (n=98)
No. % No. % No. % No. % Wheat 34 100 35 100 29 100 98 100 Maize 13 38.23 5 14.28 12 41.37 30 30.61 Tobacco 14 41.17 21 60 11 37.93 46 47 Sugarcane 7 20.58 9 25.71 6 20.68 22 22.44
Sources; Field data, 2018.
The crops grown were divided in to two categories i.e. food crop (wheat, maize) and cash crop (sugarcane and
tobacco). The data in Table 10, shows that all of the selected farmers cultivated the wheat crop. The data also pointed that tobacco (47%) were mostly cultivated in UC-II as compared to other two UCs, this is because the irrigations system on UC-II is majorly dependent on canal irrigation system and UC-I and III irrigations is dependent on tub wells and during low rainfall the water level goes down in the wells and farmers were mostly unable to irrigate their crops on time. These findings about main crops grown in district Swabi were also in lined with the findings of [6]
that wheat, maize, sugarcane and tobacco were the main crop that grown by the farmers in district Swabi.
3.10. Knowledge of Climate Change
Farmer’s perception is the first necessary steps in the adaptation to CC [23] and these are perceiving change and taking decision to adapt or otherwise. Farmer’s perception about knowledge of CC are presented in Figure 4, which revealed that majority (93%) of farmer’s have knowledge of climate change, while 7% of the farmers have no knowledge of CC. Thus, it’s cleared from the Figure 2, that farmers were aware of CC and in the research area and those farmers who were not aware of CC were excluded from further analysis. These findings are in line with the findings of [6] that majority of the farmers were aware of CC in the study area and was taking adaptive measures to CC to protect their livelihoods against extreme CC conditions.
Figure 2. Farmers perception about knowledge of climate change (Source; Field data, 2018)
Figure 3. Farmer’s perception on change in temperature trends (Source; Field data, 2018) 0
20 40 60 80 100
Having knowledhe Having no knowledhe 88
12 97
3 92
8 93
7
%
of
th
e fa
rme
rs
UC-I UC-II UC-III Overall
0 20 40 60 80 100
UC-I UC-II UC-III Overall
87 97
78 89
3 10 0 3 0 1
22
10
%
of t
h
e f
ar
m
ers
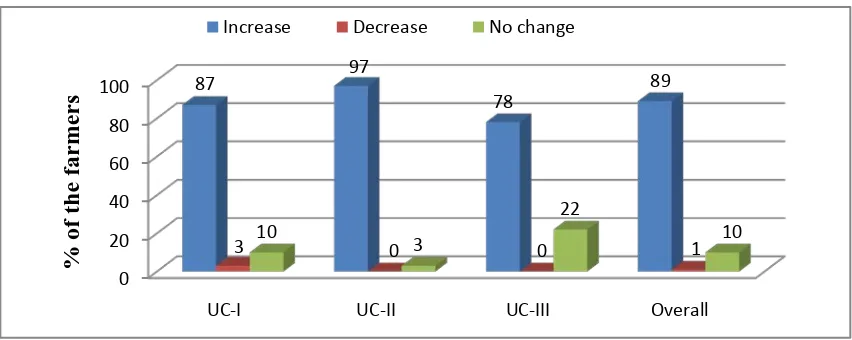
3.11. Change in Temperature Trends
The farmer’s perception about the temperature in the area during the last 10 years are presented in the Figure 3, shows that majority (89%) of the farmers perceived for increased in temperature, while 10% perceived no changes in temperature and 1% perceived a decreasing trends. The aforementioned results of majority were confirmed from the results of CCC [24], and Martin [25] reported that annual and seasonal temperature in district Swabi and KP increased for the last three decades and as a result the winter and springs days become warmer and summer and fall days getting hotter, coupled by reducing rainfall in fall and winter which is dangerous for the winter crops.
3.12. Change in Time of Precipitation
Changes in time of precipitations are presented in Figure 4, which shows that majority (86%) of farmer’s perceived changes in time of precipitation while 14% perceived no change in precipitation. Furthermore, Figure 4, highlighted that majority (82%) farmers perceived that summer rainfalls were increasing while 75% farmers perceived that winter rainfalls were decreasing. These trends are similar with the CCC [24], that winter rainfall in district swabi is continuously decreasing per decade with a rate of -7.6% and 12% continuously increase trend occurs in the summer rainfall per decade. Increase in temperature shifts the monsoon
precipitation up to 70% below the normal level [26]. There is no doubt that precipitation pattern have changed globally in recent due to which rains come earlier or later due to which crop sowing time are delayed and damage crop in young or in maturity stage when irrigation are not necessary. Change occurs in precipitation pattern because of CC which affect famers livelihood as well as agriculture productivity of the country [6].
3.13. Sources of Information
The percentages of the farmers perceptions on sources of information about CC presented in Figure 5. The study consider the sources like own understanding, neighbour farmers, personnel of agriculture extension department and seed sailing agencies. The figure presents that 35% farmers got aware of CC through their own experience and observations, while 30% from others neighbour farmers. Own understanding and other farmers were the mostly used information sources among the farmers in the area which were 65%. On one side it shows the cooperation of farmers, while on other hand it also creates confederacy that neighbour farmers are not expert and having exact information regarding CC and its impacts and it’s also leads to miscommunication gap. The role of extension services in CC information to the farmers in the research area were 13%. Also 22% of the farmers getting information from seeds sale agencies.
Figure 4(a). Farmer’s perception on change in precipitation patterns (Source; Field data, 2018)
Figure 4(b). Farmers perception on change in rainfall trends (Source; Field data, 2018) 0
20 40 60 80 100
UC-I UC-II UC-III Overall 87
80 89 86
13 20 11 14
%
of t
h
e f
ar
m
ers
Change No change
0 20 40 60 80 100
Summer rainfall Winter rainfall 82
6 3
75
15 19
%
of t
h
e f
ar
m
ers
Figure 5. Farmer’s Sources of Information about CC (OU= Own Understanding, NF= Neighbour farmers, AD= Agriculture extension department, SA= Seeds agenies. Source; field data 2018)
Figure 6. Farmers perception on impact of climate change (DP=Decline in crop production, WP= Weeds and pest pressure, CD= Communicable disease, FD= Flood, DR= Drought risks. Source; Field data, 2018)
3.13. Impact of Climate Change
The farmer’s perception on the impact of CC presented in Figure 6. Figure results shows that, 63% of the farmers indicates that crop production was decreased, 84% perceived for the increase in weed and pest pressure, communicable disease (81%) coupled by the risk of drought (50%) and Flood (16%) in the area. These results conformed the findings of Israr et al. [6], and Belay et al.,
[8] reported that the CC affecting the farmers livelihood by the factors like yield reduction, floods, pest and disease, drought and shortage of water in Pakistan and Ethiopia .
3.14. Adaptive Strategies Preferred
by Farmers to Climate Change
Adaptive strategies preferred by the farmers are shown in Figure 7. According to Figure 7 results Crop diversi fication (31%), Necessary farm inputs (23%) and soil and water
management practices (18%) were identified as the major adaptation strategies by farmers to climate change. Similarly, farmers preferred to change the planting dates (11%), practiced mixed farming (10%) and used drought tolerance varieties (7%) to cope with the CC in the study area.
3.15. Barriers to Climate Change Adaptations
The response of the farmers to climate change barriers are illustrated in the Figure 8, which shows that majority (82%) of the farmer’s perceived for ineffective government support. The lack of information was also the main barrier to adaptation which was indicated by 68% of the farmers. Similarly, lack of extension services (61%) and traditional beliefs (61%) is also among the main constraints to adaptation. Moreover, high cost of fertilizers (40%), lack of capital (41%), inaccessibility of water (36%) and shortage of farming land (29%) were also among the barriers to CC adaptation.
0 10 20 30 40 50 60 70 80 90 100
OU NF AD SA
44
26
12 18
29 34
17 20
32
27
10
31 35
30
13 22
%
of t
h
e f
ar
m
ers
UC-I UC-II UC-III Overall
0 20 40 60 80 100
DP WP CD FD DR
53
85
79
24
59 63
74 71
3 9
76
96 93
21
89
63
84 81
16
50
%
of t
h
e f
ar
m
ers
Figure 7. Barriers to climate change adaptations (Source: Field data, 2018)
Figure 8. Barriers to climate change adaptations (Source: Field data, 2018)
4. Conclusion
From the findings it was concluded that climate is changing and affect farmer’s directly or indirectly. Farmers have knowledge of CC and its related impact and perceived changes in temperature and rainfall for the last decade. The impacts of CC were the weed and pest pressure and in communicable disease on crops. The main sources of farmers information was their own understanding and experiences and from the neighbour farmers. The adaptive strategies preferred by the farmers were the crop diversification, necessary farm inputs and soil and water management practices. The major constraints to adaptations were ineffective government support, lack of information and extension services, traditional beliefs, high cost of fertilizers and lack of capital.
References
[1] NASA, National Aeronautics and Space Administration. (2018). What's the Difference between weather and climate? Retrieved from: https://www.nasa.gov, dated: 21/11/2018.
[2] Israr M, M. Faraz, D. Jan, N. Ahmad & S. Ahmad. 2016. Farming community perceptions about climate change in Khyber Pakhtunkhwa Pakistan. World J Agric Res 4(3): 70-76.
[3] Morton, J.F. 2007. Climate change and food security special feature: the impact of climate change on smallholder and subsistence agriculture. Proceedings of the National Academy of Sciences 104 (59): 19680-19685.
[4] Kreft S., Eckstein D., Dorsch L., Fischer L., 2016. Global climate risk index 2016: who suffers most from extreme weather events? Weather-related loss events 1995 to 2014. Published by german-watch.
[5] Pakistan Bureau of Statistics (PBS). 2017. Retrieved from www. Pbs. Gov.pk.
[6] Ahmad. S, M. Israr and M. U. Rehman . 2017. Agronomic practices and adaptive strategies of the farmers to climate change 11%
10%
18%
31% 23%
7%
Adaptive stargtegies
Changing planting dates Mixed farming soil and water management practices Crop diversification Necessary farm inputs Drought tolerence varieties
68%
41%
29%
6% 61%
40% 61%
82%
36% 1%
Lake of infomation Lake of capital
Shortage of farming land No observing climate related problems Lack of extension services High cost of fertilizers
in central Pakhtunkhwa, Pakistan. J. Pure Appl. Bio. 6 (4): 1132- 1150.
[7] Kide, G.T. 2014. Smallholder farmers’ adaptation strategies to climate change In Ethiopia. PhD dissertation, Mekelle University,
Ethiopia.
[8] Belay, A., J. W. Recha, T. Woldeamanuel and J. F. Morton. 2017. Smallholder farmers’ adaptation to climate change and determinants of their adaptation decisions in the Central Rift Valley of Ethiopia. Research paper, retrieved from
www.agriculturandfoodsecurity.com.
[9] Kotu, L.L. 2013. climate change perception and smallholder farmers ‘Adaptation strategies: the case of tole district, Southwest showa zone, oromiyaregionalstate, Ethiopia.
[10] Sanga, G. J., A. B. Moshi and J. P. Hella. 2013. Small scale farmers’ adaptation to climate change effects in Pangani River Basin and Pemba. Int. J. Soc. Sci, 2013, 2(3): 169-194.
[11] Ali, A and O. Erenstein. 2016. Assessing farmer’s use of climate change adaptation practices and impact on food security and poverty in Pakistan. J. Elsevier. V. 16:183-194.
[12] Steven M. S. 2003. Economics: Principles in action. Upper Saddle River, New Jersey 07458: Pearson Prentice-Hall. p. 29.
[13] Abid, M and J. Scheffran, U.A. Schneider and M. Ashfaq. 2014. Farmers’ perceptions of an adaptation strategies to climate change and their determinants: the case of Punjab province, Pakistan. Earth Syst. Dynam. J. EGU. 6: 225-243.
[14] Juana, S., Z. Kahaka and N. Okurut. 2013. Farmers’ perceptions and adaptations to climate change in sub-sahara Africa: a synthesis of empirical studies and implications for public policy in African agriculture. J. Agri. Sci. Vol. 5(4).
[15] Ajibefun A. and A. Fatuase. 2011. Perception and adaptation to climate change among farmers in selected communities of Ekiti State, Nigeria. J. Agri. 31 (3):101-114
[16] Adebanjo, O. M. 2013. The effects of climate change adaptation strategies on food crop production efficiency in Southwestern Nigeria. Phd thesis. Department Of Agricultural Economics, University Of Nigeria.
[17] United Republic of Tanzania (URT). 2010. National Environmental Policy. The Economic Survey 2010. KIUTA, Dar es Salaam
[18] Gbetibouo, G. A. 2009. Understanding farmers’ perceptions and adaptations to climate change and variability: The Case of the Limpopo Basin, South Africa, IFPRI Discussion Paper. Retrieved from www.ifpri.org
[19] Daberkow, S., & McBride, W. 2003. Farm and operator characteristics affecting awareness and adoption of precision agriculture technologies in the US. Precision Agriculture, 4:163-177.
[20] Temesgen, D. 2010. Factors affecting the choices of coping strategies for climate extremes: the case of farmers in the Nile Basin of Ethiopia, PhD Dissertation, Pretoria University.
[21] TatekGabreab. 2012. Dynamics of livelihood strategies in the context of food security: (unpublished M.Sc. thesis), Haramaya University, Haramaya, Ethiopia.
[22] Government of Pakistan (GOP). 2016. Agriculture statistics of Pakistan 2015-2016, Economic wing, ministry of food and agriculture, Islamabad, Pakistan.
[23] Asfir, S. S. 2014. Adoptative strategies of smallholder farmers: the case of assosa district of enishangulgumuz regional state, western Ethiopia.
[24] Climate Change Center. 2014. Climate Scenarios 2011-2040. District Haripur, Swabi, Attock and Chakwal, Pakistan. The University of Agriculture Pakistan.
[25] Martin, K. 2012. Linking climate change with food security in high land of Khyber Pakhtunkhwa north-west Pakistan. Master thesis. Wurzburg University Germany.
[26] Schewe. J and A. Levermann. 2012. A statistically predictive model for future monsoon failure in India. Potsdam institute for climate impact research, Telegrafenberg A62, D-14473 Potsdam, Germany Institute of Physics, Potsdam University, Germany. Environ. Res. Lett. 7 (2012) 044023 (9pp).