R E S E A R C H A R T I C L E
Open Access
Silicate solution, cation properties, and
mass transfer by aqueous fluid in the
Earth
’
s interior
Bjorn Mysen
Abstract
Aqueous fluids in the Earth’s interior are multicomponent systems with silicate solubility and solution mechanisms strongly dependent on other dissolved components. Here, solution mechanisms that describe the interaction between dissolved silicate and other solutes were determined experimentally to 825 °C and above 1 GPa with in situ vibrational spectroscopy of aqueous fluid while these were at high temperature and pressure. The
silicate content in Na-bearing, silicate-saturated aqueous fluid exceeds that in pure SiO2at high temperature and
pressure. Silicate species were of Q0(isolated SiO4tetrahedra) and Q 1
(dimers, Si2O7) type. The temperature
dependence of its equilibrium constant,K=XQ1/(XQo) 2
, yields enthalpies of 22 ± 12 and 51 ± 17 kJ/mol for the SiO2–
H2O and Na-bearing fluids. In contrast, in Ca-bearing fluids, the solubility is more than an order of magnitude lower,
and only Q0species are present. The present data together with other published experimental information lead to the conclusion that the silicate solubility in aqueous fluids in equilibrium with mafic rocks such as amphibolite and peridotite is an order of magnitude lower than the solubility in fluids in equilibrium with felsic rocks such as andesite and rhyolite compositions (felsic gneiss) under similar temperature and pressure conditions. The silicate speciation also is more polymerized in the felsic systems. This difference is also why second critical end-points in the Earth are at lower temperature and pressure in felsic compared with mafic systems. Alkali-rich fluids formed by dehydration of felsic rocks also show enhanced high field strength element (HFSE) solubility because alkalis in such solution form oxy complexes with the HFSE cations. Fluids formed by dehydration of felsic rocks in the Earth’s interior are, therefore, more efficient transport agents of silicate materials than fluids formed by dehydration of mafic and ultramafic rocks, whether for major, minor, or trace elements.
Keywords:Aqueous fluid, Solubility, Structure, Spectroscopy, Silicate
Introduction
The solubility and solution mechanism(s) of silicate com-ponents in aqueous fluids in the Earth’s interior are central to our understanding of the roles of aqueous fluids in ma-terial transport within the Earth (Fockenberg et al. 2006; Newton and Manning2009; Burchard et al.2011). This is particularly so in and near subduction zones where water-rich fluids released from dehydrating slab materials can transport chemical components into source regions of melting and, at the same time, deplete dehydrating slab materials of fluid-soluble components (Mibe et al. 2008; Kawamoto et al. 2012). In this environment, hydrated rocks ranging from amphibolite and peridotite to felsic
gneiss compositions are subjected to dehydration and re-lease of silicate-saturated water-rich fluids.
The abundance of components known to affect silicate solubility in aqueous fluid differs significantly among those rock types in the Earth’s interior. It is necessary, therefore, to determine how individual compositional variables affect the silicate solubility and structure of dissolved silicate in aque-ous fluids at relevant high-temperature and high-pressure conditions.
Composition and structure of silicate-saturated aqueous fluids at high temperature and pressure have been deter-mined experimentally for pure SiO2–H2O systems as well
as for some more complex silicate and aluminosilicate compositions (Newton and Manning 2002; Kessel et al. 2005; Mibe et al. 2008, 2011; Mysen 2010). From those
Correspondence:[email protected]
Geophysical Laboratory, Carnegie Institution of Washington, Washington, DC, USA
experiments, it is evident that silicate solubility in aque-ous fluids depends on the presence of other compo-nents in addition to SiO2. In the MgO–SiO2–H2O
system, for example, the solubility in the aqueous fluid decreases with increasing Mg/Si abundance ratio (Zhang and Frantz2000). Addition of aluminosilicate components to SiO2also enhances the solubility in fluid (Wilke et al.
2012). However, quantitative characterization of how indi-vidual components affect silicate solubility and solution mechanisms of other components in aqueous fluids is not well developed.
Determination of fluid composition and structure at temperature and pressure conditions of the deep crust, upper mantle, and beyond is challenging because silicate-saturated fluids commonly do not retain in solu-tion the chemical components and the fluid structure that existed at the high temperature and pressure after temperature quenching from experimental conditions to ambient temperature and pressure. Various methods have been proposed with which to overcome these ob-stacles. For example, Kessel et al. (2004) described a method whereby fluids were soaked into layers of pore space among diamond particles during experiments. Analysis of these diamond aggregates after termination of an experiment provided the fluid data. Others rely on ac-curate weighing of crystals from the experimental charges before and after an experiment at high temperature and pressure during which crystalline material equilibrated with fluid (Manning and Boettcher1994). The weight difference is the weight of the solute.
An alternative, which does not rely on quenching to am-bient conditions before analysis, is to conduct structural characterization of fluids in the equilibrium with one or more condensed phases while at the temperatures and pressures of interest. This can be accomplished with the sample contained in an externally heated hydrothermal diamond anvil cell (Bassett et al.1993). Here, this experi-mental protocol was employed to assess the influence of alkalis and alkaline earth cations on SiO2 solubility in
aqueous solutions to temperatures and pressures corre-sponding to the deep crust and upper mantle.
Methods/Experimental
Three different starting materials were used. Those were crystalline quartz + H2O, crystalline quartz + 0.7 m NaOH
aqueous solution, and an SiO2+ CaO mixture + H2O
(SiO2:CaO = 9:1 by mol). By using NaOH as the Na+
-bear-ing fluid component, it cannot be ruled out that an increased pH compared with pure H2O could also affect
the silicate solubility in the fluid.
The CaO–SiO2 material was prepared by melting at
ambient pressure at 1725 °C followed by crystallization at 1500 °C. At 1725 °C, this system comprises immiscible
silicate liquids (Osborn and Muan 1960). In order to form the crystalline SiO2 component desired to
equili-brate with fluid, the crystallization step at 1500 °C was performed. This mixture, consisting of crystalline tridy-mite + glass (Ca-rich) was used together with H2O as a
starting material. During the experiments, tridymite con-verted to quartz and glass to wollastonite, as discussed further below.
The experiments were carried out in an externally heated, hydrothermal diamond anvil cell (HDAC) of the design originally described by Bassett et al. (1993). In the HDAC, the sample was heated with external heaters. These heaters were comprised of Mo wire wrapped around the SiC diamond seats of upper and lower diamonds that were held in place with alumina high-temperature cement. Iridium gaskets (125μm thick) with a 500-μm sample hole were employed for sample containment. During an experi-ment, the gaskets shrunk to about 80 μm thickness and the hole to ~ 400μm diameter.
MicroRaman spectroscopy and optical microscopy were used to characterize the samples while these were in the HDAC at the pressure/temperature of interest. The Raman system is a JASCO model NRS-3100 confocal microRaman spectrometer with a single monochromator and holo-graphic gratings (1200 and 2400 grooves/mm). A long working distance (25 mm), × 50 magnification, 0.42 N.A. objective lens was used in this design, which provided a better than 5μm spatial resolution for sample examination and spectroscopic characterization. The sampling depth was about 30 μm (Mysen 2015a). The signals were re-corded with an Andor™ Model DV401-F1 1024 × 28 pixel Peltier-cooled CCD (charge-coupled detector). Energy resolution was ± 3 cm−1 with 1200 grooves/mm gratings, whereas with 2400 grooves/mm, spectral reproducibility was about 1 cm−1.
Temperatures in the diamond cell were monitored with two K-type thermocouples that touched the dia-monds at a ~ 1-mm distance from the sample chamber. A feedback mechanism was utilized for temperature control. Temperature precision was ± 1 °C, whereas the uncertainty, determined against the melting point of NaCl, was 2–3 °C. The gasket hole in the Ir gasket material deformed some during the experiments, which were not, therefore, strictly isochoric. Pressure could not, therefore, be calculated from the PVT data of pure H2O. Furthermore, silicate components dissolved in the
fluid also affect the equation of state of H2O (Mysen
together with 2400 grooves/mm gratings, a frequency uncertainty of ± 0.1 cm−1 was obtained. This uncer-tainty translates to a pressure precision of ± 40 MPa. However, the overall pressure uncertainty is approxi-mately ± 110 MPa when taking into considerations the uncertainties in the pressure calibration by Mysen and Yamashita (2010).
Several series of measurements at different temperatures and pressures were carried out with the three different starting materials such that for each of the three starting compositions, the sample was first taken to the highest planned temperature and pressure and left there for an hour before spectroscopic measurements. The sample was then cooled at 1 °C/s in 50–75 °C intervals to the next temperature and pressure condition where the spectra were recorded after about 60-minute dwell time. With this sample configuration, the 60-minute dwell time is suffi-cient to reach equilibrium (Mysen2015b).
Results
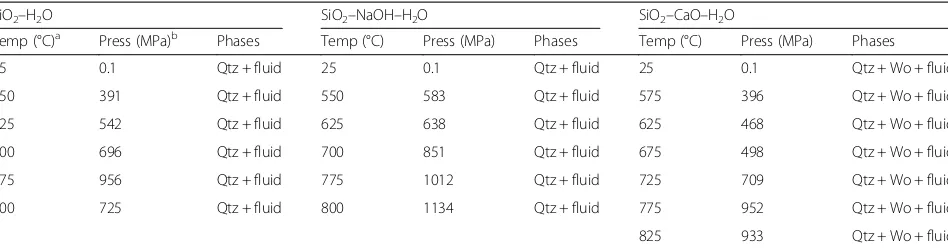
Quartz and aqueous fluid were present in all experi-ments (Table 1). Additionally, in the system SiO2–CaO–
H2O, wollastonite coexists with quartz and fluid (Fig.1).
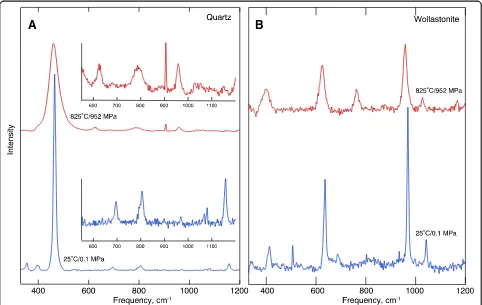
The quartz and wollastonite, identified from their Ra-man spectra, grew from the starting materials during the initial hour at the highest temperature and pressure. The high-temperature spectra typically are broader and less well resolved compared with the spectra recorded at am-bient temperature and pressure (Fig.2).
The spectra of silicates and fluid at high temperature and pressure show Raman signals in a high-frequency
region centered between 3500 and 3600 cm−1 and a
low-frequency region between 300 and 1200 cm−1. The high-frequency region comprises that of the fundamental O–H vibrations in OH groups, whether in molecular H2O or as OH groups that form bonding with metal
cat-ions (Ratcliffe and Irish1982; Walrafen et al. 1986). The low-frequency region, between about 300 and 1200 cm−1,
includes the Raman bands assigned to vibrations in Si–O, Al–O, and metal oxide components (Brawer and White 1975; McMillan et al.1992).
The high-frequency region comprises a single slightly asymmetric band. The asymmetry is less pronounced in the spectra from fluid in SiO2–CaO–H2O than for the
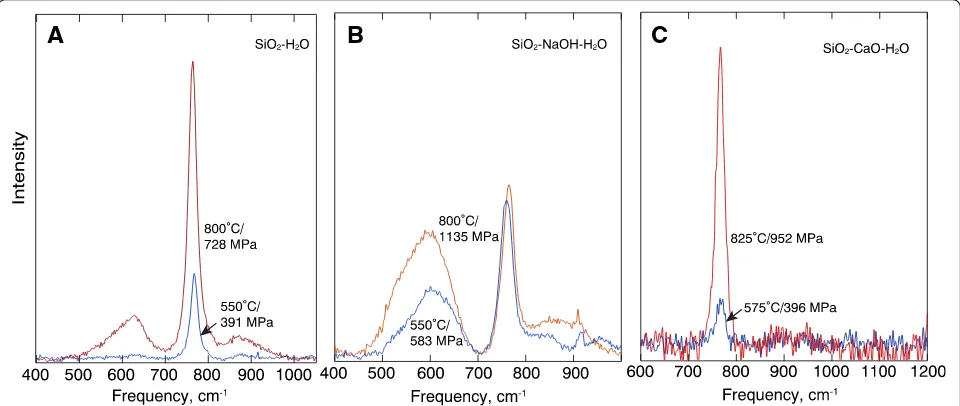
other two compositions (Fig. 3). The low-frequency region characteristically has a strong and sharp band be-tween 770 and 800 cm−1(Fig.4). In the SiO2–CaO–H2O
fluid spectra, this is the only Raman band in this fre-quency region (Fig. 4c), whereas for SiO2–H2O and
SiO2–NaOH–H2O fluids, there is a Raman intensity on
both the low- and high-frequency side of 770–800 cm−1 peak (Fig.4a, b). These latter intensities are strongest in the spectra of SiO2–NaOH–H2O fluids (Fig.4b). The
in-tensity of all bands grows with the increasing temperature and pressure.
The 770–800 cm−1 band is assigned to Si–O− stretch vibrations in isolated SiO4 tetrahedra (Q0 species) with
one or more of the nonbridging oxygens forming bonds with H+ (Zotov and Keppler 2002; Mibe et al. 2008). This is the same vibration as that gives rise to a ~ 850 cm−1 Raman band in anhydrous silicate melts and glasses (see review of Raman band assignments in such
systems by Mysen and Richet 2005). The lower
fre-quency of the Si–O− stretch vibration in hydrous melts is because of the much smaller radius of H+ bonded to nonbridging oxygens in the structure compared with alkali metals and alkaline earths. Raman intensity at a higher frequency, as observed in the spectra of SiO2–H2O
and SiO2–NaOH–H2O fluid, is assigned to Si–O−
vibra-tions in silicate species more polymerized than isolated SiO4groups. Most likely, these are species with one
bridg-ing oxygen (Q1species) (Mysen et al. 2013). Bending vi-brations of such a bridge give rise to the intensity centered near 600 cm−1.
It follows, therefore, that for fluids in equilibrium with quartz in the system SiO2–NaOH–H2O, the
sili-cate polymerization with Q0 and Q1 species is similar
Table 1Run data
SiO2–H2O SiO2–NaOH–H2O SiO2–CaO–H2O
Temp (°C)a Press (MPa)b Phases Temp (°C) Press (MPa) Phases Temp (°C) Press (MPa) Phases
25 0.1 Qtz + fluid 25 0.1 Qtz + fluid 25 0.1 Qtz + Wo + fluid
550 391 Qtz + fluid 550 583 Qtz + fluid 575 396 Qtz + Wo + fluid
625 542 Qtz + fluid 625 638 Qtz + fluid 625 468 Qtz + Wo + fluid
700 696 Qtz + fluid 700 851 Qtz + fluid 675 498 Qtz + Wo + fluid
775 956 Qtz + fluid 775 1012 Qtz + fluid 725 709 Qtz + Wo + fluid
800 725 Qtz + fluid 800 1134 Qtz + fluid 775 952 Qtz + Wo + fluid
825 933 Qtz + Wo + fluid
a
Temperature uncertainty, 2–3 °C
b
to that in SiO2–H2O fluid spectra at higher pressures
(Mysen et al. 2013). It also resembles the aqueous fluids in the equilibrium with alkali aluminosilicate melt under similar temperature and pressure condi-tions (Mysen 2010).
Discussion
The Raman spectra indicate that the silicate concentra-tion and speciaconcentra-tion in the fluid at given temperature and
pressure is dependent on the nature of the crystalline materials in the equilibrium with the fluid.
Solubility
Silicate solubility in the aqueous fluids might be esti-mated by combining silica solubility in the fluid in the system SiO2–H2O (Manning 2004) with the intensity of
relevant Raman bands in order to generate a calibration curve from the intensity of Raman bands in spectra of
A
B
Fig. 1Examples of microphotographs of samples in the hydrothermal diamond anvil cell at high temperature and pressure.aView of the sample from SiO2–NaOH–H2O at 800 °C and 1135 MPa.bView of the sample from SiO2–CaO–H2O at 825 °C and 925 MPa
A
B
fluid. This calibration curve then may be used to com-pute an approximate solubility of SiO2in the fluids from
the other two series of experiments (SiO2–NaOH–H2O
and SiO2–CaO–H2O).
The silicate contents of fluid in equilibrium with quartz in the SiO2–H2O system were calculated with
the algorithm of Manning (1994) in which the
temperature and the density of pure H2O are
vari-ables. For the density of the fluid, the calculations by Withers, using the formulism of Pitzer and Sterner (1994), were employed [URL: https://www.esci.umn.edu/ people/researchers/withe012/fugacity.htm]. Those SiO2
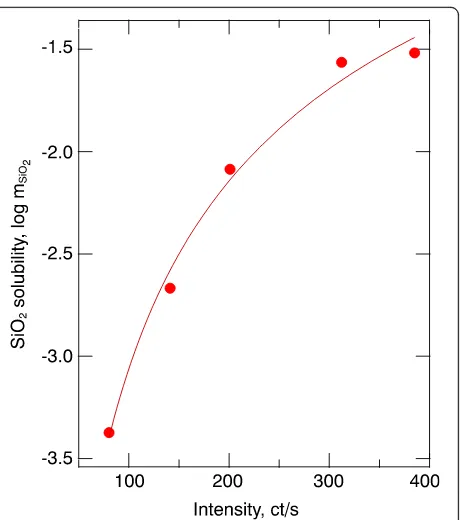
solubilities (Table 2) were then used to create a cali-bration curve based on the 770 + 850 cm−1 integrated Raman intensities from the fluid spectra (see Fig. 4). The data points defining the solubility relations were fitted to the function (Fig. 5):
logmSiO2ðmol=kgÞ ¼1:6−2:0•Int−0:32ðcts=sÞ; ð1Þ
where “Int” is the integrated intensity of the 770 + 850 cm−1Raman bands in counts per second, andmSiO2
is silica molality.
A
B
C
Fig. 3Examples of high-frequency portion of Raman spectra in the systems SiO2–H2O (a), SiO2–NaOH–H2O (b), and SiO2–CaO–H2O (c) at
pressure and temperature conditions as indicated on the individual spectra
A
B
C
Fig. 4Examples of low-frequency portion of Raman spectra in the systems SiO2–H2O (a), SiO2–NaOH–H2O (b), and SiO2–CaO–H2O (c) at pressure
The SiO2solubility in the SiO2–NaOH–H2O and SiO2–
CaO–H2O fluids was then derived from the calibration
curve in Fig. 6 and the integrated Raman intensities at 770 + 850 cm−1 from the SiO2–NaOH–H2O and CaO–
SiO2–H2O fluid spectra. In doing this, it was assumed that
the different cations, H+, Na+, and Ca2+, in the aqueous solutions had no effect on the Raman intensities and that possible temperature and pressure effects in the pressure range under study on Raman intensity can be ignored.
With the above caveats in mind, the SiO2solubility in
SiO2–CaO–H2O fluids from the calibration curve in
Fig. 6 is an order of magnitude, or more, lower than in the SiO2–NaOH–H2O and SiO2–H2O fluids in thefH2O
(H2O fugacity) range defined by the temperature and
pressure conditions of these experiments (Fig.6; Table2). The solubility difference does, however, decrease with increasing fugacity of H2O.
The significant solubility depression resulting from 10 mol% CaO to SiO2appears similar to that from MgO
in the system MgO–SiO2–H2O (Zhang and Frantz
2000). This effect contrasts with adding NaOH where, despite the dilution of SiO2 concentration, the SiO2
solubility in aqueous fluids is similar to that in the
Table 2Solubility data
SiO2–H2O
Temp (°C) Press (MPa) Density (g/cm3) fH2O(MPa) SiO2solubility, mSiO2(kg/mol)a
800 728 0.794 852 0.0304
775 956 0.876 1440 0.0273
700 696 0.831 668 0.0082
625 542 0.813 364 0.0022
550 391 0.789 178 0.0004
SiO2–NaOH–H2O
Temp (°C) Press (MPa) Density (g/cm3) f
H2O(MPa) SiO2solubility, mSiO2(kg/mol) b
800 1135 0.911 1978 0.0238
775 1012 0.891 1642 0.0448
700 851 0.88 999 0.0288
550 583 0.871 328 0.0092
SiO2–CaO–H2O
Temp (°C) Press (MPa) Density (g/cm3) fH2O(MPa) SiO2solubility, mSiO2(kg/mol)b
575 396 0.775 198 4.86525E−08
625 468 0.779 291 1.43231E−07
675 498 0.764 362 1.38469E−05
725 709 0.824 723 9.61047E−05
775 953 0.875 1430 0.000369701
825 933 0.849 1444 0.000506355
a
Calculations using the formalism from Manning (1994)
b
See text for calculations
Fig. 5Calibration curve for SiO2solubility as a function of 770 +
850 cm−1integrated band intensity from the system–H2O with silica
solubility calculated with the algorithm of Manning (1994). The fitted curve is logmSiO2(kg/mol) = 1.6–2.0 × Int−0.32, where“Int”denotes the integrated Raman intensity andmSiO2is silica molality of aqueous fluid
Fig. 6Silicate solubility in the SiO2–H2O, SiO2–NaOH–H2O, and
SiO2–CaO–H2O systems as a function of fugacity of pure H2O (see
simpler SiO2–H2O system. The solubility is, however,
more sensitive tofH2O in the SiO2–NaOH–H2O system
so that at high H2O fugacity, the SiO2 solubility in the
SiO2–NaOH–H2O system exceeds that in SiO2–H2O
fluids (Fig. 6). The temperature/pressure coordinates of the solubility cross-over (750–800 °C at ~ 900 MPa), from linear extrapolation of the curves in Fig. 6, occur at the conditions just below the second critical point in the SiO2–H2O system at 1080 °C and 970 MPa (Kennedy
et al. 1962). In contrast, linear extrapolation of the SiO2–CaO–H2O line leads to a cross-over at an fH2O
corresponding to ~ 1300 MPa pressure at 800 °C. These pressure and temperature conditions are inside the super-critical region of the SiO2–H2O system, which means that
conditions of greater silica solubility in SiO2–CaO–H2O
fluids than in SiO2–H2O and SiO2–NaOH–H2O cannot
be realized.
Silicate speciation in fluid
The approximate concentration of the silicate species in fluid (Qnspecies) can be obtained from the integrated in-tensities of the 770 and 850 cm−1 bands of the Raman spectra of fluid. The concentrations thus obtained depend, however, on the assumption that the relative intensities of these two Raman bands are equal to the mol fraction of the species. Given the similar Si–O− force constants for Si–O− stretch vibrations in Q0and Q1in hydrous melts (Cody et al.2005), the equivalence of relative intensities of the 770 and 850 cm−1bands and the mol fraction of Q0 and Q1species seems a reasonable assumption.
In the SiO2–H2O and SiO2–NaOH–H2O systems,
silica-saturated fluids contain both Q1 and Q0 species, whereas in the SiO2–CaO–H2O system, only Q0 species
were detected in the temperature and pressure range. For the SiO2–H2O and SiO2–NaOH–H2O fluids, the Q0
abundance decreases with increasing temperature and pressure although this decrease is more pronounced in the SiO2–NaOH–H2O system. This decrease is coupled
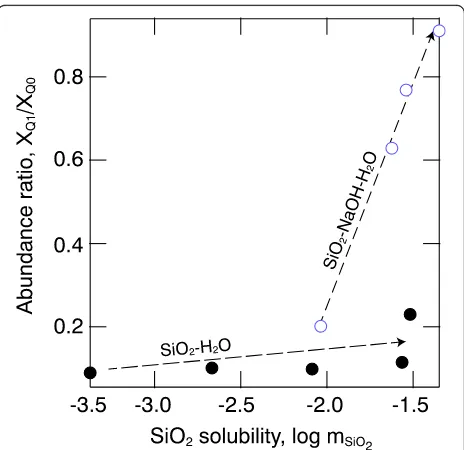
with increasing Q1abundance. The rate of change of the abundance ratio,XQ1/XQ0, with temperature and pressure
is considerably faster in the SiO2–NaOH–H2O system
and, in fact, can be expressed as linear functions of SiO2
molality,mSiO2(Fig.7). Qualitatively, this behavior
resem-bles that for SiO2–H2O and SiO2–MgO–H2O fluids at
pressures above 2 GPa (Mysen et al.2013). This behavior also is qualitatively similar to that of increased silicate polymerization with increasing total SiO2concentration in
silicate melts (Buckermann et al.1992). The difference in silicate species abundance between SiO2–H2O and SiO2–
NaOH–H2O fluids probably occurs because steric
hin-drance associated with nonbridging oxygen (NBO) bond-ing to H+ is greater than Na+–NBO bonding given the much smaller ionic radius of H+. Protons will, therefore,
favor nonbridging oxygen in Q0species, whereas Na+ will form bonding with nonbridging oxygen in Q1 species. Hence, the more rapid increase in XQ1/XQ0in the SiO2–
NaOH–H2O systems than in SiO2–H2O.
Thermodynamic considerations
When Q0 and Q1 species are present in the fluid, the equilibrium is:
2Q0⇔Q1; ð2Þ
with the equilibrium constant:
Kð Þ2 ¼XQ1= XQ0
2
; ð3Þ
whereXQ1andXQ0are mol fractions of Q1and Q0,
re-spectively. This equilibrium applies to the SiO2–H2O
and SiO2–NaOH–H2O fluids in the temperature and
pressure range discussed here. We note that it differs from that of SiO2–H2O at higher pressures (1.8–
5.2 GPa) where the silica concentration is sufficiently high to stabilize even more polymerized Q2 species as well (Mysen et al.2013).
The silicate speciation in the SiO2–CaO–H2O fluids
is simpler than in the other two systems as the only species throughout the temperature and pressure is
Q0 only (Fig. 4). Under such circumstances, the
equilibrium constant equals concentration in the fluid, mSiO2:
K¼mSiO2: ð4Þ
From the temperature dependence of the equilibrium con-stants, the enthalpy change of the reactions follows from:
lnK¼−ΔH=RTþΔS=R; ð5Þ
whereΔHandΔSare the enthalpy and entropy changes, Tis absolute temperature, andRis the gas constant. It is as-sumed in using this equation that there is no pressure effect on the equilibria in the pressure range of these experimental results (Table 1). This conclusion is substantiated by the SiO2–H2O and SiO2–MgO–H2O fluid data of
Mysen et al. (2013) who did not detect a pressure depend-ence in the same pressure range as the present experiments.
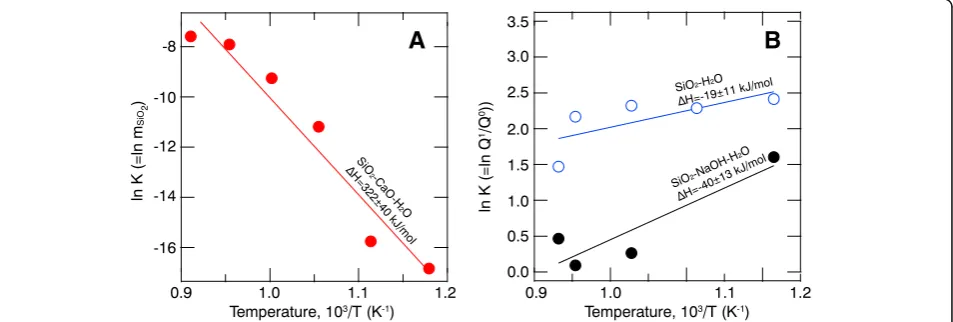
A linear fit to ln Kversus 1/T yields significantly dif-ferentΔHvalues for the equilibria among the Qnspecies in the fluid (Fig. 8). For the SiO2–CaO–H2O system
(Fig. 8a), equilibrium (4) describes the situation. It is more sensitive to temperature (ΔH= 322 ± 4 kJ/mol) than equilibrium (2), which describes the speciation variations in the SiO2–H2O (22 ± 12 kJ/mol) and SiO2–NaOH–H2O
systems (51 ± 17 kJ/mol; see Fig.8).
Conclusions
Silicate speciation in silica-saturated aqueous fluids suggested from thermodynamic modeling indicates that species more polymerized than Si (OH)4 type exist in
aqueous fluids under pressure/temperature conditions relevant to upper mantle processes (Newton and Manning 2003). This suggestion is consistent with the structural observations reported here and elsewhere (Zotov and Keppler2002; Mysen et al.2013). We also note, however, that when NaOH instead of CaO is the third component
added to SiO2–H2O, the silicate solubility is higher, and
both Q0and Q1species occur in the SiO2–NaOH–H2O
fluids at lower pressures than in the alkaline earth systems. We note, though, that in these experiments Na+ was added as an NaOH + H2O solution. We cannot rule out a
contribution to the silicate solubility from the alkaline nature of the fluid such as, for example:
2Qnþ2Naþ þ2OH−¼2Qn−1þH2O; ð6Þ where, therefore, pH would be a contributing factor to the silicate solubility.
Furthermore, as the silicate concentration in aqueous fluids increases and silicate species becomes more poly-merized with pressure and temperature, the types and abundance Qn species more closely resemble those in hy-drous silicate melts (Zotov and Keppler 1998; Cody et al. 2005; Mysen 2010). This structural evolution may lead to complete miscibility between silicate and aqueous fluid. It is likely that complete miscibility between fluid and melt occurs at lower pressure in alkali silicate systems than in those of alkaline earth silicate systems because of the greater silicate solubility in alkali silicate fluids. This conclu-sion accords with experimental observations that show complete miscibility near 1–1.5 GPa in alkali silicate and aluminosilicate systems, whereas pressure exceeds 3 GPa before reaching miscibility in alkaline earth systems (Bureau and Keppler1999; Stalder et al.2001; Mibe et al.2007).
Experimental data indicate that solubility of geochemi-cally important minor and trace elements in aqueous fluids can be significantly affected by other silicate compo-nents (Manning2007; Mysen2012a,b). This happens be-cause the stability and concentration of minor and trace element complexes (oxy complexes) in fluids depend on the electronic properties of cations available for this pur-pose in the fluid (Mysen 2012b, 2015b). This means that when considering partitioning of such elements between
A
B
minerals and aqueous fluids in the upper mantle and deep crust, pressudependent partition coefficients likely re-flect changing silicate-cation interaction in the fluid as a function of silicate solubility and speciation.
Qualitatively, this behavior also means that for fluids in equilibrium with mafic and ultramafic mineral assem-blages where alkaline earths are dominating cations, the silicate solubility in fluid is less and silicate polymerization is less extensive than in fluids in the equilibrium in felsic systems such as typical gneiss compositions, for example, where alkali metals are more important. Moreover, be-cause the fluid composition in equilibrium with such different crystalline rocks differs, minor and trace element complexing in those different fluids also differs, which leads to different fluid-melt-crystal partition coefficients as a function of rock type (mineral assemblage) with which aqueous fluids equilibrated.
Abbreviations
ΔH:Enthalpy change;ΔS: Entropy change; CCD: Charge-coupled detector;
fH2O: H2O fugacity; HDAC: Hydrothermal diamond anvil cell; HFSE: High field
strength element;mSiO2: SiO2molality;R: Gas constant;XQ0: Mol fraction of
Q0species;XQ1: Mol fraction of Q1species
Acknowledgements
Instrument, electronics, and library support was provided by Geophysical Laboratory technical staff. Their support is gratefully acknowledged.
Funding
This research was supported by grant EAR1212854 from the National Science Foundation.
Availability of data and materials
The data used are reported in the manuscript tables. All original data are available from the author on request.
Authors’contributions
All research reported in this report was carried out by the author. The author read and approved the final manuscript.
Competing interests
The author declares that he has no competing interests.
Publisher’s Note
Springer Nature remains neutral with regard to jurisdictional claims in published maps and institutional affiliations.
Received: 16 May 2018 Accepted: 19 July 2018
References
Bassett WA, Shen AH, Bucknum M, Chou IM (1993) A new diamond cell for hydrothermal studies to 2.5 GPa and from -190°C to 1200°C. Rev Sci Instrum 64:2340–2345.https://doi.org/10.1063/1.1143931
Brawer SA, White WB (1975) Raman spectroscopic investigation of the structure of silicate glasses. I. The binary silicate glasses. J Chem Phys 63:2421–2432.
https://doi.org/10.1063/1.431671
Buckermann WA, Muller-Warmuth W, Frischat GH (1992) A further 29Si MAS NMR study on binary alkali silicate glasses. Glasstech Ber 65:18–21
Burchard M, Maresch WV, Fockenberg T, Doltsinis NL, Adeagbo WA (2011) Modelling high-pressure aqueous fluids in the system CaO-SiO2-H2O: a
comprehensive semi-empirical thermodynamic formalism. Eur J Mineral 23: 409–424.https://doi.org/10.1127/0935-1221/2011/0023-2106
Bureau H, Keppler H (1999) Complete miscibility between silicate melts and hydrous fluids in the upper mantle; experimental evidence and geochemical
implications. Earth Planet Sci Lett 165:187–196.https://doi.org/10.1016/ S0012-821X(98)00266-0
Cody GD, Mysen BO, Lee SK (2005) Structure vs. composition: a solid-state H-1 and Si-29 NMR study of quenched glasses along the Na2O-SiO2-H2O
join. Geochim Cosmochim Acta 69:2373–2384.https://doi.org/10.1016/j. gca.2004.11.012
Fockenberg T, Burchard M, Maresch VW (2006) Experimental determination of the solubility of natural wollastonite in pure water up to pressures of 5 GPa and at temperatures of 400-800 degrees C. Geochim Cosmochim Acta 70: 1796–1806.https://doi.org/10.1016/j.gca.2005.12.017
Kawamoto T, Kanzaki M, Mibe K, Matsukage KN, Ono S (2012) Separation of supercritical slab-fluids to form aqueous fluid and melt components in subduction zone magmatism. Proc Natl Acad Sci USA 109:18695–18700.
https://doi.org/10.1073/pnas.1207687109
Kennedy GC, Wasserburg GJ, Heard HC, Newton RC (1962) The upper three-phase region in the system SiO2-H2O. Am J Sci 260:501–521.https://doi.org/
10.2475/ajs.260.7.501
Kessel R, Schmidt MW, Ulmer P, Pettke T (2005) Trace element signature of subduction-zone fluids, melts and supercritical liquids at 120-180 km depth. Nature 437:724–727.https://doi.org/10.1038/nature03971
Kessel R, Ulmer P, Pettke T, Schmidt MW, Thompson AB (2004) A novel approach to determine high-pressure high-temperature fluid and melt compositions using diamond-trap experiments. Am Mineral 89:1078–1086
Manning CE (1994) The solubility of quartz in H2O in the lower crust and upper
mantle. Geochim Cosmochim Acta 58:4831–4840.https://doi.org/10.1016/ 0016-7037(94)90214-3
Manning CE (2004) The chemistry of subduction-zone fluids. Earth Planet Sci Lett 223:1–16.https://doi.org/10.1016/j.epsl.2004.04.030
Manning CE (2007) Solubility of corundum+kyanite in H2O at 700°C and 10 kbar:
evidence for Al-Si complexing at high pressure and temperature. Geofluids 7: 258–268.https://doi.org/10.1111/j.1468-8123.2007.00179.x
Manning CE, Boettcher S (1994) Rapid quench hydrothermal experiments at mantle pressures and temperatures. Am Mineral 79:1153–1158
McMillan PF, Wolf GH, Poe BT (1992) Vibrational spectroscopy of silicate liquids and glasses. Chem Geol 96:351–366. https://doi.org/10.1016/0009-2541(92)90064-C
Mibe K, Chou IM, Bassett WA (2008) In situ Raman spectroscopic investigation of the structure of subduction-zone fluids. J Geophys Res 113.https://doi.org/ 10.1029/2007jb005179
Mibe K, Kanzaki M, Kawamoto T, Matsukage KN, Fei Y, Ono S (2007) Second critical endpoint in the peridotite-H2O system. J Geophys Res 112.https://
doi.org/10.1029/2005JB004125
Mibe, K., Kawamoto, T., Matsukage, K.N., Fei, Y., and Ono, S. (2011) Slab melting versus slab dehydration in subduction-zone magmatism. Proc. Nat'l. Acad. Sci.https://doi.org/10.1073/pnas.1010968108
Mysen BO (2010) Structure of H2O-saturated peralkaline aluminosilicate melt and
coexisting aluminosilicate-saturated aqueous fluid determined in-situ to 800 C and 800 MPa. Geochim Cosmochim Acta 74:4123–4139.https://doi.org/10. 1016/j.gca.2010.04.024
Mysen BO (2012a) Silicate-COH melt and fluid structure, their physicochemical properties, and partitioning of nominally refractory oxides between melts and fluids. Lithos 148:228–246.https://doi.org/10.1016/j.lithos.2012.06.005
Mysen BO (2012b) High-pressure/-temperature titanium solution mechanisms in silicate-saturated aqueous fluids and hydrous silicate melts. Am Mineral 97: 1241–1251.https://doi.org/10.2138/am.2012.4084
Mysen BO (2015a) Carbon speciation in silicate-C-O-H as a function of redox conditions: an experimental study, in-situ to 1.7 GPa and 900°C. Am Mineral 100:872–882.https://doi.org/10.2138/am-2015-4976
Mysen BO (2015b) An in-situ experimental study of Zr4+transport capacity of water-rich fluids in the temperature and pressure range of the deep crust and upper mantle. Prog Earth Planet Sci 2(1):38.https://doi.org/10.1186/ s40645-015-0070-5
Mysen BO, Mibe K, Chou IM, Bassett WA (2013) Structure and equilibria among silicate species in aqueous fluids in the upper mantle: experimental SiO2-H2O
and MgO-SiO2-H2O data recorded in situ to 900 degrees C and 5.4GPa. J
Geophys Res 118:6076–6085.https://doi.org/10.1002/2013jb010537
Mysen BO, Richet P (2005) Silicate glasses and melts—properties and structure. Elsevier, New York, p 548
Newton RC, Manning CE (2002) Solubility of enstatite+forsterite in H2O in deep
crust/upper mantle conditions: 4 to 15 kbar and 700 to 900°C. Geochim Cosmochim Acta 66:4165–4176.https://doi.org/10.1016/S0016-7037(02)00998-5
Newton RC, Manning CE (2003) Activity coefficient and polymerization of aqueous silica at 800°C, 12 kbar, from solubility measurements and SiO2
-buffering mineral assemblages. Contrib Mineral Petrol 146:135–146.https:// doi.org/10.1007/s00410-003-0483-9
Newton RC, Manning CE (2009) Hydration state and activity of aqueous silica in H2O-CO2fluids at high pressure and temperature. Am Mineral 94:1287–1290.
https://doi.org/10.2138/am.2009.3287
Osborn EF, Muan A (1960) Plate 2. The system CaO-MgO-SiO2: phase equilibrium
diagrams of oxide systems. American Ceramic Society
Pitzer KS, Sterner SM (1994) Equations of state valid continuously from zero to extreme pressures for H2O and CO2. J Chem Phys 101:3111–3116.https://doi.
org/10.1063/1.467624
Ratcliffe CI, Irish DE (1982) Vibrational studies of solutions at elevated temperatures and pressures. 5. Raman studies of liquid water up to 300 °C. J Phys Chem 86:4897–4905.https://doi.org/10.1021/j100222a013
Stalder R, Ulmer P, Thompson AB, Gunther D (2001) High pressure fluids in the system MgO-SiO2-H2O under upper mantle conditions. Contrib Mineral
Petrol 140:607–618.https://doi.org/10.1007/s004100000212
Walrafen GE, Fisher MR, Hokmabadi MS, Yang WH (1986) Temperature dependence of the low- and high-frequency Raman scattering from liquid water. J Chem Phys 85:6970–6982.https://doi.org/10.1063/1.451384
Wilke M, Schmidt C, Dubrail J, Appel K, Borchert M, Kvashnina K, Manning CE (2012) Zircon solubility and zircon complexation in H2O+Na2O+SiO2±Al2O3
fluids at high pressure and temperature. Earth Planet Sci Lett 349-350:15–25.
https://doi.org/10.1016/j.epsl.2012.06.054
Zhang Y-G, Frantz JD (2000) Enstatite-forsterite-water equilibria at elevated temperatures and pressures. Am Mineral 85:918–925.https://doi.org/10.2138/ am-2000-0705
Zotov N, Keppler H (1998) The influence of water on the structure of hydrous sodium tetrasilicate glasses. Am Mineral 83:823–834