R E S E A R C H
Open Access
Performance, behaviour and organization
of maize trading in Malawi
Henry Kankwamba
1*and Lukas Kornher
2* Correspondence:hkankwamba@ gmail.com;[email protected]. mw
1
Department of Agricultural and Applied Economics, Lilongwe University of Agriculture and Natural Resources (LUANAR), Lilongwe, Malawi
Full list of author information is available at the end of the article
Abstract
Industry structure and social capital could affect traders, market performance and distribution of economic resources such as food. This study assesses the effect of industry structure and social capital on traders’profitability and resilience. We use Bayes Model Averaging regression techniques to draw inferences from a random,
representative and systematically selected sample of maize traders in the central region of Malawi. We complement our results with key informant prior information from industry experts and literature. Results indicate that at the local market level, few traders dominate but competition increases when we consider the entire district and region. Results also show that interaction with distant traders and brokers is associated with more profitable and resilient businesses. While we find evidence that social capital is positively associated with business profitability, results do not strongly support the hypothesis that other measures of social capital such as tribal and religious affiliation have an effect on traders’resilience. Noteworthy, as the unit of closeness among traders decreases to family ties, profits tend to increase. This suggests a more group and kin selective evolutionary stable strategy among maize traders.
Keywords:Profitability, Social capital, Resilience, Bayesian regression, Herfindahl Index, Maize traders, Kin selection
Introduction
Industry structure can alter competitiveness and growth prospects of most sectors in an economy. Emergence of highly concentrated industries may deter new entrants and may lead to inefficient allocation of resources in the market (Poulton et al.2006; Porto et al. 2011; Sexton and Xia2018). Highly concentrated markets might not be particu-larly good for food commodities especially when commodities are heavily consumed by the poor. Concentration can drive out small firms, scare potential investors and ex-acerbate avoidable crises (Sexton and Xia2018).
Few studies have been conducted to document and assess the complex relationship between food industry structure, traders’productivity, performance, resilience and the role of institutions of developing economies. For example, Sitko et al. (2018) found no evidence of market concentration when large firms entered into smallholder grain markets but rather found that the retail prices of grain declined due to improved mar-ket efficiency. Gabre-Madhin (2001), using a new institutional economics perspective, assessed market institutions, transaction costs, and social capital in the Ethiopian grain market and found that social capital enhances trader productivity. Further, Fafchamps
© The Author(s). 2019Open AccessThis article is distributed under the terms of the Creative Commons Attribution 4.0 International
License (http://creativecommons.org/licenses/by/4.0/), which permits unrestricted use, distribution, and reproduction in any medium,
and Minten (2001), using survey data from traders in Madagascar, found high large so-cial capital effects on firm productivity.
We define social capital as the structure of informal social relationships conducive to developing cooperation among economic actors aimed at increasing the social product. The social product is then expected to accrue to the group of people embedded in those relationships (Hayami2009). Social capital among traders may help reduce trans-action costs if traders interact more over longer periods of time (Fafchamps and Min-ten 2001). However, such interactions may also affect efficiency outcomes as markets may become dominated by small groups of traders that are well acquainted.
Using structural, relational and cognitive indicators for social capital, most literature from developed countries suggest a positive association between social capital and busi-ness performance (see Islam et al.2018; Liu and Li2018; García-Villaverde et al.2018; Miao et al. 2017). To illustrate, Islam et al. (2018) found that cognitive ability, educa-tion, experience and the number of connections a manager possessed had a positive in-fluence on a cooperative’s performance. Further, Miao et al. (2017) assessed the effect of social capital and business performance and found that the link between social cap-ital and performance is mediated by human capcap-ital—education and skills of employees and entrepreneurial orientation which is the strategic, philosophical and behaviours in decision-making—of the trader. In a similar manner, Asiaei and Jusoh (2015) indicated that relational and social capital improve business performance.
Further, other literature asserts that productivity, specifically profits, may be reduced if traders trade and interact with close relatives. For example, Levine et al. (2014) re-ported that ethnic proximity of traders may promote price bubbles and thereby bring about undesirable market outcomes such as market inefficiency. In addition, Atmadja et al. (2016) found that firms that are run by ethnically cohesive individuals perform poorly on indicators such as profitability and survivability—i.e. resilience measured as time in years a business stays profitable before closure. However, de Oliveira and Nis-bett (2018) argue that there may not be much differences in outcomes from ethnically diverse groups than homogenous groups. In addition, Portes (2014) argued that social capital might drive marginalism such that individuals without significant social capital may be ostracized, face significant barriers to growth and eventually be left out of eco-nomic systems. This becomes particularly difficult when the individuals are poor traders in developing countries. To a greater extent, the link between business perform-ance and behavioural aspects of traders such as social capital and informal arrange-ments such as trust relationships provide mixed evidence (Van Rijn et al. 2012). Interestingly, in Africa, where most staple food microenterprises, and therefore the transactions therein, are informal do not feature much in the debate on social capital versus business performance. As such, it is important to explore the role and implica-tions of social capital on such economic outcomes.
family relations to get information regarding the structure of social networks which might have a bearing on the nature of transaction costs. Further, the study also uses key informant interviews, focused observations and group discussions with industry representatives, grain traders’associations and farmer associations. We hypothesize that traders who interact more with other traders, brokers and lenders will have more resili-ent and profitable businesses. To test our hypothesis, we econometrically analysed the data using Bayes Model Averaging (BMA) regression techniques. BMA analysis reduces model uncertainty by taking advantage of the posterior probability distributions of all competing model parameters conditional on the observed data and some prior know-ledge (see Hoeting et al. 1999; Genell et al. 2010; Laffineur et al. 2017). In this study, we are able to use the sample data together with prior knowledge gathered from key in-formants and available literature to draw inferences about the organization of maize markets and the behaviour of maize traders.
The study contributes to the literature on understanding drivers of business resili-ence, food policy design and industrial organization by bringing recent evidence from a developing country’s staple food industry and also complementing and triangulating sults from methodologically different viewpoints namely qualitative and Bayesian re-gression analysis. This would make our interpretation of results particularly rich and highly informative.
We find two consistent results that social capital enhances business resilience and that not all forms of social capital make maize trading profitable but when traders are very close, even to family ties, profits increase.
The rest of the paper is structured as follows. We explain how we conducted the study in“Materials and methods”. In "Results" we present our key findings starting with descriptive and later inferential statistics. We expound our findings and their implica-tions in "Discussion". We provide a summary in "Conclusion".
Materials and methods
Study area
The study was carried out in the central region of Malawi. The central region has nine administrative districts, which have a comparative advantage for producing maize, the country’s staple food (Chirwa2007). In as much as the whole country trades in maize, the majority of maize traders are situated in the central region (Messina et al. 2017). Second, the region is logistically cost effective to the study since it contains most of the traders and other stakeholders.
Sampling, data and variables
Before drawing the sample we obtained a list of markets that are followed by the Ministry of Agriculture and Food Security’s Agricultural Statistical Bulletin. From that list, we picked historical central markets—i.e. markets that had consistent price and commodity series. We obtained numbered list of traders in a given market from market authorities and listed them in ascending order. In the case where the market did not have a list of traders, we conducted a linear listing of the traders—usually traders sell-ing maize are arranged in a line and obtainsell-ing a list was simply done by obtainsell-ing their names and assigning numbers to them. Using the lists, the first trader in the survey was picked using simple random sampling while the second to the nth trader was picked using systematic random sampling by counting the next 3 traders—where the number three was chosen arbitrarily. For each of the markets j =1,…,kcontainingi =1,
…,n traders, we draw a systematic sample without replacement and calculate a market mean, of say profit or resilience—survivability, asysys¼
P
yij=njsuch that our system-atic sampling mean is Y ¼1
k
Pk
j¼1ysys. The systematic sampling variance is then calcu-lated asS2¼ 1
kðn−1Þ
Pn
i¼1
Pk
j¼1ðyij−yjÞ
2
(Cochran1985p. 207).
The key sources of expert and secondary information were the Ministry of Agricul-ture and Food Security’s (MoAFS) Department of Agricultural Planning Services (DAPS), where we obtained information on historical prices using their Agricultural Statistical Bulletin. We also obtained information on gross margins and average prices from the Department of Agricultural Extension Services (DAES). The second prior data source was the Malawi Strategy Support Program (MASSP) of the International Food Policy Research Institute (IFPRI) where we interviewed the IFPRI team of experts. The IFPRI team provided monthly prices summarized in the form of policy briefs (MASSP
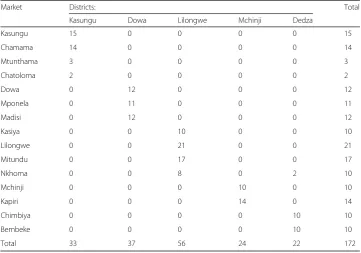
2018) and indicated their availability for clarifications. We also interviewed other players in the maize marketing industry such as the National Food Reserve Agency (NFRA) and prominent traders. Results of the sampled markets and their respective sample sizes are summarized in Table1.
During the study, we also used simple ethnographic data collection techniques namely: participant observation (see Junker 1960) in which we went to the market and observed market transactions to clarify questions and get accustomed to different mar-ket environments. The study also used key informant interviews (Adler and Adler
2003) with industry experts where we asked questions about the structure and conduct of the market. This way, we obtained qualitative and quantitative prior information. For instance, we asked different experts about average prices, quantities and by how much the averages might deviate. The information is summarized in Table2.
Theoretical framework
Traders in our study act strategically and mostly own micro-enterprises, have capacity constraints. As such, we treat them from a game theoretic perspective (Reny and Perry
2006). To simplify, a trader interacts with other neighbouring traders in a Cournot stra-tegic game (Abbink et al. 2011). All traders trade in a homogeneous commodity i.e. maize. We assume that trader (i) produces output qi while trader(j) produces output
qj. Thus, for all markets in the sample (see Table 1), there exists total market output
We further assume that each trader maximizes their profits. For example, firm (i) maximizes its profits
maxπi¼p Qð Þqi−ci qð Þi i¼1;…;n ð1Þ
Thus, for trader (i), profitability is clearly dependent on trader (j)’s output on the market. Thus, assuming that eq. 1 is continuous and twice differentiable, an interior optimum for each trader, the Cournot-Nash equilibrium must satisfy the following first-order necessary conditions
Dqiπi¼p Qð Þ þp 0
Q
ð Þqi−c
0
ið Þ ¼qi 0 ð2Þ
The second-order conditions are
D2qiπi¼2p
0
Q
ð Þ þp00ð ÞQqi−c
00
qi
ð Þ<0; i¼1;…;n ð3Þ
Okuguchi (1993) provided axioms namely p′+p′′qi< 0 and p
0
<C0i0 to ensure that the second-order sufficient conditions are less than zero.
In order to determine how trader (j) might react we should differentiate the first-order conditions with respect toqj. Thus,
f0i qj ¼
D2π
i=Dqi
D2πi=D2i
ð4Þ
Considering that both traders trade in a homogeneous commodity, we assume that
the sign for f0iðqjÞwill be negative implying that the competitor will want to strategic-ally substitute trader (i). In a once off trading occasion, the trade will take the form of a classic Prisoners’Dilemma where the optimal strategy would be to defect.
Table 1Distribution of sampled observations across markets and districts
Market Districts: Total
Kasungu Dowa Lilongwe Mchinji Dedza
Kasungu 15 0 0 0 0 15
Chamama 14 0 0 0 0 14
Mtunthama 3 0 0 0 0 3
Chatoloma 2 0 0 0 0 2
Dowa 0 12 0 0 0 12
Mponela 0 11 0 0 0 11
Madisi 0 12 0 0 0 12
Kasiya 0 0 10 0 0 10
Lilongwe 0 0 21 0 0 21
Mitundu 0 0 17 0 0 17
Nkhoma 0 0 8 0 2 10
Mchinji 0 0 0 10 0 10
Kapiri 0 0 0 14 0 14
Chimbiya 0 0 0 0 10 10
Bembeke 0 0 0 0 10 10
Traders do not play one-off stage games. They interact repeatedly. In a repeated game, the output of choice for traderiin timetis given byqit=fi(qj)t−1and profits will
be πit=δtπit where δ is a discount factor to measure the patience of the trader. The
Nash reversion folk theorem states that given a strategy profile in an infinitely repeated game, where the end game reverts to a Nash equilibrium as is the one-off stage game, then each player’s strategy is to play a consistent outcome until someone finally defects (see Mas-Collel and Green 1995pp. 417). That is, with learning effects, market
Table 2Key variables used in the analysis and prior elicited information
Variable Description Prior source Mean (SD)
Maize prices Prevailing price of maize (MK/kg) MoAFS, IFPRI, ADMARC 35 (25)
Profit Price Cost Margin (PCM) (MK/kg) MoAFS, IFPRI, market chairperson
25 (12)
Trader is male Proportion of traders who are male Observation .75 (.20)
Registered business
Whether business was registered MRA, market chairperson, MCCCI
.20 (.10)
Export licence Whether the business has an export licence MCCCI, market chairperson .05 (.03)
No. trader Number of traders in the market District council, observation 28 (17)
Asset replacement
Frequency of asset replacement – Flat
Search time Time spent searching for market information (minutes)
120 (60)
No. family Number of family members in maize business – Flat
Business age Age of the business MCCCI, trader 5 (10)
Coverage Geographical coverage of the business Trader, market chairperson 15 (8)
No. friends Number of friends in maize business – flat
No. regional traders
Number of regional traders interacted with Market chairperson 5 (3)
No. district traders
Number of district traders interacted with Market chairperson 12 (5)
Experience broker
Experience interacting with brokers (years) Market chairperson, brokers 5 (6)
Religion Religious affiliation of the trader Market chairperson
Christian Catholic 25 (10)
Christian Protestant
35 (10)
Islam 10 (5)
African religion African religion and others 5 (2)
Trader tribe Tribe and mother tongue of the traders Traders, market chairperson
Chichewa .74 (.12)
Chiyao .15 (.05)
Chilomwe .10 (.05)
Chisena .01 (.01)
The term mean and standard deviation (SD) are obtained from industry experts
MoAFS= Ministry of Agriculture and Food Security, Malawi Government. The Ministry name changes from time to time
IFPRI= International Food Policy Research Institute (Malawi Strategy Support Program)
ADMARC= Agricultural Development and Marketing Corporation. A government parastatal
MCCCI= Malawi Confederation of Chambers of Commerce and Industry. A private sector representative mother body
MRA= Malawi Revenue Authority. Malawi’s Tax Agency.
Market chairperson/trader = an individual who is elected by fellow traders to coordinate affairs of a given market
outcomes can improve since traders will learn the others’reaction functions and play consistent strategies.
Proposition: Social capital is a parameter that is associated with the trader’s profit function. Thus, the accumulation of social capital will affect profitability.
Proof: Considering the traders’ first-order conditions and ω, a social capital param-eter, we can present the stationarity conditions as
Dqi qið Þωi ;qj ωj
h i
¼0 ð5Þ
In order to examine the impact of social capital, we take the derivative with respect toω. That is,
D2qi D
2
qi;qjπi
D2qj;qiπj D
2
qi !
Dωqi
Dωqj
¼ D2qi;qjπi 0
;∀i≠j: ð6Þ
So using Crammer’s rule, the impact of social capital on a firm’s performance can be quantified as
Dωq1¼ D2q
i;ωπi D
2
qi;qjπi 0 Dqjπj
Dq1;ωπ1 D2πj Dq1q
jπj D
2
q2 jπj
: ð7Þ
It quantifies the effect of a change in social capital on firm’s quantity supplied on the market—a direct measure of industry share which is a function of arguments from profits from firm 1 and 2 and their respective reaction functions. We learn two things from this quantity. First, if the traders only met once, then it would make sense for them to use defective strategies, making the D2q1,ωπ1 quantity negative as it would
make one firm take advantage to maximize its own profit at the expense of the other. Resultant, the other firm would also play a similar move. Second, if traders would re-peatedly interact in the market, and the equilibrium is mutually beneficial (Dal Bó and Fréchette2011), there could be an evolution of cooperation which could foster learning effects and eventually firm and market performance would increase. It would be opti-mal for players to play cooperatively and it would be punishable to play defective strat-egies. Although this seems intuitive, in real life, less optimal outcomes are also possible as people make mistakes. In our study, we do not preclude the existence of a trader making a mistake in decision-making.
them out in the form of a loan or a mere handout. However, we also take note of Levine et al. (2014) observation that ethnic diversity could also lead to better market outcomes. We thus, use different indicators of cooperation in traders interactions, namely (1) kin selection, where individual traders interact more with genetically related individuals; (2) group selection, where individuals would interact more among friends doing similar kind of trade and; (3) direct reciprocity where at first, we observe how firms run as sole trading entities perform and survive. We also group the traders in ethnicity terms to observe how one ethnic group operates against another in direct reciprocity (Trivers1971).
Estimation
Considering that we used two sources of data namely trader survey and key informant interviews, it is ideal to bring the two data sets together in the process of drawing infer-ence about the population parameters. For a start, our key informants i.e. key industry experts, few handpicked traders and government personnel informed us about the dis-tribution of the parameters. We use this prior knowledge to complement the survey data in the estimation process of the posterior distribution of parameters and their 95% credible intervals. We thus use Bayesian normal regression techniques to assess the ef-fects of social capital, on firm profitability and resilience. Our basic regression frame-work is presented as
Yijd¼βijdXþγjþδdþλtþϵijd: ð8Þ
whereYis then× 1 vector of natural logarithm of profits of trader or firmiin market
j and districtd. The variable Xijd is ann×mvector of independent variables that
ex-plain the variation in Yijd. The quantity βijdis an m× 1 vector of unknown parameters
of the explanatory variables,γjis an unknown market-specific fixed effect whileδdand λare a district and seasonal specific fixed effect.
During data collection period, we obtained prior information on the historical esti-mates, behaviour and structure of the market. This prior information can be useful in estimating the model parameters and reducing uncertainty. To further reduce the level of uncertainty, we use Bayes Model Averaging (BMA) estimator (Hoeting et al. 1999) with market- and district-specific fixed effects. Considering the lack of extensive litera-ture on small businesses in Malawi, building an accurate model of business profitability in the context of geographic, social institutional and physical capital could be challen-ging. Thus, given the context, there are many, i.e. the model space isM = 2mwherem
∈ M, competing models that can be estimated from the given variables. Therefore, fit-ting one Ordinary Least Squares regression model could result in high measurement and specification errors when expert knowledge is limited and sample sizes are small (Genell et al.2010). BMA fits a regression of the form
Yijd¼βijd X−X
þγjþδdþλtþϵijd: ð9Þ
where the unconditional BMA results’βijdare weighted average parameters conditional
^
βijd¼E βijdjYijd
¼XMm¼1τm^βm: ð10Þ
Using Bayes’theorem, we estimate the posterior probability distribution as
τm¼p Mð jDataÞ ¼ P Mð mÞ p
DatajMm
ð Þ
R2m
m¼1P Mð mÞ pðDatajMmÞ
ð11Þ
such that p(Mm) is the prior probability distribution of model m while p(Data|Mm) is
the marginal likelihood distribution of the data given the model Mmwhere the model
space is Msuch thatm∈M(Madigan and Raftery1994; Laffineur et al.2017). We use R statistical package BAS (Bayesian Variable Selection and Model Averaging using Adaptive Sampling)—which samples the models without replacement and outperforms Markov Chain Monte Carlo frameworks (Clyde et al.2011) to estimate the final poster-ior parameters.
Industry structure
We used the Herfindahl- Hirschmann Index (HHI) to assess market concentration. The HHI assesses the structure of the market through the lenses of market competi-tiveness by measuring the size of the firm relative to the size of the industry. Using two indicators namely value of operating capital and volume of commodities that the firm handles per month, we computed the HHI as
HHI ¼Xni¼1s2iwheresi¼1=N ð12Þ
where N is the total number of firms in the industry. When the HHI is 0.01 or less, then the market is competitive; when HHI is 0.15 it is unconcentrated; when HHI is between 0.15 and 0.25, the market is moderately concentrated while an HHI of 0.25 and above signifies a concentrated industry. We estimate market, district and regional HHI indicators. However, in the regression estimation, we use the log of the share as an indicator of industry size.
As a qualitative measure of industry size, we used a count of traders in the market. A larger number of traders was considered to be a competitive market while when there are very few traders, then the market is less competitive.
Results
Descriptive statistics
Table2summarizes variable descriptions and results of the prior expert information elicited through the qualitative data collection techniques. The data obtained complements the sur-vey data estimates and are later used in the Bayesian estimation. In general, results closely match the data such that we can safely deduce that the prior has similar distributions.
an export licence. Further, traders reported that a market contained between 7 and 54 maize traders.
Considering the three dimensions of social capital namely (1) closeness with family members and ethnically similar individuals; (2) closeness with traders in the vicinity and (3) interaction with distant traders. On similarity between individuals, we used tribe and religion as indicators closeness. Results indicate that 15% of the traders were Roman Catholic; 65% were Protestant; 14% Muslim and 5% either had no religion or practised other religions. Results further show that 92% of traders are of the Chewa tribe while 4% are Yao and Lomwe, respectively. Less than 1% of the traders are of the Sena tribe. On average, one member of the family, usually (self ) participated in maize trade with a range of 7 members. The average trader reported that they had 6 close friends who they interacted closely within the maize trading business.
Results indicate that a trader interacted most with 12 traders within the region and 9 distant traders. Results also show that a trader interacted with 4 brokers in the market.
Whether the business was registered or not is of fundamental importance in deter-mining performance and resilience. Results indicate that 78% of the business were not
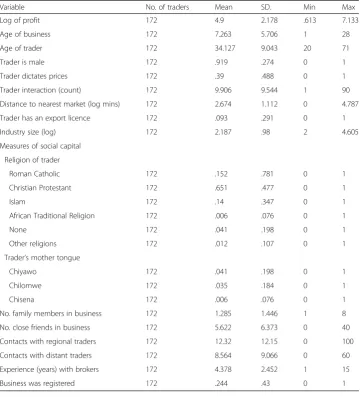
Table 3Descriptive statistics of key variables used in the study
Variable No. of traders Mean SD. Min Max
Log of profit 172 4.9 2.178 .613 7.133
Age of business 172 7.263 5.706 1 28
Age of trader 172 34.127 9.043 20 71
Trader is male 172 .919 .274 0 1
Trader dictates prices 172 .39 .488 0 1
Trader interaction (count) 172 9.906 9.544 1 90
Distance to nearest market (log mins) 172 2.674 1.112 0 4.787
Trader has an export licence 172 .093 .291 0 1
Industry size (log) 172 2.187 .98 2 4.605
Measures of social capital
Religion of trader
Roman Catholic 172 .152 .781 0 1
Christian Protestant 172 .651 .477 0 1
Islam 172 .14 .347 0 1
African Traditional Religion 172 .006 .076 0 1
None 172 .041 .198 0 1
Other religions 172 .012 .107 0 1
Trader’s mother tongue
Chiyawo 172 .041 .198 0 1
Chilomwe 172 .035 .184 0 1
Chisena 172 .006 .076 0 1
No. family members in business 172 1.285 1.446 1 8
No. close friends in business 172 5.622 6.373 0 40
Contacts with regional traders 172 12.32 12.15 0 100
Contacts with distant traders 172 8.564 9.066 0 60
Experience (years) with brokers 172 4.378 2.452 1 15
registered. The mean age for registered businesses was 9.32 years with a standard devi-ation of 0.89 years while for unregistered businesses was 6.58 years with a standard error of 0.41 years. Though the samples are unequal, attest (t= 3) indicates that regis-tered businesses tend to stay 3 years longer than unregisregis-tered businesses. These results are statistically significant at 1% significance level.
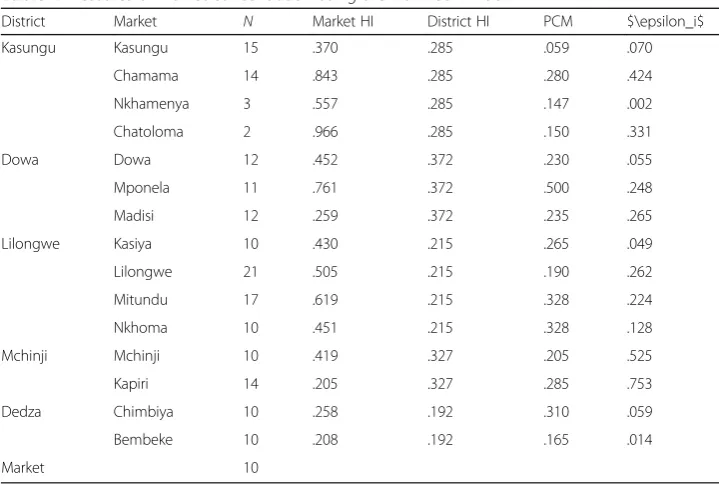
Industry structure
Table 4summarizes results of the HHI. Of note, the value of the HHI decreases as we move from an individual market to district and eventually regional level measure of concentration. Results indicate that at the local market, the level of market concentra-tion is 47%. This HHI value is greater than 25% which indicates that at the market level, maize markets do not operate in perfect competition. Thus, in order to analyse the data at the market level, a model that accounts for strategic interactions among traders is necessary. Similarly, the district level HHI is 28%, computed by accounting for all markets within the district in question, is also larger than the 28% value— indi-cating that the maize market is also concentrated at the district level.
Noteworthy, Kapiri market in Mchinji District and Bembeke market in Dedza District had the lowest HHI equal to 0.205 and 0.208, respectively. The HHI values fall within the range of 0.15 and 0.25 which indicates that these markets were moderately concen-trated—meaning that the small firms in the market were altogether operating in oligop-olistic competition. Thus, the Cournot theoretical framework is appropriate for analysing strategic behaviour of the firms. Market level HHIs for the rest of the markets are above 0.25 and are unambiguously concentrated. Importantly, markets that had lower concentration levels lead to much lower concentration values at the district level. Of note, Lilongwe District markets had higher levels of concentration at the market
Table 4Measures of market concentration using the Herfindahl Index
District Market N Market HI District HI PCM $\epsilon_i$
Kasungu Kasungu 15 .370 .285 .059 .070
Chamama 14 .843 .285 .280 .424
Nkhamenya 3 .557 .285 .147 .002
Chatoloma 2 .966 .285 .150 .331
Dowa Dowa 12 .452 .372 .230 .055
Mponela 11 .761 .372 .500 .248
Madisi 12 .259 .372 .235 .265
Lilongwe Kasiya 10 .430 .215 .265 .049
Lilongwe 21 .505 .215 .190 .262
Mitundu 17 .619 .215 .328 .224
Nkhoma 10 .451 .215 .328 .128
Mchinji Mchinji 10 .419 .327 .205 .525
Kapiri 14 .205 .327 .285 .753
Dedza Chimbiya 10 .258 .192 .310 .059
Bembeke 10 .208 .192 .165 .014
Market 10
PCM = [(Sales revenue−Variable costs)/Sales revenue]si= market share calculated as cumulative maize quantity supplied
level, but when the analysis was moved to the district level, the industry became mod-erately concentrated. At regional level i.e. the full sample, the data shows that the in-dustry is in perfect competition. That is, it has HHI values between 0.15 and 0.25.
Results in Table 4 also present price-cost margins (PCM)—a ratio of the difference between sales and variable costs by sales (Aiginger 1996). Results indicate that traders located in larger trading centres have lower PCM. For instance, Kasungu town market had PCM of 6% while Mponela township had 5%. Nkhoma market, a trading centre just outside Lilongwe city, had the highest PCM of 33%. Overall, the average industry PCM was 19%.
Generally, the price elasticity of demand for maize across the markets was less than unitary i.e. 1% change in the price of maize would result in a less than unitary change in the quantity of maize demanded holding other factors constant.
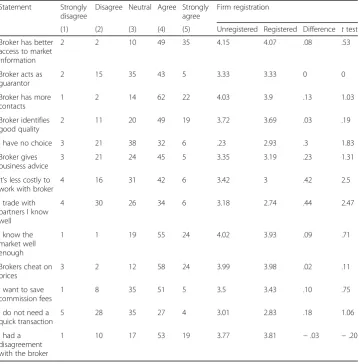
Behaviour among traders
As an indicator of social capital, trader norms and behaviour, we assessed traders’ per-ceptions regarding how they relate with brokers and other traders (Table5). Results in-dicate that there is a general consensus that brokers have better access to market information. We failed to reject the hypothesis that there is a difference in perception between registered traders and unregistered traders. Further, respondents were neutral when asked about whether the broker acts as their guarantor or not. Results for this question were also not statistically significant implying that traders were not aware that a broker can sometimes act as a guarantor on some loans. Further, results indicate a general agreement that the broker has more contacts.
We also find a general consensus that brokers identify good quality maize. There was also an agreement that sometimes traders have no choice but to sell through brokers. There was also a consensus that brokers give business advice. Over 42% of traders in the sample agree that it is less costly to work with brokers. However, when disaggre-gated by business registration, we find that unregistered traders are more agreeable to the statement than registered traders who were more neutral. Registered traders neu-trality might indicate that registered traders incur some costs making it difficult judging right away whether they agree or disagree.
Further, 34% of the respondents indicated that they agree that they trade with traders and brokers that they know well. When disaggregated by business registration, we find that registered businesses formed a consensus disagreeing with the statement. The dif-ference in opinion was statistically significant at 5%. This implies that traders that are registered are more likely to trade with traders or brokers that are less familiar to them. Another 55% of respondents reported that they know the market well enough. There is a consensus that brokers cheat on prices. Further, 51% of the respondents do not con-sult brokers because they want to save commission fees. Further, 35% of the traders in the sample reported that they do not need a quick transaction to require a broker.
The role of social capital in determining business performance
and the probability that the posterior mean is not equal to zero i.e.p(β≠0).The model is presented in columns 1 to 3. Second, we present a Bayesian model with reference priors in columns 4 to 6. This model uses information from the sample to compute posterior probabilities. In the event that our informative priors are misleading, this model acts as an objective robustness check. Third, we used an Ordinary Least Squares regression model with bootstrapped standard errors replicated 1000 times in columns 7 to 9. Using a frequentist approach with highly conservative standard errors compared to those produced by normal OLS ensures that the precision of our estimates is based on actual variation in the information from the sample and not just chance. The boot-strapped model also shows the level of bias associated with the resampling. In the in-formative prior model, we used a normally distributed prior with mean 12.65 and the model variance from the sample to estimate the posterior distribution of parameters using 20000 Monte-Carlo Markov Chain (MCMC) simulations.
Results indicate that registered businesses were 83% more profitable than unregis-tered ones. Further, traders that possessed export licences were twice more profitable. If a trader ran other businesses apart from the current grain trading, it resulted in 4% more profits in the maize grain trading business. Results further show that traders who
Table 5Perceptions of traders’interactions with brokers and other traders. Percentages are
reported in the Likert Scale andttest is used to assess differences in perceptions between firms that were registered and those that were not
Statement Strongly disagree
Disagree Neutral Agree Strongly agree
Firm registration
(1) (2) (3) (4) (5) Unregistered Registered Difference ttest
Broker has better access to market information
2 2 10 49 35 4.15 4.07 .08 .53
Broker acts as guarantor
2 15 35 43 5 3.33 3.33 0 0
Broker has more contacts
1 2 14 62 22 4.03 3.9 .13 1.03
Broker identifies good quality
2 11 20 49 19 3.72 3.69 .03 .19
I have no choice 3 21 38 32 6 .23 2.93 .3 1.83
Broker gives business advice
3 21 24 45 5 3.35 3.19 .23 1.31
It’s less costly to work with broker
4 16 31 42 6 3.42 3 .42 2.5
I trade with partners I know well
4 30 26 34 6 3.18 2.74 .44 2.47
I know the market well enough
1 1 19 55 24 4.02 3.93 .09 .71
Brokers cheat on prices
3 2 12 58 24 3.99 3.98 .02 .11
I want to save commission fees
1 8 35 51 5 3.5 3.43 .10 .75
I do not need a quick transaction
5 28 35 27 4 3.01 2.83 .18 1.06
I had a disagreement with the broker
participated in many marketing functions had profits, which were lower by a factor of 1.3 than traders who consistently performed one marketing function. Traders that were com-bining multiple functions were mostly small and itinerant with capacity and credit constraints.
We also find that male traders were twice more profitable than female-ran busi-nesses. The number of close family relatives is associated with 40% more profits. We found that traders who were innovative in changing assets and trying new technologies during trading realized 37% profitable businesses. Results indicate that the larger the geographical coverage of the business, the more profitable the business i.e. 1% increase in geographical coverage resulted is 36% increase in profits. As far as social capital is concerned, we found that the more the trader interacts with traders within the same district but from other distant markets, the more profitable the business is—1%
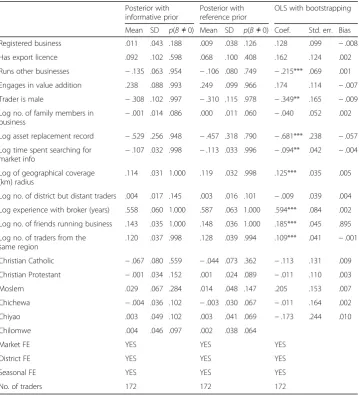
Table 7Determinants of maize traders’business resilience in Malawi
Posterior with informative prior
Posterior with reference prior
OLS with bootstrapping
Mean SD p(B≠0) Mean SD p(B≠0) Coef. Std. err. Bias
Registered business .011 .043 .188 .009 .038 .126 .128 .099 −.008
Has export licence .092 .102 .598 .068 .100 .408 .162 .124 .002
Runs other businesses −.135 .063 .954 −.106 .080 .749 −.215*** .069 .001
Engages in value addition .238 .088 .993 .249 .099 .966 .174 .114 −.007
Trader is male −.308 .102 .997 −.310 .115 .978 −.349** .165 −.009
Log no. of family members in
business −
.001 .014 .086 .000 .011 .060 −.040 .052 .002
Log asset replacement record −.529 .256 .948 −.457 .318 .790 −.681*** .238 −.057
Log time spent searching for
market info −
.107 .032 .998 −.113 .033 .996 −.094** .042 −.004
Log of geographical coverage (km) radius
.114 .031 1.000 .119 .032 .998 .125*** .035 .005
Log no. of district but distant traders .004 .017 .145 .003 .016 .101 −.009 .039 .004
Log experience with broker (years) .558 .060 1.000 .587 .063 1.000 .594*** .084 .002
Log no. of friends running business .143 .035 1.000 .148 .036 1.000 .185*** .045 .895
Log no. of traders from the same region
.120 .037 .998 .128 .039 .994 .109*** .041 −.001
Christian Catholic −.067 .080 .559 −.044 .073 .362 −.113 .131 .009
Christian Protestant −.001 .034 .152 .001 .024 .089 −.011 .110 .003
Moslem .029 .067 .284 .014 .048 .147 .205 .153 .007
Chichewa −.004 .036 .102 −.003 .030 .067 −.011 .164 .002
Chiyao .003 .049 .102 .003 .041 .069 −.173 .244 .010
Chilomwe .004 .046 .097 .002 .038 .064
Market FE YES YES YES
District FE YES YES YES
Seasonal FE YES YES YES
No. of traders 172 172 172
Dependent variable is log of age of the business
SD= standard deviation
Baseline for religion is no religion while Chisena is for trader tribe *Significantly different from zero at 90% confidence
increase in interactions resulted in 63% increase in profits. We found higher posterior probabilities that the other measures of social capital such as religion and tribe of the trader have significant effects on profitability.
The role of social capital in business resilience
Taking age of the business as an indicator of business survivability and resilience (Atmadja et al. 2016), in Table7 we estimated a model of key success factors of busi-ness resilience. We used a normally distributed prior with mean 1.6 and the model vari-ance from the sample to estimate the posterior distribution of parameters using 20000 Monte-Carlo Markov Chain (MCMC) simulations.
Results of the BMA regression model indicate that if a trader has an export licence, it is associated with 9% increase in business resilience. Further, if the business holds other forms of business apart from grain trading, it is associated with a 15% increase in busi-ness resilience. Traders that engage in multiple marketing functions are associated with 11% increase in profitability. A male trader is associated with 30% reduction in business resilience. Traders that often replace assets and actively innovate are associated with 11% increase in business resilience. Traders that spent more time searching for market information are associated with a 53% reduction in business resilience. Traders that have a wide geographical coverage are associated with 11% increase in business resili-ence. In addition, a 1% increase in friends running grain trading business results in 14% increase in business resilience. Further, a 1% increase in experience with brokers results in 56% increase in business resilience. When the trader increases interactions with dis-tant traders within the region by 1%, business resilience increases by 12%.
Discussion
In this study we analysed effects of social capital, industry size and firm performance in the maize sub-sector in Malawi. Our results explain three important findings. First, trader and industry characteristics shape business performance and resilience. Second, the complex nature of business performance and resilience can be explained by unpacking trader characteristics, closeness and wider social interactions.
Our results show that trader and industry characteristics influence profitability and resilience of traders businesses in the maize subsector. First, we found that registered traders were more profitable than unregistered ones. For example, in order for firms to sell to large agencies such as the National Food Reserve Agency (NFRA), they are re-quired to register their businesses. Having a registered business therefore guarantees that the trader can access most lucrative markets (McKenzie and Sakho 2010). On the other hand, unregistered businesses tend to have a narrow base for expanding their business and profitability as they are usually credit constrained—this observation is consistent with Fafchamps and Minten (2001) who found a positive association be-tween formality and performance in Brazil.
trader welfare issues are usually discussed in such groups. This kind of organization could lead to possibilities for collusion (Varian 2014; Mas-Collel and Green1995). Our results are in stark contrast with (Cai and Szeidl 2016) who found that when firms interact, performance increases. However, their finding was based on a sample that had larger businesses while this study was based on a sample of smaller businesses. Note-worthy, in support of our result, Levine et al. (2014) explain that when firms interact, it leads to collusion, which might end up creating price bubbles that eventually depress industry profits. Based on our findings, we subscribe to Levine et al. (2014)’s explan-ation that at community market, where traders know each other, they can collude to set prices and therefore create price bubbles which might eventually lower community welfare as consumers would be buying an inefficiently priced maize grain. Of note, in Zambia, Sitko et al. (2018) found that market entry of bigger traders increased market performance by decreasing market prices through improved market information chan-nels and high levels of investment.
We find that social capital exerts influence in shaping business resilience. For instance, results show that traders operating within the same market and district experience an increase in business resilience. We also find that close ties with family members when running the business encourages business resilience. Our results are in agreement with the findings of Islam et al. (2018); Liu and Li (2018); Madigan and Raftery (1994) who found that social capital and business performance and resilience are highly correlated. Our results are not in agree-ment with Portes (2014) who indicated that such closeness might reduce the business into a large family safety net on which family members use the firm’s resources to the detriment of the business performance. Rather, we find that traders who interact a lot with friends and distant traders have more resilient businesses.
Our results support the narrative that social capital leads to businesses that are more resilient, they also provide support for business performance. We find strong posterior probabilities that the association between firm performance and closeness with friends, religiously affiliated and ethnically close traders in the maize business is not equal to zero. Our results also strongly support other no-tions of social capital such as the number of family members in the business. Family members, as Portes (2014) observed would assist in supporting the busi-ness with capital and also providing human resources. This might explain the positive outcomes.
Conclusion
This study assessed effects of social capital, industry structure on performance and re-silience of the firm. Results show that characteristics of the industry namely industry size, market concentration, proportion of registered firms, and proportions of firms having export licences affect both firm performance and resilience. Second, results indi-cate that ethnically close traders operating within the same area tend to have more pro-ductive businesses. In evolutionary game theory, this suggests strong group and kin selection. On the other hand, results showed that group selection prevails as a domin-ant strategy in building business resilience as close association with friends in the busi-ness led to a more resilient busibusi-ness. In order to foster better busibusi-ness performance and resilience, efforts should be put in place to account for social capital arrangements and industry characteristics.
Acknowledgements
The authors would like to acknowledge Prof. Dr. Dr. h.c. Joachim von Braun for his guidance during the development of this study; Dr. Nicolas Gerber for discussing the data collection tools, the enumerators and traders who voluntarily participated during the data collection period. The authors also acknowledge the anonymous reviewers for their work.
About the authors
Henry Kankwamba is an economist who has more than five years of experience in agricultural research and policy analysis. He has worked with Malawi’s Lilongwe University of Agriculture and Natural Resources as a lecturer, the International Food Policy Research Institute as a research analyst, the World Bank Group and the International Maize and Wheat Improvement Center in various capacities. He is currently pursuing his Doctoral research at the University of Bonn’s Center for Development Research (ZEF) under supervision of Prof. Dr. Dr. hc. Joachim Von Braun. Dr Lukas Kornher obtained his PhD from the University of Bonn in 2015. He has extensive work experience in food price volatility and markets in general. He is currently working at the University of Bonn’s Center for Development Research (ZEF) as the Coordinator of the Food Monitor Project and Senior Research Fellow. He previously worked at the University of Kiel as a Post-Doctoral Researcher.
Authors’contributions
HK originated the idea, analysed the data and wrote the first draft. LK proofread the draft, modified technical aspects and discussion of results. Both authors read and approved the final manuscript.
Funding
Funding for the study was provided by the German Academic Exchange Services (DAAD) and Foundation Fiat Panis.
Availability of data and materials
The authors declare that data shall be provided upon request.
Ethics approval and consent to participate
An ethical clearance certificate was obtained from the University of Bonn. All participants were asked for their consent to participate in the survey.
Consent for publication
The authors give consent for publication.
Competing interests
The authors declare that they have no competing interest.
Author details 1
Department of Agricultural and Applied Economics, Lilongwe University of Agriculture and Natural Resources (LUANAR), Lilongwe, Malawi.2Center for Development Research (ZEF), University of Bonn, Genscherallee 3, 53113
Bonn, Germany.
Received: 13 December 2018 Accepted: 28 June 2019
References
Abbink K, Jayne TS, Moller LC (2011) The relevance of a rules-based maize marketing policy: an experimental case study of Zambia. J Dev Stud 47(2):207–230
Adler PA, Adler P (2003) The reluctant respondent. Inside interviewing: new lenses, new concerns, pp 153–173
Aiginger K (1996) Confronting the implications of the Cournot model with industry and firm data. Small Bus Econ 8(5):365– 378
Atmadja AS, Su JJ, Sharma P (2016) Examining the impact of microfinance on microenterprise performance (implications for women-owned microenterprises in Indonesia). Int J Soc Econ 43(10):962–981
Cai J, Szeidl A (2016) Interfirm relationships and business performance. Q J Econ 133(3):1229–1282
Chirwa EW (2007) Sources of technical efficiency among smallholder maize farmers in southern Malawi. African Portal. https://www.africaportal.org/publications/sources-of-technical-efficiency-among-smallholder-maize-farmers-in-southern-malawi/, Accessed 26 Mar 2019
Clyde MA, Ghosh J, Littman ML (2011) Bayesian adaptive sampling for variable selection and model averaging. J Comput Graph Stat 20(1):80–101
Cochran WG (1985) Sampling Techniques. Wiley, New York
Dal Bó P, Fréchette GR (2011) The evolution of cooperation in infinitely repeated games: Experimental evidence. Am Econ Rev 101(1):411–429
de Oliveira S, Nisbett RE (2018) Demographically diverse crowds are typically not much wiser than homogeneous crowds. Proc Natl Acad Sci 115(9):2066–2071
Fafchamps M, Minten B (2001) Social capital and agricultural trade. Am J Agric Econ 83(3):680–685
Gabre-Madhin EZ (2001) Market institutions, transaction costs, and social capital in the Ethiopian grain market. Intl Food Policy Res Inst 124
García-Villaverde PM, Rodrigo-Alarcón J, Ruiz-Ortega MJ, Parra-Requena G (2018) The role of knowledge absorptive capacity on the relationship between cognitive social capital and entrepreneurial orientation. J Knowl Manag
Genell A, Nemes S, Steineck G, Dickman PW (2010) Model selection in medical research: a simulation study comparing Bayesian model averaging and stepwise regression. BMC Med Res Method 10(1):108
Hamilton WD (1964) The genetical evolution of social behaviour. ii. J Theor Biol 7(1):17–52
Hayami Y (2009) Social capital, human capital and the community mechanism: Toward a conceptual framework for economists. J Dev Stud 45(1):96–123
Hoeting JA, Madigan D, Raftery AE, Volinsky CT (1999) Bayesian model averaging: a tutorial. In: Statistical science, pp 382–401 Islam MM, Habes EM, Alam MM (2018) The usage and social capital of mobile phones and their effect on the performance of
microenterprise: An empirical study. Technol Forecast Soc Chang 132:156–164
Junker BH (1960) Field work: an introduction to the social sciences. University of Chicago Press
Laffineur C, Barbosa SD, Fayolle A, Nziali E (2017) Active labor market programs effects on entrepreneurship and unemployment. Small Bus Econ 49(4):889–918
Levine SS, Apfelbaum EP, Bernard M, Bartelt VL, Zajac EJ, Stark D (2014) Ethnic diversity deflates price bubbles. Proc Natl Acad Sci 111(52):18524–18529
Liu B, Li Z (2018) Director-generals human and social capital, and management performance of farmers cooperatives: Evidence from China’s Fujian. Int J Manag Econ 54(2):149–165
Madigan D, Raftery AE (1994) Model selection and accounting for model uncertainty in graphical models using Occam’s window. J Am Stat Assoc 89(428):1535–1546
Mas-Collel W, Green DM (1995) Microeconomic theory. Oxford university Press, New York MASSP (2018) Malawi strategy support program (ifpri).http://massp.ifpri.info/, accessed 16 Nov 2018
McKenzie D, Sakho YS (2010) Does it pay firms to register for taxes? the impact of formality on firm profitability. J Dev Econ 91(1):15–24
Messina JP, Peter BG, Snapp SS (2017) Re-evaluating the Malawian farm input subsidy programme. Nature Plants 3(4):17013 Miao C, Coombs JE, Qian S, Sirmon DG (2017) The mediating role of entrepreneurial orientation: a meta-analysis of resource
orchestration and cultural contingencies. J Bus Res 77:68–80
Nowak MA (2006) Five rules for the evolution of cooperation. Science 314(5805):1560–1563
Okuguchi K (1993) Comparative statics for profit-maximizing and labor-managed Cournot oligopolies. Manag Decis Econ 14(5):433–444
Portes A (2014) Downsides of social capital. Proc Natl Acad Sci 111(52):18407–18408
Porto GG, Chauvin ND, Olarreaga M et al (2011) Supply chains in export agriculture, competition, and poverty in Sub-Saharan Africa. Centre for Economic Policy Research
Poulton C, Kydd J, Dorward A (2006) Overcoming market constraints on propoor agricultural growth in sub-Saharan Africa. Dev Policy Rev 24(3):243–277
Reny PJ, Perry M (2006) Toward a strategic foundation for rational expectations equilibrium. Econometrica 74(5):1231–1269 Sexton RJ, Xia T (2018) Increasing concentration in the agricultural supply chain: Implications for market power and sector
performance. Ann Rev Resour Econ
Sitko NJ, Chisanga B, Tschirley D, Jayne TS (2018) An evolution in the middle: examining the rise of multinational investment in smallholder grain trading in zambia. Food Security 10(2):473–488
Smith JM (1988) Evolution and the theory of games. In: Did Darwin Get It Right? Springer, pp 202–215 Trivers RL (1971) The evolution of reciprocal altruism. Q Rev Biol 46(1):35–57
Van Rijn F, Bulte E, Adekunle A (2012) Social capital and agricultural innovation in sub-Saharan Africa. Agric Syst 108:112–122 Varian HR (2014) Intermediate microeconomics: a modern approach: Ninth International Student Edition. WW Norton &
Company
Publisher’s Note