R E S E A R C H
Open Access
Objectively measured physical activity in
four-year-old British children: a cross-sectional
analysis of activity patterns segmented across
the day
Kathryn R Hesketh
1*, Alison M McMinn
1,2, Ulf Ekelund
2,3, Stephen J Sharp
2, Paul J Collings
2, Nicholas C Harvey
4,
Keith M Godfrey
4,5, Hazel M Inskip
4, Cyrus Cooper
4and Esther MF van Sluijs
1,2Abstract
Background:Little is known about preschool-aged children’s levels of physical activity (PA) over the course of the day. Using time-stamped data, we describe the levels and patterns of PA in a population-based sample of four-year-old British children.
Methods:Within the Southampton Women’s Survey the PA levels of 593 4-year-old children (51% female) were measured using (Actiheart) accelerometry for up to 7 days. Three outcome measures: minutes spent sedentary (<20 cpm); in light (LPA:≥20–399 cpm) and in moderate-to-vigorous activity (MVPA:≥400 cpm) were derived. Average daily activity levels were calculated and then segmented across the day (morning, afternoon and evening). MVPA was log-transformed. Two-level random intercept models were used to analyse associations between activity level and temporal and demographic factors.
Results:Children were active for 67% (mean 568.5 SD 79.5 minutes) of their daily registered time on average, with 88% of active time spent in LPA. All children met current UK guidelines of 180 minutes of daily activity. There were no differences in children’s average daily levels of sedentary activity and LPA by temporal and demographic factors: differences did emerge when activity was segmented across the day. Sex differences were largest in the morning, with girls being more sedentary, spending fewer minutes in LPA and 18% less time in MVPA than boys. Children were more sedentary and less active (LPA and MVPA) in the morning if they attended childcare full-time compared to part-time, and on weekend mornings compared to weekdays. The reverse was true for weekend afternoons and evenings. Children with more educated mothers were less active in the evenings. Children were less sedentary and did more MVPA on summer evenings compared to winter evenings.
Conclusions:Preschool-aged children meet current physical activity guidelines, but with the majority of their active time spent in LPA, investigation of the importance of activity intensity in younger children is needed. Activity levels over the day differed by demographic and temporal factors, highlighting the need to consider temporality in future interventions. Increasing girls’morning activity and providing opportunities for daytime activity in winter months may be worthwhile.
* Correspondence:krh40@medschl.cam.ac.uk 1
UKCRC Centre of Excellence for Diet and Activity Research (CEDAR), Box 296, Institute of Public Health, University of Cambridge, Cambridge, UK Full list of author information is available at the end of the article
Introduction
Physical activity plays an important role in children’s physical and mental wellbeing [1,2], with particular ben-efits for preschool children’s (3-5 years) social, gross motor and development skills [3,4]. Although the long-term benefits of being physically active from a very young age have yet to be confirmed, emerging evidence suggests that active children under 5 have better health and cognitive outcomes compared to less active peers, with positive habit formation early in life likely to be beneficial [5]. Establishing a high baseline level of phys-ical activity when young could be especially important given that activity levels are known to decrease from late childhood, through adolescence into adulthood [6,7].
Whilst there is a perception that young children are constantly active [8,9], prevalence estimates suggest that this may not be the case. A review in 2010 found that pre-school children accrue only limited amounts of physical activity during the preschool day, are sedentary for large amounts of time, and fail to meet the then recom-mended activity guidelines (>60 minutes MVPA) [10]. These guidelines, from National Association for Sport and Physical Education (NASPE), advocated 60 minutes of structured physical activity, with at least 60 minutes and up to several hours of further unstructured play each day for the under-5 s [11]. Yet when adherence to these recommendations was assessed across 39 studies, only 54% of children met these guidelines [12].
More recently, new physical activity guidelines for preschool-aged children have been published in Canada [13], Australia [14], the UK [15], and the USA [16]. Broadly similar, they recommend preschool-aged children should be active for 180 minutes daily. Importantly, these guidelines do not specify activity intensity, instead focu-sing on maximifocu-sing activity throughout the day [13-15]. Recommendations for sedentary behaviour in this age group also vary internationally, with UK recommenda-tions stating that the time children spend sedentary or restrained when not asleep should be limited [15]. Other guidelines advocate limiting screen time to 1 hour or less per day (Australia [14]) or restricting sed-entary time to less than 1 hour at a time (US [16]). Using these new guidelines, published evidence from Australia [17] suggests young children are active for around 130 minutes on average each day, equating to roughly 16% of measured time. The amount of moderate-to-vigorous physical activity (MVPA) children engaged was approxi-mately 4.8% [17].
Most studies investigating activity levels in preschool children have focused on average activity levels. How-ever, there is some suggestion that activity patterns differ over the course of the day and week [18]. Understanding differences in activity levels over the course of the day al-lows focussed intervention efforts to be developed, taking
into account when children may be less active and there-fore predisposed to efforts to increase activity. This paper aims to describe levels and patterns of activity in a population-based sample of 4-year-old British children. In addition to assessing children’s average activity levels, we were also able to explore how activity patterns change across the day, segmenting activity using hourly time-stamped data. These novel analyses therefore allow us to determine how children’s differing intensities of activity change throughout the day and how temporal and demo-graphic factors influence this activity.
Methods
Study design and setting
The Southampton Women’s Survey (SWS) is a population-based prospective cohort study population-based in Southampton, UK [19]. The study was designed to assess maternal diet and lifestyle before and during pregnancy, with 12,583 women recruited from General Practices in the Southampton area between 1998 and 2002. Subsequent live births (n = 3,159) were followed-up at specific ages to examine how chil-dren’s pre-natal development interacts with their post-natal growth, and how both may affect their risk factors for a range of future chronic diseases [19]. Par-ents of all participating children gave full and informed written consent. Ethical approval for the study was granted by the Southampton and South West Hamp-shire Local Research Ethics Committee.
Participants
This study uses data collected between March 2006 and June 2009 from a sample of 4-year-old children who were invited to participate in a sub-study (n = 1,065). Children were invited to attend a hospital visit to undergo body composition analysis and physical activity measurement in order to investigate the association be-tween bone health, obesity and physical activity [20].
Physical activity measurement
along with a maternal questionnaire to assess potential correlates of physical activity, previously validated in mothers of preschool children [23].
Outcome variables
Only accelerometry data were used for this analysis, as equations to combine heart-rate and accelerometer data are yet to be developed for this age-group. Data were analysed using a bespoke program (MAHUffe [24]). All recordings between 11 pm and 6 am were removed with those between 9 pm and 11 pm removed if they included more than 45 minutes of sedentary time. This period was deemed to reflect the hours that children spent sleep-ing, and represents a conservative estimate of sleep time [25]. Data periods of 100 minutes or more with zero-activity counts were removed [26], as were days with <600 minutes of recording, with 10 hours of activity being the cut-off to define a valid day [27]. The accelerometer out-put was derived as counts per minute (cpm) for all chil-dren and thresholds for light (LPA, >20 cpm), moderate (>400 cpm), and vigorous (>600 cpm) activity were used to determine time spent at each activity intensity for each hour between 6 am and 11 pm. Moderate–to-vigorous ac-tivity (MVPA) was calculated as >400 cpm. True sedentary time was derived by subtracting ‘active’ time (>20 cpm) from total valid registered time. Average daily minutes spent at each activity intensity were also calculated for all children. The Actiheart cut-points, applying a conversion factor of 5, were derived and validated experimentally in children and adolescents [28,29]. These equate to thresh-olds of 100 counts for LPA and 2000 counts for MVPA in the Actigraph 7164 accelerometer (Actigraph, Pensacola, FL, USA), which are broadly aligned with the respective preschool-specific cut points [30-33].
Exposure variables
Hour, time of day and week, and season (winter: December-February; spring: March-May; summer: June-August; autumn: September-November) were obtained from the accelerometer output. Each day was split into three pe-riods: morning (6 am-12 pm), afternoon (12-5 pm) and evening (5-11 pm). These three time periods were chosen to reflect plausible segmentation of UK preschool-aged children’s days: formal preschool sessions usually begin or end at 12 pm, and children may remain in care until early evening (~5 pm). Child’s age, gender, and height assessed using a Leicester height measure, and weight assessed using calibrated digital scales (Seca, Ltd., Birmingham, UK) [20] were recorded during the visit. Height and weight were used to calculate child’s body mass index (BMI) (kg/m2) and child’s BMI z-score [34], indicating how many units of standard deviation a child’s BMI is above or below the average BMI value for their age and sex. BMI z-score was then used to categorise each child
as under-weight, normal or over-weight/obese using the International Obesity Task Force classification [35]. Two variables were derived from the maternal question-naire. Childcare, nursery or preschool attendance was classified as either full-time (≥30 hours per week), or part-time or other (<30 hours per week). The age that mothers left full-time education was used to derive three categories (≤16 years, 17-18 years and >18 years). Due to the study design, paternal data was not available.
Statistical analysis
Analyses were carried out using STATA/SE 11 [36]. Demographic characteristics of children with (n = 593) and without valid physical activity data (n = 492) were compared using independentt-tests. A significance level of 0.05, seta priori, was used for all tests.
Descriptive characteristics of the sample and overall daily minutes spent in each activity intensity were calcu-lated, along with the percentage contribution of each in-tensity to total activity.
To investigate the influences on children’s MVPA, LPA and sedentary activity, a series of two-level random intercept models were used. Daily observations at level 1 were nested within participants at level 2. For each out-come, average daily activity level and activity segmented across the day (morning, afternoon and evening) were assessed. Due to non-normality, the logarithm of MVPA was used for regression analyses. As these regression co-efficients refer to the log-transformed outcome variable, beta values were exponentiated to give a ratio of the geo-metric means (GMR). A GMR can be interpreted similarly to a risk or odds ratio: any deviation from 1 indicates a% difference in MVPA relative to the respective reference category in the exposure variable. All models were ad-justed for sex, weight status, age child’s mother left full-time education, full-time of the week (weekday vs. weekend) and season. Two sets of sensitivity analyses were con-ducted to explore the impact of including children with differing numbers of valid days: first including and exclud-ing children with only one or two days of valid physical activity data (n = 49), and second children with and with-out activity data for both weekday and weekend days (n = 85).
Results
with average daily activity levels and segmented across the day presented in Table 2.
All children met the current UK recommended guide-lines of 180 minutes of activity per day (at any intensity above sedentary) on 100% of days measured. On just over half of the days measured, children engaged in >60 minutes of MVPA (former activity guideline), with boys meeting this guideline on significantly more measure-ment days than girls (55 vs. 49% of measuremeasure-ment days,
p< 0.001).
Children’s average hourly activity levels across the day are shown in Figure 1. Although average daily time spent in sedentary activity, LPA and MVPA showed few differ-ences by subgroups, multiple differential associations for all outcomes were seen when activity was segmented across the day (Tables 3, 4 and 5). Sensitivity analyses showed that results did not differ when children≤2 days of valid activity data were included or excluded from analyses, nor when children with and without one valid weekday and weekend day were included or excluded. All children with≥1 day of valid activity data were therefore included in analyses.
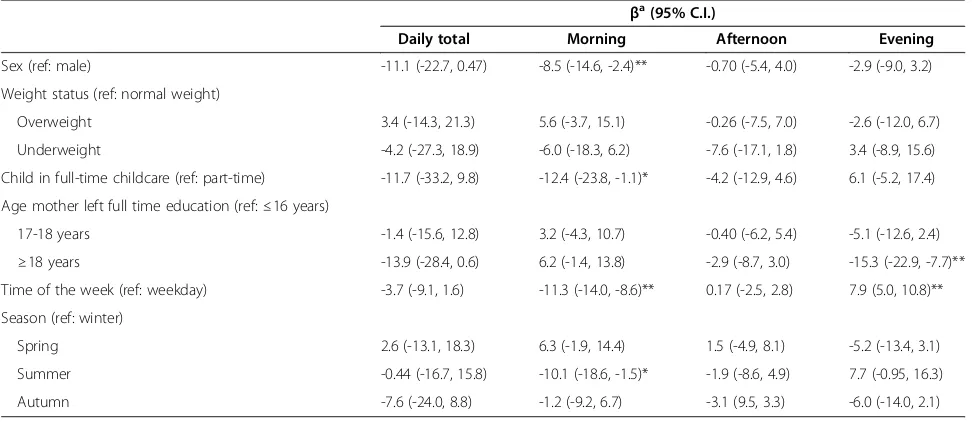
Girls were more sedentary (β= 6.3, (95% C.I. 1.8, 10.8)) and less active (LPA: -8.5 (-14.6, -2.4)) in the mornings, engaging in 18% less MVPA (GMR:0.82 (0.73, 0.91)) com-pared to boys. Girls also engaged in less MVPA in the eve-nings (0.83 (0.74, 0.94)). Underweight children were more
sedentary in the afternoons compared to their normal weight peers. Compared with children whose mothers left school at or before 16, children whose mothers left school after 18 were more sedentary and less active (engaging in less LPA and MVPA) in the evenings.
Children who attended preschool full-time were more sedentary and less active in the mornings compared to children attending part-time. Moreover, children were also more sedentary and less active on weekend morn-ings compared to weekdays. The reverse was true on weekend afternoons and evenings: children were less sed-entary and engaged in more MVPA on weekend after-noons, and were more active in the evenings compared to weekdays. Compared to winter months, children engaged in less LPA in the morning during summer, but were also less sedentary and engaged in more MVPA on summer evenings.
Discussion
This study showed that British 4-year old children spend on average 67% of their day being active, engaging pre-dominately in LPA (~88% of active time). Although few differences in average activity levels were observed, the current study provides novel information about how temporal and demographic factors differentially influ-ence children’s activity when segmented across the day. Child’s sex and weight status, age their mother left full-time education, attending childcare full-full-time, full-time of the week and season were all independently associated with children’s activity levels at different times of the day. These time-specific observations are likely to be impor-tant for intervention development, indicating that focus-sing on (specific subgroups in) periods when children are less active, for example girls in the mornings, or during winter months, may result in larger increases in children’s activity.
Based on the data presented here, all children met the current UK activity guidelines. Although these guidelines are comparable to Australian recommendations, previ-ous estimates indicate that only 5.1% of Australian chil-dren met these guidelines [17]. The proportion of time children spent active in this study (~67%) was also higher than reported previously in studies in Europe (~16%) [37,38] and Australia(~16%) [17]. Several factors, including the population studied, the measure of physical activity and wear and processing protocols, are likely to contribute to these differences across studies. These data were collected in a population-based sample, as opposed to a pre-school or care-setting based sample as is more com-monly used [17,38]. Moreover, previous studies have pre-dominantly used Actigraph accelerometers worn on the hip during waking hours and taken off during water-based ac-tivities [17,37,38]. The waterproof Actiheart monitor, worn continuously for 24 hours each day, is therefore likely to
Table 1 Characteristics of 4-year-old children with valid Actiheart data (n = 593).
Female (n (%)) 300 (51)
Age (years) 4.1 (0.1)
Ethnicity (% non-white) 17 (3)
Children attend childcare full time 45 (8)
BMI z-score 0.15 (1.1)
Weight status (IOTF classification) (n (%))
Underweight 42 (7)
Normal 474 (80)
Overweight/Obese 77 (13)
Age mother left education (n (%))
≤16 years 190 (32)
17-18 years 213 (36)
≥18 years 190 (32)
Season of measurement (n (%))
Winter 143 (24)
Spring 145 (24)
Summer 153 (26)
Autumn 155 (26)
have captured more of children’s daily activity. Further, the cut points used here, equivalent to those previous applied to Actigraph data [30,31,39], were derived experimentally and validated against doubly labelled water [29]. As other studies have used higher cut points to classify active time [17,37,38], they are likely to report lower levels of activity. Taken together, varying study methods and lack of raw count per minute data to compare between studies [40], make comparison of prevalence estimates of young chil-dren’s activity, and their compliance with guidelines, prob-lematic [27].
We observed that children spend the majority of their time in LPA. Provided that≥100 cpm is a valid threshold for LPA [30,31], and even accounting for differences in classification according to accelerometer cutpoints [41], children’s light activity levels are‘sufficient’to comfortably satisfy current activity guidelines. It may however be im-portant to consider whether specifying activity intensity along with a total activity guideline is necessary for this
age-group. LPA may confer limited health benefits for young children, if, as is the case in older children and adults, benefits to health are associated with more vig-orous intensity activity [42,43]. Indeed, in this sample of children, MVPA (and not LPA) has been found to be positively associated with bone density [44] and vigor-ous activity with lower fat mass [45]. The relevance of this debate is further highlighted by the recent observation that more than 1 in 5 UK children are either overweight or obese on entering school at age 5 [46], which seems at odds with observations that all children are sufficiently ac-tive. The importance of activity intensity in younger chil-dren therefore requires further investigation to inform future activity guidelines for the under-5 s.
Increasingly, evidence suggests that even at a young age boys are more active than girls [17,37,47], which was also observed here. This study adds to the current literature by highlighting that these differences are not consistent throughout the day. Sex differences were most apparent in
Table 2 Children’s average daily activity levels and segmented across the day (in minutes)
Daily total (SD) % Active timea Morning Afternoon Evening
Registered time 852.0 (37.8) - 299.1 (44.9) 299.7 (4.3) 254.2 (34.6)
Sedentary 283.5 (72.2) - 91.1 (40.0) 77.8 (46.6) 116.2 (44.2)
Active 568.5 (79.5) - 208.0 (55.3) 221.9 (46.9) 138.0 (55.1)
Light 498.9 (65.8) 88% 185.4 (47.5) 189.9 (39.2) 123.6 (47.7)
MVPA 69.6 (30.7) 12% 22.6 (19.0) 32.0 (23.9) 14.4 (16.0)
Moderate 35.8 (14.9) 6% 11.7 (9.4) 16.0 (11.2) 8.0 (7.9)
Vigorous 32.8 (18.7) 6% 10.7 (11.6) 15.6 (15.2) 6.2 (9.7)
SD: Standard deviation; a: Percentage of average total daily active time that children spent at given intensity; MVPA: Moderate and vigorous physical activity; Morning: 6 am-12 pm; Afternoon: 12-5 pm; Evening: 5-11 pm.
0 10 20 30 40 50 60
Minutes
of
activ
ity p
e
r hour
Time of day (hour)
Sedentary LPA MVPA
the mornings, with girls being relatively less active and more sedentary than boys. In contrast, children’s weight status did not appear to have an influence on children’s activity across the day. As similar finding have been seen previously in this age group [18], these patterns may be indicative of preschool-aged children’s activity across the day, and future interventions may need to consider a temporal focus to differentially target boys and girls.
Interestingly, children who attended nursery full-time compared to part-time were more sedentary and less ac-tive in the mornings. It has been suggested previously that childcare may influence children’s physical activity levels [10], but the measure used here provides only a basic idea of whether children were usually in childcare full- or part-time. As it was not possible to determine where children were during the measurement week, further work is re-quired to determine whether activity levels differ by time
Table 3 Adjusted associations between daily sedentary time/segmented across the day and temporal and demographic factors
βa(95% C.I.)
Daily total Morning Afternoon Evening
Sex (ref: male) 10.7 (-1.9, 23.4) 6.3 (1.8, 10.8)** 2.8 (-3.1, 8.6) 2.9 (-2.4, 8.3)
Weight status (ref: normal weight)
Overweight 12.3 (-7.0, 31.7) 1.6 (-5.3, 8.5) 3.7 (-5.3, 12.6) 6.7 (-1.5, 14.9)
Underweight 19.3 (-5.9, 44.5) 8.2 (-0.76, 17.3) 13.3 (1.6, 25.0)* 2.7 (-8.0, 13.4)
Child in full-time childcare (ref: part-time) 22.7 (-0.78, 46.0) 14.2 (5.9, 22.5)** 8.0 (-2.8, 8.7) 0.3 (-9.6, 10.2)
Age mother left full time education (ref:≤16 years)
17-18 years 0.75 (-14.7, 16.2) -0.90 (-6.4, 4.6) -1.2 (-8.2, 5.9) 3.1 (-3.5, 9.6)
≥18 years 13.7 (-2.1, 29.5) 3.0 (-2.6, 8.6) 0.40 (-6.8, 7.7) 10.8 (4.1, 17.4)**
Time of the week (ref: weekday) -1.6 (-7.6, 4.3) 5.6 (2.9, 8.4)** -3.7 (-6.6, -0.80)* -2.8 (-5.8, 0.11)
Season (ref: winter)
Spring -3.6 (-20.9, 13.6) 0.39 (-5.5, 7.1) -5.9 (-13.8, 2.0) -1.2 (-8.5, 6.2)
Summer -1.7 (-19.5, 16.0) 4.5 (-1.9, 11.0) -0.10 (-8.3, 8.1) -9.0 (-16.6, -1.4)*
Autumn 5.4 (-12.5, 23.3) 0.44 (-5.7, 6.6) 2.8 (-4.9, 10.6) 2.4 (-4.8, 9.6)
aβ
co-efficient represents the difference in minutes spent sedentary compared to the reference category for the given time segment. Final results from a two-level random intercept models adjusted for sex, weight status, time in childcare, age child’s mother left full-time education, time of the week (weekday vs. weekend) and season (Winter: December-February; Spring: March-May; Summer: June-August; Autumn: September-November);*p< 0.05; **p< 0.01.
Table 4 Adjusted associations between daily LPA/segmented across the day and temporal and demographic factors
βa
(95% C.I.)
Daily total Morning Afternoon Evening
Sex (ref: male) -11.1 (-22.7, 0.47) -8.5 (-14.6, -2.4)** -0.70 (-5.4, 4.0) -2.9 (-9.0, 3.2)
Weight status (ref: normal weight)
Overweight 3.4 (-14.3, 21.3) 5.6 (-3.7, 15.1) -0.26 (-7.5, 7.0) -2.6 (-12.0, 6.7)
Underweight -4.2 (-27.3, 18.9) -6.0 (-18.3, 6.2) -7.6 (-17.1, 1.8) 3.4 (-8.9, 15.6)
Child in full-time childcare (ref: part-time) -11.7 (-33.2, 9.8) -12.4 (-23.8, -1.1)* -4.2 (-12.9, 4.6) 6.1 (-5.2, 17.4)
Age mother left full time education (ref:≤16 years)
17-18 years -1.4 (-15.6, 12.8) 3.2 (-4.3, 10.7) -0.40 (-6.2, 5.4) -5.1 (-12.6, 2.4)
≥18 years -13.9 (-28.4, 0.6) 6.2 (-1.4, 13.8) -2.9 (-8.7, 3.0) -15.3 (-22.9, -7.7)**
Time of the week (ref: weekday) -3.7 (-9.1, 1.6) -11.3 (-14.0, -8.6)** 0.17 (-2.5, 2.8) 7.9 (5.0, 10.8)**
Season (ref: winter)
Spring 2.6 (-13.1, 18.3) 6.3 (-1.9, 14.4) 1.5 (-4.9, 8.1) -5.2 (-13.4, 3.1)
Summer -0.44 (-16.7, 15.8) -10.1 (-18.6, -1.5)* -1.9 (-8.6, 4.9) 7.7 (-0.95, 16.3)
Autumn -7.6 (-24.0, 8.8) -1.2 (-9.2, 6.7) -3.1 (9.5, 3.3) -6.0 (-14.0, 2.1)
aβco-efficient represents the difference in minutes spent in light physical activity (LPA) compared to the reference category for the given time segment. Final
spent in childcare and what factors in the childcare envir-onment influence children’s activity.
The differences in daily patterns observed between week and weekend days are likely to reflect families’ normal working weeks, with children typically rising and going to bed earlier on weekdays. What is not clear is why children whose mothers left school at a later age were also more likely to be sedentary and less active in the evenings. As maternal employment status was not collected at the age four visit, it is not possible to determine whether this find-ing relates to more of these mothers befind-ing in full-time work. However, it has been shown previously that three-year-old children with more highly educated mothers are more likely to have a set bedtime and bedtime routine [48], which may plausibly account for the children of higher edu-cated mothers being less active in the evenings here.
Although not studied directly, it is likely that the ob-served seasonal variation, with greater activity and less sedentary time in the evenings during the summer com-pared to winter, reflects the longer daylight hours of summer months. Contrary to previous observations in preschool children [49], children’s average daily MVPA was higher in spring compared to winter, which appears to be the result of a consistent accumulation of more activity throughout the day. Through this novel and de-tailed investigation of the temporal differences in beha-viour, we are able to highlight opportunities to encourage activity in children, such as specifically targetting activity during the mornings for girls, or facilitating day-time ac-tivity opportunities for preschoolers during the autumn and winter months.
Strengths and limitations
Using data from a large population-based sample of four-year-old children, this study is one of the first to describe objectively measured physical activity levels of British preschool-aged children [50,51], and highlight differences in activity across the day. As mothers were recruited before children were born, children were drawn from all socio-economic strata in the city of Southampton and surrounding areas. The sample is not therefore subject to biases seen in more commonly used (pre-)school-based samples, which by their nature ex-clude children who do not attend formal childcare (for sufficient amounts of time). In addition, children’s activ-ity was measured throughout the year, rather than being bounded by school terms, allowing analysis of seasonal variation.
We included all children with at least one valid day of physical activity data to maximise our sample size and power. However, sensitivity analyses showed that res-tricting the sample to those with valid physical activity for ≥3 days or to those with at least one weekday and weekend day did not alter the results. We also found no significant differences between those who did and did not provide valid activity data at age 4, suggesting that the sample is likely to be representative of the South-ampton study population and wider population. This said, participants were predominately white British in keeping with the Southampton region (~82%) [52], and fewer children in this sample were overweight or obese compared to the national average [46]. Care should there-fore be taken in generalizing these results to specific
sub-Table 5 Adjusted associations between daily MVPA/segmented across the day and temporal and demographic factors
Exponentiatedβb(95% C.I.)
Daily total Morning Afternoon Evening
Sex (ref: male) 0.85 (0.77, 0.94)** 0.82 (0.73, 0.91)** 0.93 (0.84, 1.04) 0.83 (0.74, 0.94)**
Weight status (ref: normal weight)
Overweight 0.93 (0.80, 1.09) 0.91 (0.76, 1.08) 0.92 (0.79, 1.09) 0.94 (0.78, 1.13)
Underweight 0.86 (0.70, 1.04) 0.89 (0.70, 1.12) 0.84 (0.68, 1.03) 1.01 (0.79, 1.28)
Child in full-time childcare (ref: part-time) 0.79 (0.66, 0.94)** 0.80 (0.65, 0.99)* 0.88 (0.72, 1.01) 1.04 (0.83, 1.30)
Age mother left full time education (ref:≤16 years)
17-18 years 0.96 (0.85, 1.06) 0.97 (0.85, 1.12) 1.01 (0.89, 1.15) 0.84 (0.73, 0.98)*
≥18 years 0.94 (0.83, 1.06) 0.98 (0.85, 1.13) 1.05 (0.92, 1.19) 0.72 (0.62, 0.84)**
Time of the week (ref: weekday) 0.97 (0.93, 1.02) 0.83 (0.78, 0.89)** 1.09 (1.03, 1.17)** 1.08 (1.00, 1.17)*
Season (ref: winter)
Spring 1.18 (1.03, 1.36)* 1.08 (0.92, 1.27) 1.07 (0.93, 1.24) 1.11 (0.94, 1.31)
Summer 1.15 (1.01, 1.33)* 0.93 (0.79, 1.09) 1.07 (0.92, 1.24) 1.38 (1.16, 1.64)*
Autumn 1.08 (0.93, 1.23) 0.99 (0.85, 1.16) 0.98 (0.85, 1.12) 0.98 (0.83, 1.15)
b
populations, including those from ethnic minorities or populations with high levels of childhood overweight/ obesity.
The novel use of time-stamped data, dividing days into three time periods, allows a more detailed description of the temporal patterns of children’s activity across the day. These segments reflect plausible subdivision of preschool-aged children’s days, with sessional care offered from Monday-Friday in the UK. Although most children in this sample attended childcare at least part-time, time-matched care attendance data was not available to de-termine what influence childcare attendance had on their physical activity levels. However, by segmenting the day in this way, clear times do appear during which public health interventions to increase activity in spe-cific subgroups may be more likely to show a beneficial impact.
Actiheart monitors present a valid [21,22] and feasible form of measuring young children’s activity, providing in-creased wear time and therefore enhanced characterization of children’s daily activity levels, in combination with a vali-dated questionnaire [23]. Validation studies have shown that the use of 60-second epochs, used here to allow suffi-cient memory to record for 7 days, may underestimate MVPA [53], whilst overestimating LPA [54]. Whilst this may have led to attenuation of the associations found here, our results still suggest that factors influencing children’s sedentary, LPA and MVPA are likely to differ in the preschool-aged population.
Conclusion
Four-year old British children accumulate sufficient ac-tivity over the day to meet current guidelines, although this activity is predominantly of light intensity for which the health benefits remain to be determined. In addition, patterning of activity varies over the day by demographic and temporal factors. These should be taken into ac-count when developing new interventions to increase preschoolers’ physical activity, for example focusing on encouraging girls’morning activity and providing oppor-tunities for daytime activity in winter months.
Abbreviations
PA:Physical activity; LPA: Light physical activity; MVPA: Moderate and vigorous physical activity; SWS: Southampton Women’s Survey; cpm: Counts per minute; BMI: Body mass index; GMR: Geometric mean ratio.
Competing interests
The authors declare that they have no competing interests.
Authors’contributions
KRH was responsible for cleaning and analysing the physical activity data, conducting the data analyses and interpretation of the results, drafting the manuscript. AMM contributed to data analyses and interpretation, SJS provided statistical assistance and PJC assisted in cleaning the physical activity data. NCH, HMI, KMG & CC were responsible for the overall SWS study concept, design and oversaw the collection of data UE & EvS were responsible for conceptualisation and designed of physical activity data
collection, designed the data collection instruments. EvS additionally provided input on the data analyses and interpretation of the results. All authors critically reviewed the manuscript and approved its final version.
Acknowledgements
We thank the mothers who gave us their time and a team of dedicated research nurses and ancillary staff for their assistance. Participants were drawn from a cohort study funded by the Medical Research Council and the Dunhill Medical Trust. In addition, we thank Kate Westgate and Stefanie Mayle from the physical activity technical team at the MRC Epidemiology Unit for their assistance in processing the accelerometer data. This work was undertaken by the Centre for Diet and Activity Research (CEDAR), a UKCRC Public Health Research Centre of Excellence. Funding from the British Heart Foundation, Economic and Social Research Council, Medical Research Council, the National Institute for Health Research, and the Wellcome Trust, under the auspices of the UK Clinical Research Collaboration, is gratefully acknowledged. The work was also supported by the Medical Research Council [programme grant numbers MC_UU_12015/7, MC_UU_12015/3 and MC_UU_12015/4]. The work of CC, HI, NH and KG was supported by funding from the Medical Research Council, British Heart Foundation, the Arthritis Research Campaign, National Osteoporosis Society, International Osteoporosis Foundation, Cohen Trust, the European Union Seventh Framework Programme (FP7/2007-2013) EarlyNutrition project under grant agreement n° 289346, NIHR Southampton Biomedical Research Centre and NIHR Musculoskeletal Biomedical Research Unit, Oxford.
Author details
1UKCRC Centre of Excellence for Diet and Activity Research (CEDAR), Box
296, Institute of Public Health, University of Cambridge, Cambridge, UK.2MRC Epidemiology Unit, Institute of Metabolic Science, Box 285, Addenbrooke's Hospital, Cambridge, UK.3Department of Sport Medicine, Norwegian School of Sport Sciences, Oslo, Norway.4MRC Lifecourse Epidemiology Unit, University of Southampton, Southampton General Hospital, Southampton, UK.5NIHR Southampton Biomedical Research Centre, University of Southampton and University Hospital Southampton NHS Foundation Trust, Southampton, UK.
Received: 4 June 2013 Accepted: 20 December 2013 Published: 9 January 2014
References
1. Janssen I, Leblanc AG:Systematic review of the health benefits of physical activity and fitness in school-aged children and youth.Int J Behav Nutr Phys Act2010,7:40.
2. Ekeland E, Heian F, Hagen KB:Can exercise improve self esteem in children and young people? A systematic review of randomised controlled trials.Br J Sports Med2005,39(11):792–798.
3. Timmons BW, Naylor PJ, Pfeiffer KA:Physical activity for preschool children– how much and how?Can J Publ Health2007,98(Suppl 2):S122–S134. 4. Fisher A, Reilly JJ, Kelly LA, Montgomery C, Williamson A, Paton JY, Grant S:
Fundamental movement skills and habitual physical activity in young children.Med Sci Sports Exerc2005,37(4):684–688.
5. Timmons BW, Leblanc AG, Carson V, Connor Gorber S, Dillman C, Janssen I, Kho ME, Spence JC, Stearns JA, Tremblay MS:Systematic review of physical activity and health in the early years (aged 0-4 years).
Appl Physiol Nutr Metab2012,37(4):773–792.
6. Nader PR, Bradley RH, Houts RM, McRitchie SL, O'Brien M:Moderate-to-vigorous physical activity from ages 9 to 15 years.JAMA2008,300(3):295–305. 7. Lader DSS, Gershuny J:The time use survey, 2005: how we spend our time.
London, UK: Office for National Statistics; 2006:67.
8. Lopez-Dicastillo O, Grande G, Callery P:Parents' contrasting views on diet versus activity of children: implications for health promotion and obesity prevention.Patient Educ Couns2010,78(1):117–123.
9. Hesketh KD, Hinkley T, Campbell KJ:Children's physical activity and screen time: qualitative comparison of views of parents of infants and preschool children.Int J Behav Nutr Phys Act2012,9:152. 10. Reilly JJ:Low levels of objectively measured physical activity in
preschoolers in child care.Med Sci Sports Exerc2010,42(3):502–507. 11. National Association for Sport and Physical Education:Active start: a
2nd edition.In Edited by American Alliance for Health PE, Recreation and Dance. Reston, VA: NASPE; 2009.
12. Tucker P:The physical activity levels of preschool-ages children: a systematic review.Early Child Res Q2008,23:547–558.
13. Tremblay MS, Leblanc AG, Carson V, Choquette L, Connor Gorber S, Dillman C, Duggan M, Gordon MJ, Hicks A, Janssen I,et al:Canadian physical activity guidelines for the early years (aged 0-4 years).Appl Physiol Nutr Metab2012,
37(2):345–356.
14. Department of Health and Aging: Get Up and Grow:Healthy eating and physical activity for early childhood.Canberra, Australia: Department of Health and Aging: Australian Government; 2010.
15. Department of Health:Start active, stay active: a report on physical activity from the four home countries’chief medical officers.London, UK; 2011. 16. Institute of Medicine:Early childhood obesity prevention policies.Washington,
DC: The National Academies Press; 2011.
17. Hinkley T, Salmon J, Okely AD, Crawford D, Hesketh K:Preschoolers' physical activity, screen time, and compliance with recommendations.
Med Sci Sports Exerc2012,44(3):458–465.
18. Van Cauwenberghe E, Jones RA, Hinkley T, Crawford D, Okely AD:Patterns of physical activity and sedentary behaviour in preschool children.Int J Behav Nutr Phys Act2012,9:138.
19. Inskip HM, Godfrey KM, Robinson SM, Law CM, Barker DJ, Cooper C:Cohort profile: the Southampton women's survey.Int J Epidemiol2006,35(1):42–48. 20. Harvey NC, Mahon PA, Robinson SM, Nisbet CE, Javaid MK, Crozier SR, Inskip
HM, Godfrey KM, Arden NK, Dennison EM,et al:Different indices of fetal growth predict bone size and volumetric density at 4 years of age.
J Bone Miner Res2010,25(4):920–927.
21. Adolph AL, Puyau MR, Vohra FA, Nicklas TA, Zakeri IF, Butte NF:Validation of uniaxial and triaxial accelerometers for the assessment of physical activity in preschool children.J Phys Act Health2012,9(7):944–953. 22. Corder K:Physical activity measurement in young people.Cambridge:
University of Cambridge; 2007.
23. McMinn AM, van Sluijs EM, Harvey NC, Cooper C, Inskip HM, Godfrey KM, Griffin SJ:Validation of a maternal questionnaire on correlates of physical activity in preschool children.Int J Behav Nutr Phys Act2009,6:81. 24. MRC Epidemiology Unit:MAHUffe.http://www.mrc-epid.cam.ac.uk/
research/resources/materials-transfer-disclaimer/physical-activity-downloads/. 25. Acebo C, Sadeh A, Seifer R, Tzischinsky O, Hafer A, Carskadon MA:Sleep/
wake patterns derived from activity monitoring and maternal report for healthy 1- to 5-year-old children.Sleep2005,28(12):1568–1577. 26. Choi L, Liu Z, Matthews CE, Buchowski MS:Validation of accelerometer
wear and nonwear time classification algorithm.Med Sci Sports Exerc
2011,43(2):357–364.
27. Beets MW, Bornstein D, Dowda M, Pate RR:Compliance with national guidelines for physical activity in U.S. preschoolers: measurement and interpretation.Pediatrics2011,127(4):658–664.
28. Corder K, Brage S, Wareham NJ, Ekelund U:Comparison of PAEE from combined and separate heart rate and movement models in children.
Med Sci Sports Exerc2005,37(10):1761–1767.
29. Ridgway CL, Brage S, Sharp SJ, Corder K, Westgate KL, van Sluijs EM, Goodyer IM, Hallal PC, Anderssen SA, Sardinha LB,et al:Does birth weight influence physical activity in youth? A combined analysis of four studies using objectively measured physical activity.PLoS One2011,6(1):e16125. 30. Trost SG, Loprinzi PD, Moore R, Pfeiffer KA:Comparison of accelerometer
cut points for predicting activity intensity in youth.Med Sci Sports Exerc
2011,43(7):1360–1368.
31. Ridgers ND, Salmon J, Ridley K, O'Connell E, Arundell L, Timperio A:
Agreement between activPAL and ActiGraph for assessing children's sedentary time.Int J Behav Nutr Phys Act2012,9:15.
32. Pate RR, Almeida MJ, McIver KL, Pfeiffer KA, Dowda M:Validation and calibration of an accelerometer in preschool children.Obesity (Silver Spring)
2006,14(11):2000–2006.
33. Sirard JR, Trost SG, Pfeiffer KA, Dowda M, Pate RR:Calibration and evaluation of an objective measure of physical activity in preschool children.J Phys Act Health2005(3):345–357.
34. Cole TJ:The LMS method for constructing normalized growth standards.
Eur J Clin Nutr1990,44(1):45–60.
35. Cole TJ, Bellizzi MC, Flegal KM, Dietz WH:Establishing a standard definition for child overweight and obesity worldwide: international survey.
BMJ2000,320(7244):1240–1243.
36. StataCorp LP:Stata/SE 11 for windows.TX. USA: College Station; 2009.
37. Vale S, Silva P, Santos R, Soares-Miranda L, Mota J:Compliance with physical activity guidelines in preschool children.J Sports Sci2010,28(6):603–608. 38. Cardon GM, De Bourdeaudhuij IM:Are preschool children active enough?
Objectively measured physical activity levels.Res Q Exercise Sport2008,
79(3):326–332.
39. Freedson P, Pober D, Janz KF:Calibration of accelerometer output for children.Med Sci Sports Exerc2005,37(11 Suppl):S523–S530. 40. Oliver M, Schofield GM, Kolt GS:Physical activity in preschoolers:
understanding prevalence and measurement issues.Sports Med2007,
37(12):1045–1070.
41. van Cauwenberghe E, Labarque V, Trost SG, de Bourdeaudhuij I, Cardon G:
Calibration and comparison of accelerometer cut points in preschool children.Int J Pediatr Obes2011,6(2–2):e582–e589.
42. Steele RM, van Sluijs EM, Cassidy A, Griffin SJ, Ekelund U:Targeting sedentary time or moderate- and vigorous-intensity activity: independent relations with adiposity in a population-based sample of 10-y-old British children.Am J Clin Nutr2009,90(5):1185–1192.
43. Ekelund U, Luan J, Sherar LB, Esliger DW, Griew P, Cooper A:Moderate to vigorous physical activity and sedentary time and cardiometabolic risk factors in children and adolescents.JAMA2012,307(7):704–712. 44. Harvey NC, Cole ZA, Crozier SR, Kim M, Ntani G, Goodfellow L, Robinson SM,
Inskip HM, Godfrey KM, Dennison EM,et al:Physical activity, calcium intake and childhood bone mineral: a population-based cross-sectional study.Osteoporos Int2012,23(1):121–130.
45. Collings PJ, Brage S, Ridgway CL, Harvey NC, Godfrey KM, Inskip HM, Cooper C, Wareham NJ, Ekelund U, SWS Study Group:Physical activity intensity, sedentary time and body composition in preschoolers.Am J Clin Nutr2013,
97(5):1020–1028.
46. National Child Measurement Programme - England, 2011-2012 school year.http:// www.hscic.gov.uk/article/2021/Website-Search?productid=10135&q=national +child+measurement+programme+2011-2012&sort=Relevance&size=10& page=1&area=both#top.
47. Hinkley T, Crawford D, Salmon J, Okely AD, Hesketh K:Preschool children and physical activity: a review of correlates.Am J Prev Med2008,
34(5):435–441.
48. Hale L, Berger LM, LeBourgeois MK, Brooks-Gunn J:Social and demographic predictors of preschoolers' bedtime routines.J Dev Behav Pediatr2009,
30(5):394–402.
49. Rich C, Griffiths LJ, Dezateux C:Seasonal variation in accelerometer-determined sedentary behaviour and physical activity in children: a review.Int J Behav Nutr Phys Act2012,9(1):49.
50. Jackson DM, Reilly JJ, Kelly LA, Montgomery C, Grant S, Paton JY:
Objectively measured physical activity in a representative sample of 3-to 4-year-old children.Obes Res2003,11(3):420–425.
51. Reilly JJ, Kelly L, Montgomery C, Williamson A, Fisher A, McColl JH, Lo Conte R, Paton JY, Grant S:Physical activity to prevent obesity in young children: cluster randomised controlled trial.BMJ2006,333(7577):1041. 52. Estimated resident population by ethnic group and sex (experimental statistics).
http://www.southampton.gov.uk/living/statsresearch/2011census/ 2011ethnicity.aspx.
53. Vale S, Santos R, Silva P, Soares-Miranda L, Mota J:Preschool children physical activity measurement: importance of epoch length choice.Pediatr Exerc Sci
2009,21(4):413–420.
54. Reilly JJ, Penpraze V, Hislop J, Davies G, Grant S, Paton JY:Objective measurement of physical activity and sedentary behaviour: review with new data.Arch Dis Child2008,93(7):614–619.
doi:10.1186/1479-5868-11-1
Cite this article as:Heskethet al.:Objectively measured physical activity