Volume -2, Issue - 1, January – February 2016, Page No. 22 - 33
Corresponding Author: Rupesh Kumar, Page No. 22 - 33
Pag
e
22
ISSN: 2455 - 1597
Application Of Taguchi Methodology In Optimization Of Surface Roughness During Turning Of Low
Carbon Steel
Rupesh Kumar1, Abhishek Singh Jatav2
1
M.Tech student in Manufacturing & Industrial Engineering, Suresh Gyan Vihar University, Jaipur
2
Assistant Professor, Suresh Gyan Vihar University, Jaipur
Abstract
Turning is the most common process associated with the production of cylindrical shapes because of its simplicity, rapidity, and economy. Metal machining has been an interesting topic of research for decades. AISI 1018 has excellent weld ability and produces a uniform and harder case and it is considered as the best steel for the carburised parts. This paper discusses the experimental study on performance characteristics of AISI 1018 low carbon steel during CNC turning process. The experiments are conducted and based on Taguchi L16 orthogonal array by taking cutting speed, feed rate, depth of cut and nose radius. The complete experimental results are discussed and presented in this paper.
Keywords: Analysis of Variance (ANOVA), Design of Experiments (DOE), Degree of freedom (DOF), Orthogonal
Array (OA)
1. INTRODUCTION
This paper presents the importance of surface quality and material rate in machining. Machining parameters such as cutting speed, feed rate and depth of cut play a vital role in machining the given work piece to the required shape. These have a major effect on the quality of production, cost of production and production rate; hence their judicious selection assumes significance. The selected machining parameters should yield desired quality on the machined surface while utilizing the machining resources such as machine tool and cutting tool to the fullest extent possible, consistent with the constraints on these resources.
There are many machining process such as drilling, shaping, turning, slotting, grinding etc. During machining, the consumed power is largely converted into het resulting high cutting temperature near the edge of the tool and the amount of heat generated varies with the type of material. In the present work, turning process has been taken up for the surface roughness and material removal rate optimization. As, the turning process is the most productive process, the study is expected to be quite beneficial. Here, through turning process has been selected for the study to determine the impact of process parameters on the surface roughness and material removal rate.
© IJERGS, All Rights Reserved.
Pag
e
23
Pag
e
23
Pag
e
23
Pag
e
23
Pag
e
23
Pag
e
23
Pag
e
23
Pag
e
23
Pag
e
23
Pag
e
23
Pag
e
23
Pag
e
23
Pag
e
23
Pag
e
23
Pag
e
23
Pag
e
23
Pag
e
23
Pag
e
23
Pag
e
23
Pag
e
23
Pag
e
23
2. EXPERIMENTATION
The experimental work was started with preparation of work piece followed by turning on CNC machine centre. Measurement of surface roughness was taken on Surtronic 25 and material removal rate was measured by using formula. Turning operations was carried out on a computer numerical control (CNC) lathe machine (Stallion 100 HS) of Hindustan machine tools Ltd. CNC lathe is one of the most versatile and widely used machine tool. The main function of a CNC lathe is to remove metal from a job to give it the required shape and size. The job is securely and rigidly held in the chuck and then turned against a single point cutting tool which will remove metal from the job in the form of chips besides the simple turning operation. In this study, TIN coated carbide tool single point cutting tools is used.
Figure 3.1: CNC Lathe machine
The machining experiments were performed on AISI-1018 low carbon alloy steel. The AISI-1018 low carbon alloy steel rod of length 1080 mm and diameter 30 mm size has been used as a work piece material for the present experiments. AISI-1018 low carbon alloy steel has good wear resistance properties. It has various applications like manufacturing of camshafts, fasteners, gears, and chains/chain pins. The AISI-1018 low carbon alloy steel rod of the length of 1080 mm and diameter of 30 mm size is mounted on the power hacksaw machine tool and specimens of the length 40 mm and diameter of 30 mm size are cut. The rod used for cutting the specimens is mounted on the machine. The final dimension of the specimens after cutting is of Ø30 X 40 mm.
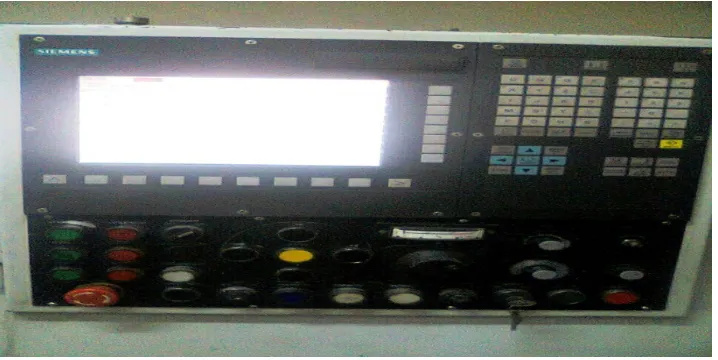
Figure3.2: Controller of CNC Lathe machine
© IJERGS, All Rights Reserved.
Pag
e
24
Pag
e
24
Pag
e
24
Pag
e
24
Pag
e
24
Pag
e
24
Pag
e
24
Pag
e
24
Pag
e
24
Pag
e
24
Pag
e
24
Pag
e
24
Pag
e
24
Pag
e
24
Pag
e
24
Pag
e
24
Pag
e
24
Pag
e
24
Pag
e
24
Pag
e
24
Pag
e
24
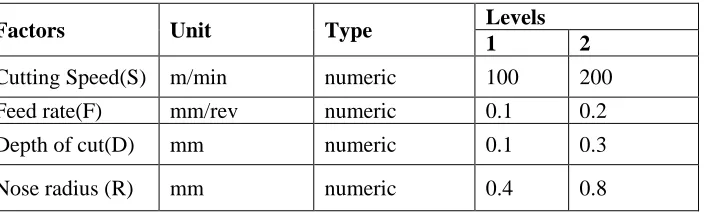
Table 2.1: Factors and levels of independent variables
Table 2.2 shows the design matrix based on orthogonal array with interaction column. The complete design layout for all experiments is in table 2.3. This demonstrates a total of 16 runs required for complete experiments.
Table 2.2: Design matrix based on orthogonal array with interaction column.
Exp. no. Cutting Speed(S) Feed rate(F) Depth of cut(D) Nose radius (R)
1 1 1 1 1
2 1 1 1 2
3 1 1 2 1
4 1 1 2 2
5 1 2 1 1
6 1 2 1 2
7 1 2 2 1
8 1 2 2 2
9 2 1 1 1
10 2 1 1 2
11 2 1 2 1
12 2 1 2 2
13 2 2 1 1
14 2 2 1 2
15 2 2 2 1
16 2 2 2 2
Table 2.3: Complete design layout
Factors Unit Type Levels
1 2
Cutting Speed(S) m/min numeric 100 200
Feed rate(F) mm/rev numeric 0.1 0.2
Depth of cut(D) mm numeric 0.1 0.3
Nose radius (R) mm numeric 0.4 0.8
Exp. no. Cutting Speed(S) Feed rate(F) Depth of cut(D) Nose radius (R)
1 100 0.1 0.1 0.4
2 100 0.1 0.1 0.8
3 100 0.1 0.3 0.4
4 100 0.1 0.3 0.8
5 100 0.2 0.1 0.4
6 100 0.2 0.1 0.8
7 100 0.2 0.3 0.4
8 100 0.2 0.3 0.8
9 200 0.1 0.1 0.4
10 200 0.1 0.1 0.8
11 200 0.1 0.3 0.4
12 200 0.1 0.3 0.8
13 200 0.2 0.1 0.4
© IJERGS, All Rights Reserved.
Pag
e
25
Pag
e
25
Pag
e
25
Pag
e
25
Pag
e
25
Pag
e
25
Pag
e
25
Pag
e
25
Pag
e
25
Pag
e
25
Pag
e
25
Pag
e
25
Pag
e
25
Pag
e
25
Pag
e
25
Pag
e
25
Pag
e
25
Pag
e
25
Pag
e
25
Pag
e
25
Pag
e
25
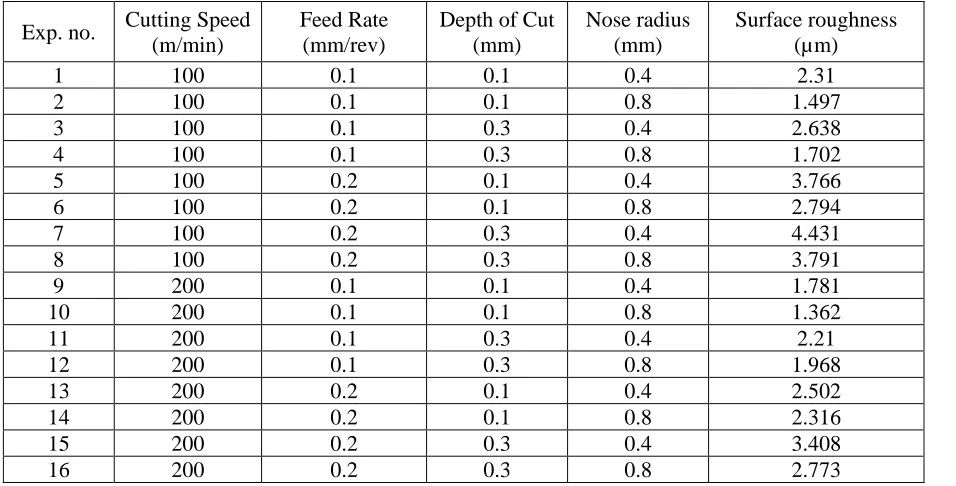
Table 2.4: Experimental results for surface roughness
Exp. no. Cutting Speed (m/min)
Feed Rate (mm/rev)
Depth of Cut (mm)
Nose radius (mm)
Surface roughness (µm)
1 100 0.1 0.1 0.4 2.31
2 100 0.1 0.1 0.8 1.497
3 100 0.1 0.3 0.4 2.638
4 100 0.1 0.3 0.8 1.702
5 100 0.2 0.1 0.4 3.766
6 100 0.2 0.1 0.8 2.794
7 100 0.2 0.3 0.4 4.431
8 100 0.2 0.3 0.8 3.791
9 200 0.1 0.1 0.4 1.781
10 200 0.1 0.1 0.8 1.362
11 200 0.1 0.3 0.4 2.21
12 200 0.1 0.3 0.8 1.968
13 200 0.2 0.1 0.4 2.502
14 200 0.2 0.1 0.8 2.316
15 200 0.2 0.3 0.4 3.408
16 200 0.2 0.3 0.8 2.773
Table 2.4 shows the measured values of surface roughness. The surface roughness of finished turned work piece has been measured making use of a portable surface tester (Surtronic 25) and the readings were recorded with three times repeated measurements.
3. RESULT AND ANALYSIS
A total number of 16 turning experiments were performed as per experimental plan shown in table 2.4. These results are further examined in MINITAB software. After the examination of ANOVA, results show that the parameters are important for response and therefore results are used for further examination.
ANOVA FOR MEAN FOR SURFACE ROUGHNESS
The ANOVA has been carried out for a significance level of α = 0.05, i.e. for a confidence level of 95%. The first step of
ANOVA is to check the assumptions of ANOVA.
The analysis of variance (ANOVA) is based on two assumptions.
(1) The variables are normally distributed
(2) Homogeneity of variance.
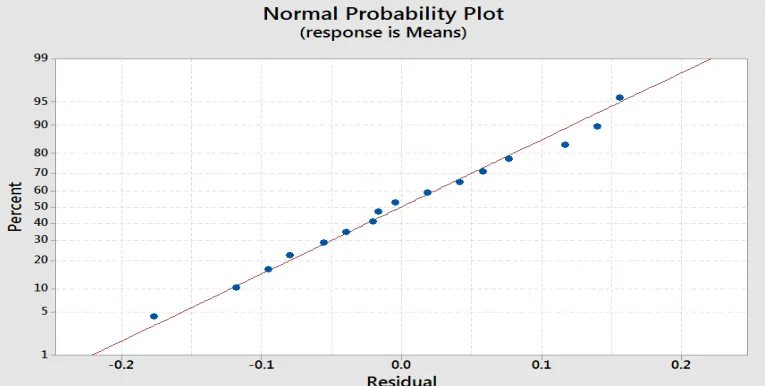
To check the assumption of normal distribution, the normal probability plot of the residuals for surface roughness is shown in figure 3.1.The normal probability plot indicates whether the residuals follow a normal distribution or not, if the residuals follow a normal distribution majority of points will follow a straight line except some moderate scatter even with normal data. The figure displays that the residuals generally fall on a straight line implying that the errors are distributed normally.
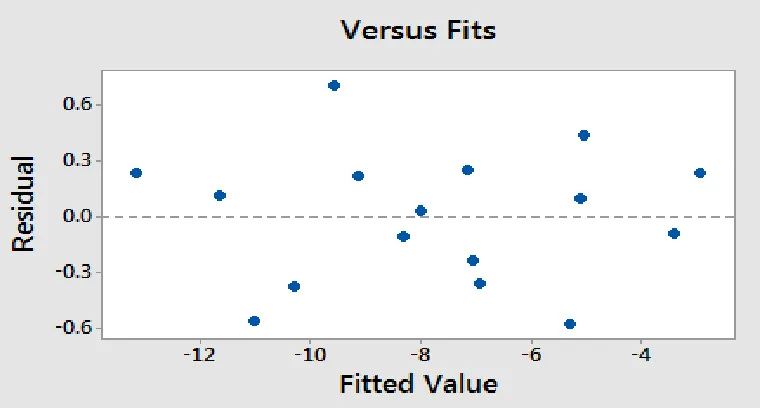
The figure 3.2 represents residuals versus the predicted surface roughness plot. It tests the assumption of constant variance. The plot should be a random scatter. The figure shows that there is no obvious pattern and it shows unusual structure. This implies that there is no reason to suspect any violation of the independence or constant variance assumption.
15 200 0.2 0.3 0.4
© IJERGS, All Rights Reserved.
Pag
e
26
Pag
e
26
Pag
e
26
Pag
e
26
Pag
e
26
Pag
e
26
Pag
e
26
Pag
e
26
Pag
e
26
Pag
e
26
Pag
e
26
Pag
e
26
Pag
e
26
Pag
e
26
Pag
e
26
Pag
e
26
Pag
e
26
Pag
e
26
Pag
e
26
Pag
e
26
Pag
e
26
Figure 3.1 Normal probability plot of residuals for surface roughness
Fig. 3.2 Plot of residuals v/s predicted surface roughness
ANOVA TABLE FOR MEAN FOR SURFACE ROUGHNESS
As mention above, in this work the ANOVA was carried out for a significance level of α = 0.05, i.e. for a confidence level
of 95%. The ANOVA for mean for surface roughness is summarized in Table 3.1. Table.3.1 Resulting ANOVA table for surface roughness
Source Degree of
freedom
Seq. sum of squares
Adj. mean square F-Value
p-value Prob > F
Speed 1 1.3277 1.3277 49.2 0.001
Feed 1 6.657 6.657 246.32 0.001
depth of cut 1 1.318 1.318 48.86 0.001
Nose radius 1 1.466 1.466 54.32 0.001
Speed*Feed 1 0.546 0.546 20.25 0.006
Speed*depth of cut 1 0.0026 0.0026 0.1 0.77
Speed*Nose radius 1 0.221 0.221 8.18 0.035
Feed*depth of cut 1 0.133 0.133 4.92 0.047
Feed*Nose radius 1 0.00031 0.00031 0.001 0.97
depth of cut*Nose radius 1 0.00025 0.00025 0.01 0.92
Residual Error 5 0.135 0.027
© IJERGS, All Rights Reserved.
Pag
e
27
Pag
e
27
Pag
e
27
Pag
e
27
Pag
e
27
Pag
e
27
Pag
e
27
Pag
e
27
Pag
e
27
Pag
e
27
Pag
e
27
Pag
e
27
Pag
e
27
Pag
e
27
Pag
e
27
Pag
e
27
Pag
e
27
Pag
e
27
Pag
e
27
Pag
e
27
Pag
e
27
The table 3.1, shows that the value of “Prob. > F” for speed is less than 0.0001 which is less than 0.05, that indicates the speed is significant.
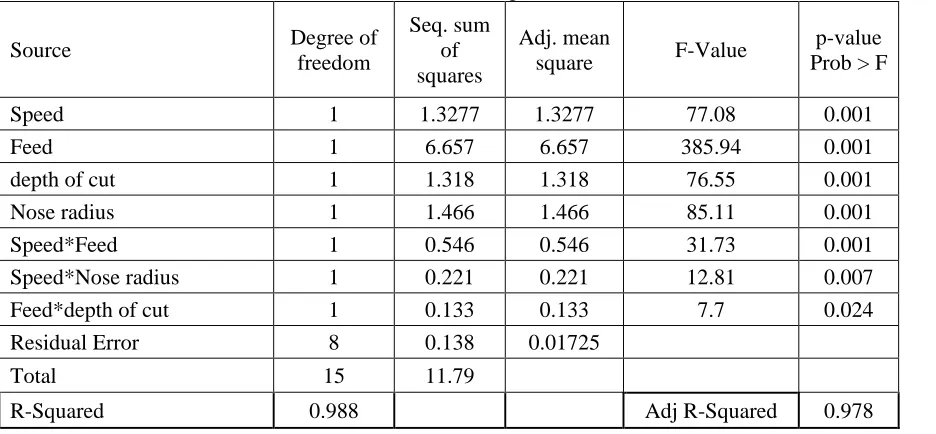
Table 3.2 Reduce ANOVA table for mean for surface roughness
Source Degree of
freedom
Seq. sum of squares
Adj. mean
square F-Value
p-value Prob > F
Speed 1 1.3277 1.3277 77.08 0.001
Feed 1 6.657 6.657 385.94 0.001
depth of cut 1 1.318 1.318 76.55 0.001
Nose radius 1 1.466 1.466 85.11 0.001
Speed*Feed 1 0.546 0.546 31.73 0.001
Speed*Nose radius 1 0.221 0.221 12.81 0.007
Feed*depth of cut 1 0.133 0.133 7.7 0.024
Residual Error 8 0.138 0.01725
Total 15 11.79
R-Squared 0.988 Adj R-Squared 0.978
The table 3.2, shows the reduce ANOVA table for mean for surface roughness after elimination of insignificant model terms. From the table it is clear that the value of “Prob. > F” for main effect of speed, feed, depth of cut, nose radius and two-level interaction of speed and feed; speed and nose radius; feed and depth of cut are less than 0.05 so these terms are still significant model terms after elimination of insignificant terms.
MINIMIZATION OF SURFACE ROUGHNESS
Table 3.3 presents the difference between the maximum and the minimum value of the turning parameters for surface roughness values. The most effective factor affecting performance characteristics is obtained by comparing these values. This comparison gives the level of importance of controllable factors over the minimum surface roughness.
Table 3.3: Response table for surface roughness Level
Factors 1 2 Max.-Min.(Δ) Rank
Speed 2.866 2.29 0.576 3
Feed 1.934 3.223 1.289 1
depth of cut 2.291 2.865 0.574 4
nose radius 2.881 2.275 0.605 2
ANOVA FOR S/N RATIO FOR SURFACE ROUGHNESS
The S/N ratio for smaller the better is used for situation where the target value is zero, such as computer response time, automotive emission, corrosion, surface roughness, tool wear, etc. The equation for smaller the better ratio is
= - 10 log ( ) = - 10 log
The negative sign is used to ensure that the target value gives the best value for the response variable and therefore robust design. Mean standard deviation is given to display the relationship to the loss function.
© IJERGS, All Rights Reserved.
Pag
e
28
Pag
e
28
Pag
e
28
Pag
e
28
Pag
e
28
Pag
e
28
Pag
e
28
Pag
e
28
Pag
e
28
Pag
e
28
Pag
e
28
Pag
e
28
Pag
e
28
Pag
e
28
Pag
e
28
Pag
e
28
Pag
e
28
Pag
e
28
Pag
e
28
Pag
e
28
Pag
e
28
The normal probability plot of the residuals for S/N ratio for surface roughness is shown in figure 3.3.The normal probability plot indicates whether the residuals follow a normal distribution or not. The figure displays that the residuals generally fall on a straight line implying that the errors are distributed normally.
The figure 3.4 represents residuals versus the predicted S/N ratio for surface roughness plot. It tests the assumption of constant variance. The figure shows that there is no obvious pattern and it shows unusual structure. This implies that there is no reason to suspect any violation of the independence or constant variance assumption.
Figure 3.3 Normal probability plots of residuals for S/N ratio for surface roughness
Fig. 3.4 Plot of residuals v/s predicted S/N ratio for surface roughness ANOVA TABLE FOR S/N RATIO FOR SURFACE ROUGHNESS
As mention above, in this work, the ANOVA for S/N ratio for surface roughness has been carried out for a significance
level of α = 0.05, i.e. for a confidence level of 95%. . The ANOVA for S/N ratio for surface roughness is summarized in
the given Table 4.4
The table 3.4, shows that the value of “Prob. > F” for speed is less than 0.0001 which is less than 0.05, that indicates the speed is significant.
© IJERGS, All Rights Reserved.
Pag
e
29
Pag
e
29
Pag
e
29
Pag
e
29
Pag
e
29
Pag
e
29
Pag
e
29
Pag
e
29
Pag
e
29
Pag
e
29
Pag
e
29
Pag
e
29
Pag
e
29
Pag
e
29
Pag
e
29
Pag
e
29
Pag
e
29
Pag
e
29
Pag
e
29
Pag
e
29
Pag
e
29
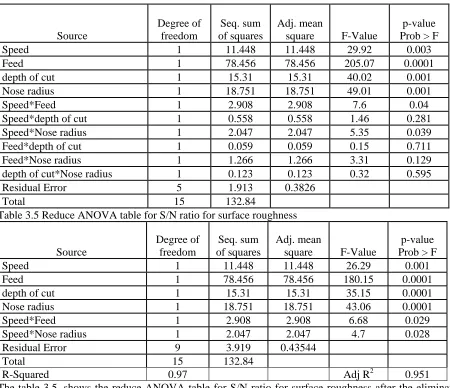
Source
Degree of freedom
Seq. sum of squares
Adj. mean square F-Value
p-value Prob > F
Speed 1 11.448 11.448 29.92 0.003
Feed 1 78.456 78.456 205.07 0.0001
depth of cut 1 15.31 15.31 40.02 0.001
Nose radius 1 18.751 18.751 49.01 0.001
Speed*Feed 1 2.908 2.908 7.6 0.04
Speed*depth of cut 1 0.558 0.558 1.46 0.281
Speed*Nose radius 1 2.047 2.047 5.35 0.039
Feed*depth of cut 1 0.059 0.059 0.15 0.711
Feed*Nose radius 1 1.266 1.266 3.31 0.129
depth of cut*Nose radius 1 0.123 0.123 0.32 0.595
Residual Error 5 1.913 0.3826
Total 15 132.84
Table 3.5 Reduce ANOVA table for S/N ratio for surface roughness
Source
Degree of freedom
Seq. sum of squares
Adj. mean square F-Value
p-value Prob > F
Speed 1 11.448 11.448 26.29 0.001
Feed 1 78.456 78.456 180.15 0.0001
depth of cut 1 15.31 15.31 35.15 0.0001
Nose radius 1 18.751 18.751 43.06 0.0001
Speed*Feed 1 2.908 2.908 6.68 0.029
Speed*Nose radius 1 2.047 2.047 4.7 0.028
Residual Error 9 3.919 0.43544
Total 15 132.84
R-Squared 0.97 Adj R2 0.951
The table 3.5, shows the reduce ANOVA table for S/N ratio for surface roughness after the elimination of insignificant model terms. From the table it is clear that the value of “Prob. > F” for main effect of speed, feed, depth of cut, nose radius and two-level interaction of speed and feed; speed and nose radius are less than 0.05 so these terms are still significant model terms after elimination of insignificant terms.
MINIMIZATION OF SURFACE ROUGHNESS USING S/N RATIO
Table 3.6 presents the difference between the maximum and the minimum value of the turning parameters for S/N ratio for surface roughness values. The most effective factor affecting performance characteristics is obtained by comparing these values. This comparison gives the level of importance of controllable factors over the minimum surface roughness. The most effective controllable factor corresponds to the maximum of these values. Thus the feed has been found most significant parameter that affects the surface roughness followed by nose radius, speed and depth of cut. Same results has been obtained as obtained through means for surface roughness
Table 3.6: Response table for S/N ratio (minimum is best) for surface roughness
Level
Factors 1 2 Max.-Min.(Δ) Rank
Speed -8.596 -6.904 1.692 3
Feed -5.536 -9.965 4.429 1
depth of cut -6.722 -8.228 1.506 4
nose radius -8.833 -6.668 2.165 2
© IJERGS, All Rights Reserved.
Pag
e
30
Pag
e
30
Pag
e
30
Pag
e
30
Pag
e
30
Pag
e
30
Pag
e
30
Pag
e
30
Pag
e
30
Pag
e
30
Pag
e
30
Pag
e
30
Pag
e
30
Pag
e
30
Pag
e
30
Pag
e
30
Pag
e
30
Pag
e
30
Pag
e
30
Pag
e
30
Pag
e
30
To investigate the effect of turning parameters on surface roughness, different curves (main effect and interactions) have been plotted between the turning parameters and response.
EFFECT OF TURNING PARAMETERS ON SURFACE ROUGHNESS
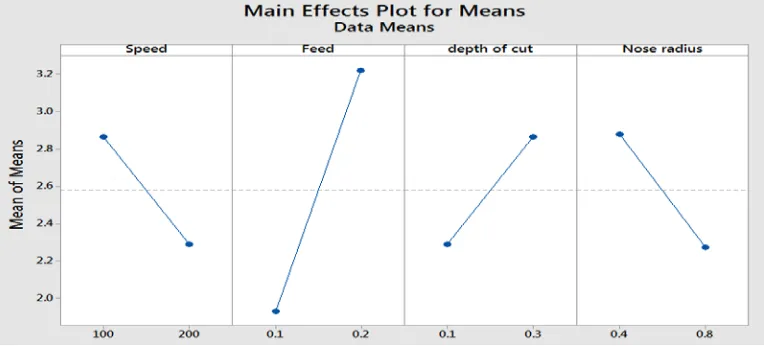
Influence of turning parameters on surface roughness is shown in fig. 3.1. The result shows that the surface roughness continuously decreases as the cutting speed increases from 100 m/min to 200 m/min because as the cutting speed increases, temperature during cutting also increases, which soften the material to enhance the cutting performance leading to reduced surface roughness. The figure between the feed and surface roughness shows that the surface roughness continuously increases as the feed increase from 0.1mm/rev to 0.2 mm/rev. This is due to the fact that at higher feed rate, tool traverses the work piece too fast, resulting in deteriorated surface quality and also high feed increase the chatter, which leads to higher surface roughness. Influence of depth of cut on surface roughness is shown in fig. 3.1. It is clear from the plot that as the depth of cut increases from 0.1 mm to 0.3 mm the value of surface roughness also increases. This result is due to the fact that, as the depth of cut increased, the tool displacement is bigger along the machined surface, removing a higher amount of material, making the furrows deeper and broader. The influence of nose radius on surface roughness has also been shown in figure 3.1. It is visible from the plot that as the nose radius increases from 0.4 mm to 0.8 mm, the value of surface roughness decreases.
Fig. 3.1 Plot between surface roughness and turning parameters
4. CONCLUSION
Turning experiments were conducted on a CNC lathe machine using carbide cutting tool on AISI1018 low carbon alloy steel as work material. L16 orthogonal array was used for different combinations of turning experiments. The surface roughness was selected as responses under different cutting conditions for combinations of turning parameters. The present work successfully demonstrated the application of taguchi optimization of process parameters in turning of AISI 1018 low carbon alloy steel.
The important conclusions drawn from the present work are summarized as follows:
1. Feed is the main significant parameter for surface roughness.
2. The order of importance of the controllable factors to surface roughness in the turning parameters can be listed in sequence: feed, nose radius, cutting speed, and depth of cut.
3. The increase in cutting speed produces better surface finish (i.e. surface roughness). 4. The increase in nose radius produces better surface finish (i.e. surface roughness). 5. The decrease in feed produces better surface finish (i.e. surface roughness).
6. The decrease in depth of cut produces better surface finish (i.e. surface roughness).
© IJERGS, All Rights Reserved.
Pag
e
31
Pag
e
31
Pag
e
31
Pag
e
31
Pag
e
31
Pag
e
31
Pag
e
31
Pag
e
31
Pag
e
31
Pag
e
31
Pag
e
31
Pag
e
31
Pag
e
31
Pag
e
31
Pag
e
31
Pag
e
31
Pag
e
31
Pag
e
31
Pag
e
31
Pag
e
31
Pag
e
31
8. The experimental results for optimal setting show that there is a considerable improvement in the performance characteristics of machining process. This technique does not involve any complicated theory and thus can be employed by the engineers without a strong statistical background.
5. REFERENCES
[1]. Thiele Jeffrey D. and Melkote Shreyes N. (1999). “Effect of cutting edge geometry and work piece hardness on surface generation in the finish hard turning of AISI 52100 steel”, Journal of Materials Processing Technology, Vol.94, pp. 216-226.
[2]. RechJ. and MoisanA. (2002). “Surface integrity in finish hard turning of case hardened steels”, International Journal
of Machine Tools and Manufacture, Vol.43, pp. 543-550.
[3]. Chou Y.Kevin, Evans Chris J. and BarashMoshe M. (2002), “Experimental investigation on CBN turning of hardened AISI 52100 steel”, Journal of Materials Processing Technology, Vol. 124, pp. 274-283.
[4]. BengaGabriel C. and AbraoAlexandre M. (2003). “Turning of hardened 100Cr6 bearing steel with ceramic and PCBN cutting tools”, Journal of Material Processing Technology, Vol.143, pp. 237-241.
[5]. Noordin N.Y, Venkatesh V.C., Sharif S., EltingS. and Abdullah A. (2004). “Application of response surface methodology in describing the performance of coated carbide tools when turning AISI 1045 steel”, Journal of Materials
Processing Technology, Vol.145, pp. 46-58.
[6]. Jiao Yue, Lie Shuting, Pei Z.J. and Lee E.S. (2004). “Fuzzy adaptive networks in machining process modeling: surface roughness prediction for turning operations”, International Journal of Machine Tools and Manufacture, Vol. 44, pp. 1643-1651.
[7]. Sahin Yusuf and Motorcu A.Riza (2005). “Surface roughness model for machining mild steel with coated carbide tool”, Journal on Materials and Design, Vol. 26, pp. 321-326.
[8]. GrzesikW. and WanatT. (2005). “Comparative assessment of surface roughness produced by hard machining with mixed ceramic tools including 2D AND 3D analysis”, Journal of Materials Processing Technology, Vol. 169, pp. 364-371.
[9]. Dhar N.R and Kamruzzaman M. (2006). “Cutting temperature, tool wear, surface roughness and dimensional deviation in turning AISI 4037 steel under cryogenic condition”, International Journal of Machine Tools Manufacture, Vol. 47, pp. 754-759.
[10]. Davim J.Paulo and Figueira Luis (2006). “Machinability evaluation in hard turning of cold work tool steel (D2) with ceramic tools using statistical techniques”, Journal on Materials and Design, Vol. 28, pp. 1186-1191.
[11]. Dhar N.R, Kamruzzaman M. and Ahmed Mahiuddin (2006), “Effect of minimum lubrication on tool wear and surface roughness in turning AISI 4340 steel”, Journal of Material Processing Technology, Vol. 172, pp. 29-304.
[12]. Thamizhmanii S, Kamarudin K., Rahim E.A., SaparudinA. and Hassan S. (2007). “Tool wear and surface roughness in turning AISI 8620 using coated ceramic tool”, Proceedings of the World Congress on Engineering, Vol. 2.
[13]. Marines-Garcia Israel, Paris Paul C., Tada Hiroshi and Bathias Claude (2007), “Fatigue crack growth from small to long cracks in very high cycle fatigue with surface internal “fish eye” failures for ferrite – perlitic low carbon steel SAE 8620”, Journal on Materials Science and Engineering, Vol. 468-470, pp. 120-128.
[14]. Asi Osman, Can Ahmet Cetin, Pineault James and Belassel Mohammed (2007), “The relationship between case depth an bending fatigue strength of gas carburized SAE 8620 steel”, Journals on Surface and coating technology, Vol. 201, pp. 5979-5987.
[15]. Ozel Tugrul, Karpat Yigit, Figueira Luis and Davim J.Paulo (2007). “Modeling of surface finish and tool flank wear in turning of AISI D2 steel with ceramic wiper inserts”, Journal on Materials Processing Technology, Vol. 189, pp. 192-198.
[16]. WaikarR.A. and Guo Y.B. (2008). “A comprehensive characterization of 3D surface topography induced by hard turning versus grinding”, Journal on Materials Processing Technology, Vol. 197, pp.189-199.
[17]. Aggarwal aman, singh Hari, kumar Pradeep and singh Manmohan (2008). “Optimization of multi quality characteristics for CNC turning under cryogenic cutting environment using desirability function”, Journal of Material
Processing Technology, Vol. 205, pp. 42-55.
[18]. Davim J.Paulo, Gaitonde V.N and Karnik S.R (2008). “Investigations into the effect of cutting conditions of surface in turning of free machining steel by ANN models”, Journal of Materials Processing Technology, Vol.205, pp. 16-23. [19]. Tzeng Chorng-jyh, Lin Yu-Hsin, Yang Yung-Kuang and jeng Ming Chang (2008). “Optimization of turning operations with multi performance characteristics using the taguchi method and grey relational analysis”, Journal of
© IJERGS, All Rights Reserved.
Pag
e
32
Pag
e
32
Pag
e
32
Pag
e
32
Pag
e
32
Pag
e
32
Pag
e
32
Pag
e
32
Pag
e
32
Pag
e
32
Pag
e
32
Pag
e
32
Pag
e
32
Pag
e
32
Pag
e
32
Pag
e
32
Pag
e
32
Pag
e
32
Pag
e
32
Pag
e
32
Pag
e
32
[20]. Gaitonde V.N, karnik S.R, Figueira Luis and Davim J.Paulo (2009). “Machinability investigations in hard turning of AISI D2 cold work tool steel with conventional and wiper ceramic inserts”, International Journal of Refractory Metals
and Hard Materials, Vol. 27, pp. 754-763.
[21]. Asi Osman, Can Ahmet Cetiln, Pineault James and Belassel Mohammed (2009), “The effect of high temperature gas carburization on bending fatigue strength on SAE 8620 steel”, Journals on Material and Design, Vol. 30, pp. 1792-1797. [22]. Yin Fengjie, Fatemi Ali and Bonnen john (2010), “Variable amplitude fatigue behavior and life predictions of case hardened steels”, International journal of fatigue, Vol. 32, pp. 1126-1135.
[23]. Asilturk Ilhan and Akkus Harun (2011). “Determining the effect of cutting parameters on surface roughness in hard turning using the taguchi method”, Journal on Measurement, Vol. 44, pp. 1697-1704.
[24]. Singh Hardeep, Khanna Rajesh and Garg M.P. (2011), “Effect of cutting parameters on material removal rate and surface roughness in turning EN-8”, International Journal of Current Engineering and Technology, ISSN 2277-4106. [25]. Correia A.Esteves and Davim J.Paulo (2011). “Surface roughness measurement in turning carbon steel AISI 1045 using wiper inserts”, Journal on Measurement, Vol. 44, pp. 1000-1005.
[26]. Asilturk Ilhan and Neseli Suleyman (2012). “Multi response optimization of CNC turning parameters via taguchi method based response surface analysis”, Journal on Measurement, Vol. 45, pp. 785-794.
[27]. Aouici Hamdi, Yallese Mohamed Athmane, Chaoui Kamel and Mabrouki Tarek (2012). “Analysis of surface roughness and cutting force components in hard turning with CBN tool: Prediction model and cutting conditions optimization”, Journal on Measurement, Vol. 45, pp. 344-353.
[28]. Suresh R., BasavarajappaS. and Samuel G.L. (2012). “Some studies on hard turning of AISI 4340 steel using multilayer coated carbide tool”, Journal on Measurement, Vol.45, pp. 1872-1884.
[29]. Saravanakumar K., Pratheesh M.R. and Dawood Dr.A.K.Shaik (2012), “Optimization of CNC turning process parameters on INCONEL 718 using genetic algorithm”, International Journal of Engineering Science and Technology, Vol. 2. ISSN 2250-3498.
[30]. Bartarya Gaurav and S.K (2012), “State of the art in hard turning”, International Journal of Machine Tools and
Manufacture, Vol.53, pp.1-14.
[31]. Elbah Mohamed, Yallese Mohamed Athmane, Aouici Hamdi and Mabrouki Tarek (2013), “Comparative assessment of wiper and conventional ceramic tools on surface roughness in hard turning AISI 4140 steel”, Journal on Measurement, Vol. 46, pp. 3041-3056.
[32]. Prajapati Navneet K. and Patel S.M. (2013), “Optimization of process parameters for surface roughness and material removal rate for SS 316 on CNC turning machine”, International Journal of Research in Modern Engineering and
Emerging Technology, Vol. 1, ISSN 2320-6586.
[33]. Hessainaria Zahia, Belbah Ahmed, Yallese Mohamed Athmane, Mabrouki Tarek and Rigal Jean Francois (2013), “On the prediction of hard turning based on cutting parameters and tool vibrations”, Journal on Measurement, Vol. 46, pp. 1671-1681.
[34]. Francis Vishal, Singh Ravi.S., Singh Nikita, RizviAli.R. and Kumar Santosh (2013), “Application of taguchi method and ANOVA in optimization of cutting parameters for material removal rate and surface roughness in turning operation”,
International journal of Mechanical Engineering and Technology, Vol. 4, pp. 47-53.
[35]. Selvaraj D.Philip, ChandramohanP. and MohanrajM. (2014). “Optimization of surface roughness, cutting force and tool wear of nitrogen alloyed duplex stainless steel in a dry turning process using taguchi method”, Journal on
Measurement, Vol. 49, pp. 205-215.
[36]. Patel Hitesh, Patel Jigar and Patel Chandresh (2014), “A review on parametric optimization of surface roughness and material removal rate of AISI D2 steel using turning”, International Journal of Engineering Research and Applications, Vol. 4, pp. 135-138.
[37]. M S Ranganath, Vipin and Mishra R S (2014), “Optimization of surface roughness and material removal rate on conventional dry turning of aluminium (6061)”, International Journal of Advance Research and Innovation, Vol. 1, pp. 62-71.
[38]. Reddy K.Pavan Kumar, Reddy Y.Rameswara and VishnuvardhanR. (2014), “Optimization of surface roughness and material removal rate in turning operation using extended taguchi method”, International Journal of Engineering
Research, Vol. 3, pp. 92-96.
[39]. SahuMeenu and SahuKomesh (2014), “Optimization of cutting parameters on tool wear work piece surface temperature and material removal rate in turning AISI D2 steel ”, International Journal of Advance Mechanical
© IJERGS, All Rights Reserved.
Pag
e
33
Pag
e
33
Pag
e
33
Pag
e
33
Pag
e
33
Pag
e
33
Pag
e
33
Pag
e
33
Pag
e
33
Pag
e
33
Pag
e
33
Pag
e
33
Pag
e
33
Pag
e
33
Pag
e
33
Pag
e
33
Pag
e
33
Pag
e
33
Pag
e
33
Pag
e
33
Pag
e
33
[40]. AlagarsamyS.V. and RajakumarN. (2014), “Analysis of influence of turning process parameters on material removal rate and surface roughness of AA7075 using taguchi’s method and response surface methodology”, International Journal