Suat Doganci
1, A, C, D, F, Vedat Yildirim
2, B–D, Cengiz Bolcal
1, B, C, Petek Korkusuz
3, B,
Ahmet Aydin
4, C, E, Bulent Gumusel
5, C, F, Ufuk Demirkilic
1, A, E, FSodium Nitrite and Cardioprotective Effect in Pig
Regional Myocardial Ischemia–Reperfusion Injury
Model
Azotyn sodu i jego działanie kardioprotekcyjne na miejscowe
niedokrwienie–reperfuzję mięśnia sercowego na modelu świńskim
1 Gulhane Military Academy of Medicine, Department of Cardiovascular Surgery, Ankara, Turkey 2 Gulhane Military Academy of Medicine, Department of Anesthesiology, Ankara, Turkey 3 Hacettepe University, Faculty of Medicine, Department of Histology, Ankara, Turkey 4 Gulhane Military Academy of Medicine, Department of Toxicology, Ankara, Turkey 5 Hacettepe University, Faculty of Pharmacy, Department of Pharmacology, Ankara, Turkey
A – research concept and design; B – collection and/or assembly of data; C – data analysis and interpretation;
D – writing the article; E – critical revision of the article; F – final approval of article; G – other
Abstract
Objectives. Thepresent study was designed to investigate the cardioprotective effect of sodium nitrite (NaNO2) and sodium nitrate (NaNO3) against myocardial ischemia–reperfusion (I/R) injury in a pig regional ischemia model.
Material and Methods. Eighteen pigs were randomly divided into three groups as control (Group 1), sodium nitrite (Group 2) and sodium nitrate (Group 3) groups. Before the exploration of the heart, blood samplings were taken for alanine aminotranspherase (ALT), aspartate aminotranspherase (AST), lactate dehydrogenase (LDH), creatinine kinase–muscle band (CK-MB), troponin-t, glutathione peroxidase (GPx), superoxide dismutase (SOD), catalase (CAT), malondialdehyde (MDA) and nitrite/nitrate (NO2–/NO3–) in all groups (T0). Following sternotomy and stabilization, blood and tissue samples were repeated (T1). Then, intracoronary sodium nitrite and sodium nitrate were given (0.5 µg/kg) in Groups 2 and 3. Five minutes later, the left anterior descending (LAD) artery was ligated for I/R experiments. Blood and tissue samplings were repeated after 60 minutes of ischemia (T2) and 180 minutes of reperfusion period (T3). Light and electron microscopic investigations were performed.
Results. There were statistically significant results in favor of Group 2 in all studied parameters. Hemodynamic parameters showed a decrease in mean arterial pressure (MAP), cardiac output (CO), cardiac index (CI) and an increase in heart rate, mean pulmonary artery pressure (MPAP), left ventricle end-diastolic pressure (LVEDP), pulmonary capillary wedge pressure (PCWP) during ischemia. Following the ischemia these parameters returned to their near normal levels. This was prominent in group 2. Oxidative parameters showed protective increases in GPx, SOD, CAT and NO2–/NO3– levels and a decrease at MDA both in tissue and blood samples in group 2. There were statistical differences only in T3 for AST, troponin-t and CK-MB levels in favor of Group 2. Histological and electron microscopy examinations were also in favor of NO2– group.
Conclusions. The results of the present study indicate that NaNO2 provides protection against myocardial I/R injury when compared to control and NaNO3 groups (Adv Clin Exp Med 2012, 21, 6, 713–726).
Key words: sodium nitrite, myocardium, ischemia-reperfusion injury.
Streszczenie
Cel pracy. Zbadanie działania kardioprotekcyjnego azotynu sodu (NaNO2) i azotanu sodu (NaNO3) na niedokrwienie–reperfuzję mięśnia sercowego na modelu świńskim.
Materiał i metody. 18 świń losowo podzielono na 3 grupy: kontrolną (grupa 1), azotyn sodu (grupa 2) i azotan sodu (grupa 3). Przed otwarciem serca pobrano próbki krwi do oznaczenia aminotransferazy alaninowej (ALT), aminotransferazy asparaginianowej (AST), dehydrogenazy mleczanowej (LDH), izoenzymu MB kinazy kreatyniny
Adv Clin Exp Med 2012, 21, 6, 713–726 ISSN 1899–5276
ORIGINAL PAPERS
Administration of nitric oxide (NO) or NO donors prior to ischemia attenuates the negative consequences of myocardial ischemia/reperfu-sion (I/R). [1] As Gladwin and Desfluian pointed
out “Nitrite (NO2–), historically considered inert,
functions as a reservoir for NO. During physio-logical hypoxia and pathophysio-logical ischemia, nitrite is reduced to NO, regulating hypoxic vasodilation, cellular respiration, mitochondrial reactive oxy-gen species (ROS) oxy-generation, angiooxy-genesis, and cellular death programs. Nitrite in human plasma exists at concentrations of 100 to 300 nmol/L and may be reduced to NO by iron-containing en-zymes, including hemoglobin, myoglobin, neu-roglobin, xanthine oxidoreductase, endothelial NO synthase, mitochondrial electron transport chain proteins, and the hepatic cytochrome P450 system. The rate and extent of nitrite reduction are coupled to deoxygenation and proton genera-tion. Thus, NO generation is coupled to oxygen and pH gradients and maximized in ischemic tis-sues” [2, 3].
Gladwin and Desfluian also wrote: “Nitrite therapy limits cellular injury and apoptosis after ischemia and reperfusion. Nitrite therapy is cy-toprotective in numerous animal models of fo-cal ischemia/reperfusion injury, including rodent heart, brain, liver, and kidney, canine heart, and primate brain. Systemic nitrite reduction by ce-ruloplasmin knockout or dietary nitrate/nitrite elimination increased infarction volume in the liver and heart after experimental ischemia. These studies indicate that physiological systemic nitrite levels modulate host resilience to ischemia” [2, 3].
In the present study, the authors aimed to
investigate the cardioprotective effect of NaNO2
in a pig regional myocardial I/R model and
com-pared with the effects of NaN03.
Material and Methods
The experiment was performed in compliance with the “Principles of Laboratory Animal Care” formulated by the National Institutes of Health (National Institutes of Health publication no. 85-23, revised 1996). The experiment protocol was ap-proved by the Ethics Committee for Animal Care, established in authors’ institute (006/AR20).
Open-Chest Pig Experiment
Protocol
Porcine of male gender (n = 18), mean weights 62 ± 16 kg (ranging from 49–83) were randomly divided into three groups. The first group was the control group (Group 1), the second group was
NaNO2 group (Group 2) and the third group was
NaNO3 (Group 3). All the pigs were premedicated
by intramuscular ketamine (20 mg/kg), mida-zolam (0.1 mg/kg), and atropine (0.25 mg) and placed in the supine position. Anesthesia was in-duced with midazolam (0.1 mg/kg) plus sufentanil (0.5 μg/kg) and was maintained with intravenous sufentanil (0.5 μg/kg/h) and midazolam (0.15 mg/ /kg/h) infusions. Muscle paralysis was achieved with vecuronium bromide (1 mg/kg) and main-tained with vecuronium (2 mg/kg/h) infusions. The lungs were mechanically ventilated via a No. 9 cuffed endotracheal tube (Kendall Curity Tracheal Tube, Tyco Healthcare, Switzerland) with a Servo ventilator 900 C (Siemens, Elema, Sweden). A ven-tilator was set to deliver forced inspiratory oxygen
(FiO2) of 0.4, tidal volume between 12 and 15 mL/kg,
and respiratory rate adjusted to maintain partial pressure of carbondioxide in arterial blood
(Pa-CO2) in the range of 35 to 40 mm Hg. Positive
end-expiratory pressure of 5 cmH2O was used to
prevent atelectasis. Sevoflurane was administered
(CK-MB), troponiny-T, peroksydazy glutationowej (GPx), dysmutazy ponadtlenkowej (SOD), katalazy (CAT), aldehydu malonowego (MDA) i azotynów/azotanów (NO2–/NO3–) we wszystkich grupach (T0). Po sternotomii i sta-bilizacji ponownie pobrano próbki krwi i tkanek (T1). Następnie podano azotyn sodu i azotan sodu śródwieńcowo (0,5 μg/kg) w grupach 2 i 3. Pięć minut później sklejono tętnicę zstępującą przednią (LAD), aby przeprowadzić eksperyment I/R. Pobieranie próbek krwi i tkanek powtórzono po 60 min. w fazie niedokrwienia (T2) i po 180 min w fazie reperfuzji (T3). Wykonano badanie z użyciem mikroskopii optycznej i elektronowej.
Wyniki. Nie było istotnych statystycznie różnic na korzyść grupy 2 wszystkich badanych parametrów. Parametry hemodynamiczne wykazały zmniejszenie średniego ciśnienia tętniczego (MAP), rzutu serca (CO), wskaźnika ser-cowego (CI) i zwiększenie częstości akcji serca, średniego ciśnienia w tętnicy płucnej (MPAP), lewokomorowego ciśnienia końcowo-rozkurczowego (LVEDP), ciśnienia zaklinowania (PCWP) podczas niedokrwienia. Po niedo-krwieniu te wskaźniki wróciły prawie do normy. Było to widoczne w grupie 2. Wskaźniki oksydacyjne wykazały ochronne zwiększenie stężenia GPx, SOD, CAT i NO2–/NO3– i zmniejszenie MDA zarówno w tkance, jak i krwi w grupie 2. Nie było różnic statystycznych tylko w T3 dla stężenia AST, troponiny-T i CK-MB na korzyść grupy 2. Badania histologiczne i mikroskopia elektronowa były również korzystne dla grupy NO2–.
Wnioski. Wyniki badania wskazują, że NaNO2 chroni przed uszkodzeniem I/R mięśnia sercowego w porównaniu z grupą kontrolną i grupą NaNO3 (Adv Clin Exp Med 2012, 21, 6, 713–726).
with a vaporizer adapted to the ventilator. Inspired and expired fractions of oxygen, carbon dioxide, and sevoflurane were measured with an infrared spectrophotometer (Ultima II; Datex, Helsinki, Finland).
Sodium chloride (0.9% at 10 mL/kg/h) infu-sion via the left internal jugular vein was main-tained during surgery. The temperature was ad-justed to 38°C to 39°C with the help of an electrical heating pad. Invasive arterial pressure monitoring line catheter was placed into the right common il-iac artery for systemic arterial blood pressure and arterial blood sampling. Pulmonary artery catheter (Swan Ganz CCO/VIP; Edwards Lifesciences LLC, Irvine, Canada) was inserted through the right in-ternal jugular vein and positioned under pressure control in a branch of the pulmonary artery for measurement of mean pulmonary arterial pres-sure (MPAP), central venous prespres-sure (CVP), pul-monary capillary wedge pressure (PCWP), cardiac output (CO), cardiac index (CI), left ventricle end diastolic pressure (LVEDP). ECG was continu-ously recorded.
Following midline sternotomy, the heart was held in a pericardial tissue. Ultrasonic transit time flow probes were placed around the distal part of the left anterior descending (LAD) artery. A cath-eter was placed into the proximal part of LAD. This catheter was used both for real time coro-nary artery pressure monitoring and experimental drug administration. After having blood and tis-sue samplings (see involved part), same amounts
of isotonic sodium (Group 1), NaNO2 (0.5 µg/kg)
(Group 2), and NaNO3 (0.5 µg/kg) (Group 3)
ad-ministered thorough the catheter inside the LAD. All administered drugs were prepared by an an-esthesiologist in a transparent syringe with clear color. The surgeon was blinded to the drugs. After a five-minute period following the administration of the drugs, LAD was encircled with 4/0 prolene suture material from the 1/3 distal part and oc-cluded with the help of rubber snare in order to create ischemia. Ischemia was confirmed by mor-phological cyanosis and ST segment changes in the electrocardiogram. Following 60 minutes of isch-emia occlusion was released and 180 minutes of reperfusion period began. At the end of the reper-fusion period, pigs were sacrificed by using potas-sium chloride following the required samplings.
Tissue, Blood Sampling
At four time points (T0, T1, T2, T3) blood samplings and three time points (T1, T2, T3) tis-sue samplings were performed for alanine amin-otransferase (ALT), aspartate aminamin-otransferase (AST), lactate dehydrogenase (LDH), creatinine
kinase (CK-MB), troponin t (TNT), arterial blood gases, oxidative stress parameters (glutathion per-oxidase [GPx], superoxide dismutase [SOD], ma-londialdehyde [MDA], catalase and nitric oxide
[NO2–/NO3–]).
Tissue samples were taken from the anteroapi-cal part of the left ventricle for both oxidative stress parameter measurement and histopathological examination (light and electron microscopy) at all time points. First sampling from the heart was taken from an area away from the LAD artery in order not to disturb the LAD supplied area. The other samples were taken from the ischemic an-teroapical part of the left ventricle.
Blood and tissue samplings time points were as follows: T0: After the insertion of central venos line and arterial catheteterisation; T1: 30 minutes after the midline sternotomy (after a stabilization period); T2: After ischemic period; T3: After rep-erfusion period.
Blood and Tissue Sample
Analysis
The blood samples were collected in glass tubes containing additives and centrifuged at 4ºC with 3000 rpm for 5 minutes. Plasma was removed into tubes and stored at –70ºC until measurement. Erythrocytes were washed three times with two volumes of isotonic saline. Then, the erythrocytes were lysed with cold distilled water (1 : 4), stored in a refrigerator at 4ºC for 15 min., centrifuged at 4ºC with 2000 rpm for 15 min. Supernatant were removed and stored at –70ºC until measurement. Plasma samples were used for measurement of
NO2–/NO3– and MDA levels. Erythrocyte lysates
were used for measuring CAT, GPx and SOD ac-tivities. The tissue samples were stored in tubes not containing additives at –70 ºC. These samples were homogenized in cold potassium chloride solution (1.15%) in a glass homogenizer and
cen-trifuged at 4oC at 5000 × g. The supernatant was
removed and used for GPx and SOD activity, and
NO2–/NO3– and MDA level measurements.
GPx, SOD, nitrite/nitrate, and MDA measure-ments were performed according to the proce-dures explained in authors’ previous study [4].
Catalase
Erythrocyte CAT activity was measured in hemolysates at 25ºC by the method of Aebi. [5] The reaction mixture consisted of 0.05 mmol/l
phosphate buffer pH 7.0, 0.01 mmol/l H2O2 and
erythrocyte lysates. The decomposition rate of the
spectrophotomet-rically at 240 nm for 30 sec. The activity was
ex-pressed as MU/l. 1 unit is equal to 1 µmol of H2O2
decomposed/min.
Histological Examination
Light microscopical study
on paraffin sections
Tissue specimens were retrieved, fixed in 10% phosphate buffered formalin (pH 7.0) at room temperature, rinsed in buffer, and dehydrated in a graded series of ethanol before being embedded in paraffin. Five to seven micrometer thick sections were prepared with a rotary microtome (Microm, HM 360, Germany). Haematoxylin & Eosin, and Masson Trichrome stained sections were evaluated for overall cardiac muscle morphology and myo-cardial recovery. Stained sections (a minimum of ten sections obtained from different levels of each tissue) were examined by at least two independent investigators with a Leica DMR microscope (Ger-many). The images were captured via Leica DC500 digital camera (Germany).
Light and Transmission
Electronmicroscopical Study
on Plastic Sections
Tissue specimens were fixed in 2.5 percent glutaraldehyde in Sorensons’ phosphate buffer, rinsed in buffer and postfixed in 1 percent
osmi-um tetroxide in PBS at 4oC for 2 hours. Specimens
were dehydrated in graded series of ethanols to absolute ethanol in preparation for vacum embed-ding in araldite Cy 212 (Agar). Semi-thin sections were stained with methylene blue-AzurII; then they were examined and photographed via Leica DMR microcsope and digital camera in a same manner with paraffin sectins. Thin sections were stained with uranyl acetate and lead citrate and documented for subcellular organization of
car-diomyocyte by Carl Zeiss-910 modeltransmisson
electron microscope.
Statistical Analysis
SPSS version 15.0 (IL, Chicago, USA) software was used to perform statistical analysis. GLM-re-peated measures variance analysis test was used to compare group-timing interactions. Data was ex-pressed as mean ± standard deviation. The Bonfer-roni test was used as a post hoc analysis to identify
the difference between each group after detecting
the general difference. A P value of < 0.05 was
con-sidered significant.
Results
Hemodynamic Findings
There was no difference between groups for measured hemodynamic parameters at
pre-ischemic period (P > 0.05). With the beginning
of ischemic period there was a decrease in blood pressure, CO and an increase in heart rate, LVEDP and PCWP in all groups. At the reperfusion pe-riod, changes in the ischemic period partially re-turned to their pre-ischemic levels. This return to
pre-ischemic levels was most prominent in NO2-
-group. While the return to pre-ischemic levels
was almost 32 ± 5.2% in NO3– and control groups,
it was bigger than 65% in NO2– group (P < 0.05).
The data related with hemodynamic parameters was summarized in Table 1.
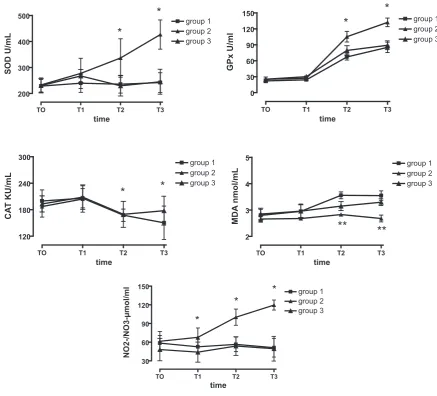
Oxidative Stress Parameter
Findings
Oxidative stress parameters were both studied at tissue and the blood level. At the blood level there were protective increases with the beginning of
the ischemic period at the SOD, GPx, CAT, NO2–/
/NO3– levels. However, during the reperfusion
pe-riod, these increases did not continue in control
and the NaNO3 groups. In NaNO2 group
protec-tive increases persisted also in the reperfusion period. When the groups were compared, there were statistically significant differences in favor of
NaNO2 group in T2 and T3 time points (Group 2
T2 and T3 time points for SOD levels: T2: 336.5
± 74.71, T3: 426.5 ± 56.33 U/ml, P < 0.001, GPx
levels: T2: 105.16 ± 10.18 U/ml, T3: 132.16 ± 8.3
U/ml, P < 0.001, CAT: T2: 309 ± 45.62 U/ml, T3:
359.66 ± 36.34 U/ml, P < 0.001, NO2–/NO3–: T2:
100.16 ± 13.04 µmol/ml, T3: 119.66 ± 8.04 µmol/
ml, P < 0.001). MDA levels are the cross-check
findings for the previous parameters. As a marker of lipid peroxidation MDA levels usually increase due to the cellular damage. In the present study in contrast to the previous parameters, there were statistically significant increases in groups 1 and 3 (Group 1 T2: 3.56 ± 0.13 Group 3: T2: 3.15 ± 0.17,
P < 0.05 Group 1 T3: 3.55 ± 0.18 nmol/ml, Group 3
T3: 3.3 ± 0.13 nmol/ml, P < 0.05). The increase was
(Group 2 T2: 2.83 ± 0.17 nmol/ml, T3: 2.68 ± 0.13 nmol/ml). When these results were compared with group 1 and 3, there were significant differences
in favor of NO2– group (Group 2 vs Group 1:P <
< 0.001, Group 2 vs. Group 3:P < 0.05). The
chang-es in four different time points in all studied pa-rameters were shown in Fig. 1.
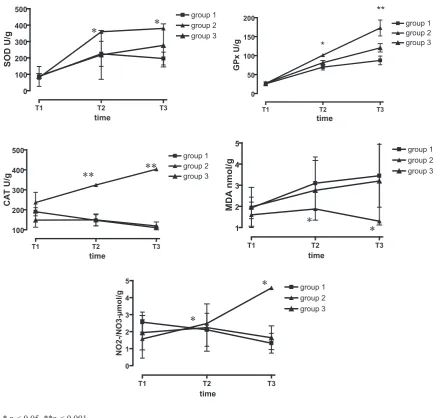
Tissue level findings were also similar to the blood level findings. While there were protective increases in post-ischemic and post-reperfusion measurements in SOD, GPx levels, this was the
most prominent in NO2– group (SOD: T1: 360.12
± 38.55 U/g T2: 380.33 ± 119.72 U/g [Group 2 vs
Group 1 and Group 2 vs Group 3, P < 0.05], GPx:
T1: 101.16 ± 10.59 U/g T2: 172.83 ± 31.22 U/g
[Group 2 vs Group 1: P < 0.05, Group 2 vs. Group
3: P < 0.001]). The changes were different for CAT,
NO2–/NO3– levels. With the beginning of the
isch-emic period there was no increase in these param-eters different form the blood levels. The only
in-crease was in the NO2 – group in CAT levels (T1:
324.33 ± 44.96 U/g, T2: 403,33 ± 34.65 U/g). There were significant differences from group 1 and group 3 in favor of group 2 (Group 2 vs. Group 1
and Group 2 vs. Group 3: P < 0.001). There was no
difference between group 1 and group 3 (P = 1.00).
For NO2–/NO3– levels, while there was a
progres-sive increase in nitrite group, there was a decrease in group 1 and a near decrease in group 3. The
dif-ference again was in favor of group 2 ([T1: 2.48 ± 1.9 µmol/g, T2: 4.57 ± 3.51 µmol/g] [Group 2 vs.
Grup 1 and Group 2 vs. Group 3: P < 0.05]). The
difference between group 1 and group 3 was not
significant (P = 0.888). Changes in the tissue MDA
levels were very similar in group 1 and group 3
(P = 0.303). There was a progressive increase in this
parameter. In group 2 following a slight increase in the post-ischemic period the levels returned to baseline levels. When groups compared, again there
was significant change in favor of NO2– group ([T1:
1.88 ± 0.98 nmol/g, T2: 1.3 ± 0.56 nmol/g] [Group 2
vs. Group 1 and Group 2 vs. Group 3: P < 0.05]).
The changes in the tissue level examinations were summarized in Fig. 2.
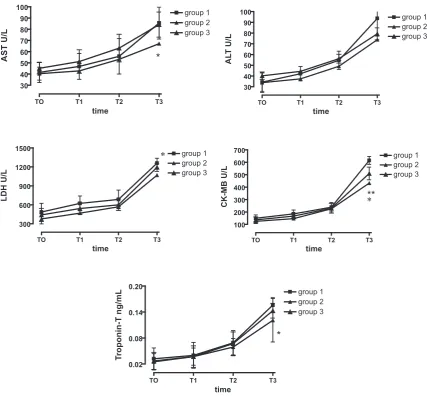
Cardiac Enzyme Findings
There was no statistically significant differ-ence in any timepoint for ALT assesment. There was only a significant difference for T3 measure-ment in favor of nitrite group when compared to other groups for AST (p < 0.05), LDH (Group 2 vs.
Group 1 P < 0.01, Group 2 vs Group 3 p > 0.05),
CK-MB (Group 2 vs. Group 1 P < 0.001, Group 2
vs. Group 3 P = 0.012) and TNT levels (Group 2 vs.
Group 1 and Group 1 vs. Group 3: P < 0.05, Group
2 vs. Group 3 P > 0.05). The changes in cardiac
enzyme levels were shown at Fig. 3. Table . Hemodynamic parameters
Tabela 1. Wskaźniki hemodynamiczne
Groups
(Grupy) Time (Czas) Hemodynamic parameters (Wskaźniki hemodynamiczne) MAP
mmHg HRbpm COl/min Cİl/min/m2 LVEDPmm Hg MPAPmm Hg PCWPmm Hg CVPmm Hg Group 1
(Grupa 1) pre-ischemia 96 ± 4.9 88 ± 7.3 3.9 ± 0.3 2.76 ± 0.2 11 ± 2.4 16 ± 2.8 11 ± 2.6 7 ± 1.7 post-ischemia 82 ± 6.3* 108 ± 11* 2.7 ± 0.4* 1.91 ± 0.3* 23 ± 3.1* 23 ± 3.1* 18 ± 3.2* 10 ± 2.0* post-reperfusion 93 ± 5.0 90 ± 6.6 3.1 ± 0.3 2.19 ± 0.1 14 ± 2.5 18 ± 3.2 14 ± 2.7 8 ± 1.9 Group 2
(Grupa 2) pre-ischemia 92 ± 4.2 91 ± 6.2 3.9 ± 0.4 2.6 ± 0.2 12 ± 2.0 15 ± 1.9 12 ± 1.9 8 ± 2.1 post-ischemia 86 ± 4.6* 107 ± 10.3* 3.2 ± 0.2* 2.13 ± 0.2* 20 ± 2.6* 20 ± 1.7* 19 ± 2.8* 11 ± 1.9 post-reperfusion 90 ± 3.7 89 ± 7.4 3.7 ± 0.3 2.5 ± 0.3 11 ± 2.2 14 ± 1.8 11 ± 2.1 9 ± 0.6 Group 3
(Grupa 3) pre-ischemia 94 ± 5.1 87 ± 7.6 3.8 ± 0.2 2.6 ± 0.3 10 ± 2.1 17 ± 2.1 10 ± 2.4 7 ± 2.3 post-ischemia 81 ± 6.1* 110 ± 9.2* 2.8 ± 0.3* 1.93 ± 0.2* 23 ± 2.7* 23 ± 2.0* 17 ± 3.3* 11 ± 2.1* post-reperfusion 92 ± 3.,9 90 ± 5.2 3.1 ± 0.2 2.13 ± 0.2 15 ± 2.3 18 ± 2.4 15 ± 2.1 8 ± 1.2 MAP – Mean arterial pressure, HR – Heart rate, CO – Cardiac output, CI – Cardiac index, LVEDP – Left ventricle enddiastolic pressure, MPAP – Mean pulmonary artery pressure, PCWP – Pulmonary capillary wedge pressure, CVP – Central venous pressure, bpm – beat per minute.
* P < 0.05.
MAP – średnie ciśnienie tętnicze, HR – tętno, CO – rzut serca, CI – wskaźnik sercowy, LVEDP – lewokomorowe ciśnienie końcowo- -rozkurczowe, MPAP – średnie ciśnienie w tętnicy płucnej, PCWP – ciśnienie zaklinowania, CVP – ośrodkowe ciśnienie żylne, bpm – uderzeń na minutę.
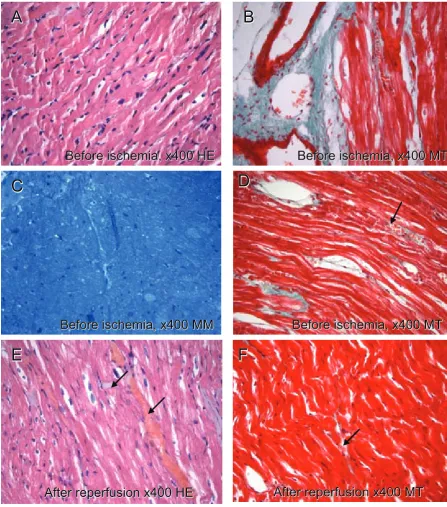
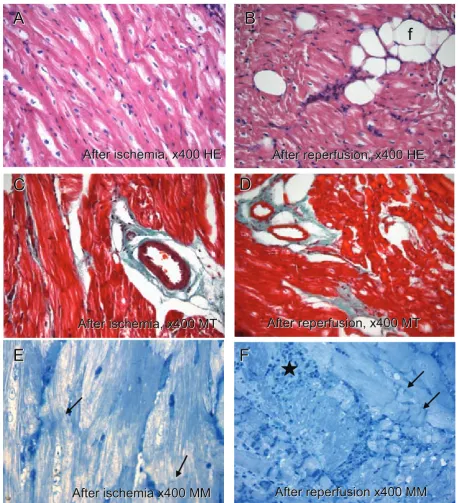
Histological Findings
Tissue samples that were isolated from the same region of the pig heart were assessed for myocardial recovery at light and transmission electron micro-scopically. Cardiomyocyte cytoplasm stains pink-ish with haematoxylin & eosin; red with Masson’s trichrome and blue with methylene blue azur II. Col-lagen fibers stain green with trichrome (Figs. 4–6).
Control and NO2– groups’ micrographs
re-vealed vascular congestion and local edema fol-lowing ischemia and reperfusion (Fig. 4D–F). Mononuclear cellular infiltrates and some adipo-cytes were noted after ischemia and reperfusion in
NO2– group (Fig. 4B). On the other hand, the
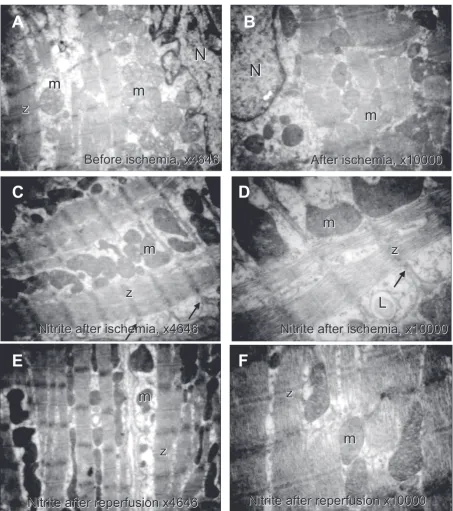
junc-tional complexes (intercalated discs) were intact in this group (Fig. 4E, F). The sarcomere alignment,
mitochondria and nuclei were better preserved
within the myocyte with NO2– treatment
compar-ing to control and NO3– groups electron
micro-scopically. Crista deterioration was noted at the post-ischemic period with nitrite treatment. Oth-erwise, the ischemia reperfusion injury was con-sidered severe in all groups because of the absence of glycogen adjacent to the mitochondria. On the
other hand, in NO2– group mitochondria
exhib-ited intact double membranes, compact, relatively organized cristae and a homogeneous dense ma-trix after reperfusion (Figs. 7A–F, 8A–F).
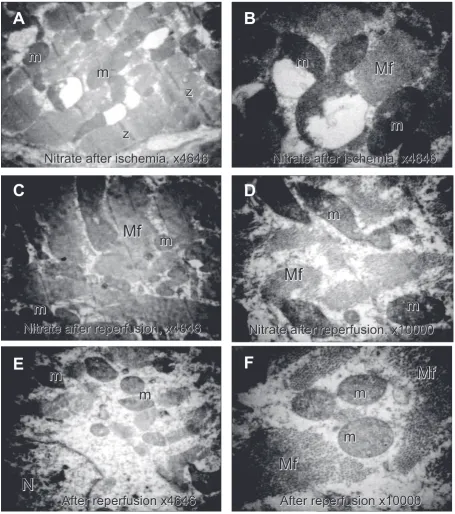
The myocyte cytoplasms appeared depleted (Fig. 6E, F) and vascular congestion was noted with the presence of mononuclear cell infiltrates
light microscopically in NO3-group (Fig. 6A–F).
Depleted nuclei and giant, depleted mitochondria,
TO T1 T2 T3
200 300 400
500 group 1
group 2 group 3
*
*
time
SOD U/mL
TO T1 T2 T3
0 30 60 90 120
150 group 1
group 2 group 3
*
*
time
GPx U/ml
TO T1 T2 T3
120 180 240
300 group 1
group 2 group 3
*
*
time
CA
T KU/mL
TO T1 T2 T3
2 3 4
5 group 1
group 2 group 3
**
**
time
MD
A
nmol/m
L
TO T1 T2 T3
30 60 90 120
150 group 1
group 2 group 3
*
*
*
time
NO2-/NO3-µmol/m
l
* p < 0.05, **p < 0.001
SOD – superoxide dismutase, GPx – Glutathion peroxidase, CAT – Catalase, MDA – Malondialdehyde
Fig. 1. Oxidative parameter changes in blood level
leaving open spaces between them were noted with an electron microscope after ischemia and
reperfusion with NO3– treatment (Fig. 8A–F).
Mitochondrial membranes were disrupted and exhibited dense bodies intervening irreversible reperfusion injury. Control group also exhibited condensed mitochondria with abnormal cristae following reperfusion; although the microstruc-ture was slightly better preserved compared to that
of NO3– group (Fig. 8E, F).
Discussion
The present data indicates that exogenous ni-trite administration just before ischemia protects
the pig heart against damage from ischemia and reperfusion injury. The reductive conversion of
NO2– to NO is thought to occur by a number of
mechanisms including the enzymatic actions of xanthine oxidoreductase [6], non-enzymatic dis-proportionation [7] and a hemoglobin reductase activity that is under allosteric control [8]. These mechanisms of NO2– reduction favor
bioconver-sion of NO2– to NO under the hypoxic and acidic
conditions present during ischemia [9].
Gonzalez wrote: “During cardiac ischemia and
reperfusion, NO2– in tissue is reduced to NO and
forms ironnitrosylated (Fe+2–NO) and
S-nitrosat-ed modifiS-nitrosat-ed proteins, via reactions with deoxy-myoglobin and other cellular heme proteins. The
rapid, facile metabolism of NO2– to NO with
sub-T1 T2 T3
0 100 200 300 400
500 group 1
group 2 group 3
time
SOD U/
g
T1 T2 T3
0 50 100 150
200 group 1
group 2 group 3 **
*
time
GPx U/
g
T1 T2 T3
100 200 300 400
500 group 1
group 2 group 3
time
CA
T U/
g
T1 T2 T3
1 2 3 4
5 group 1
group 2 group 3
time
MD
A
nmol/g
T1 T2 T3
0 1 2 3 4 5
group 1 group 2 group 3
time
NO2-/NO3-µmol/g
* p < 0.05, **p < 0.001
SOD – superoxide dismutase, GPx – Glutathion peroxidase, CAT – Catalase, MDA – Malondialdehyde
*
*
**
**
*
*
*
*
Fig. 2. Oxidative parameter changes in tissue level
sequent modification of target proteins has been documented in the heart and liver during both re-gional and global IR injury. The formation of NO in the heart during ischemia has been documented using electron paramagnetic resonance and liquid and gas phase chemiluminescence. The authors
have recently been found that NO2– will
specifical-ly posttranslationalspecifical-ly S-nitrosate complex I of the mitochondrial electron transport chain (METC); this effectively reduces electron flow through the METC and reduces reactive oxygen species forma-tion during reperfusion. This damping or tuning of electron transport inhibits opening of the mito-chondrial permeability transition pore, decreases cytochrome C release, and limits apoptosis. The nitrite-dependent decrease in TUNNEL staining
is consistent with this mechanism of cytoprotec-tion. Other intracellular targets for S-nitrosilation
by NO2– during I/R exposure could include the
L-type calcium canal receptor. In addition, stabili-zation of myglobin as iron-nitrosylated myoglobin may limit heme based oxidation reactions in the cardiomyocyte” [9].
In the current study, while there were protec-tive increases in oxidaprotec-tive parameters (tissue and serum) as well as hemodynamic and
histopatho-logical examinations in favor of NO2– group, these
changes were not detected in NO3– group. These
findings suggest the cardioprotective effects of
NaNO2.
With the beginning of the ischemic period in all groups, there was a decrease in arterial blood
TO T1 T2 T3
30 40 50 60 70 80 90
100 group 1
group 2 group 3
*
time
AST U/
L
TO T1 T2 T3
30 40 50 60 70 80 90
100 group 1
group 2 group 3
time
AL
T U/
L
TO T1 T2 T3
300 600 900 1200
1500 group 1
group 2 group 3
time
LDH U/
L
TO T1 T2 T3
100 200 300 400 500 600
700 group 1
group 2 group 3
**
time
CK-MB U/
L
TO T1 T2 T3
0.02 0.08 0.14
0.20 group 1
group 2 group 3
*
time
Tr
oponin-T ng/m
L
* p < 0.05, **p < 0.001
ALT – alanine aminotransferase, AST – aspartate aminotransferase, LDH – lactate dehydrogenase, CK-MB –
creatinine kinase,TNT – troponin t
*
*
Fig. 3. Changes in cardiac enzymes
pressures and increase in the heart rates. Fol-lowing the reperfusion period these changes re-turned to their pre-ischemic levels. Also, there was a decrease in cardiac output measurements in all groups. The decrease returned to pre-ischemic
level more than 65% in NO2– group, while this
returning level was 35 ± 5.2% in the other groups
(P < 0.01). There were also parallel changes in
LVEDP measurement. Return in LVEDP level in
NO2– group was more than > 62%, and 32 ± 7.4%
in the other groups (P < 0.05). There were no
sta-tistically meaningful changes between groups for the parameters of CVP, MPAP and SVRI. These findings were in accordance with the findings of Rassaf et al. [10] who concluded that “inhibition of endogenous NO release reduces, whereas
replen-Before ischemia, x400 HE
Before ischemia, x400 MT
Before ischemia, x400 MM
Before ischemia, x400 MT
After reperfusion x400 HE
After reperfusion x400 MT
Before ischemia, x400 HE
Before ischemia, x400 MT
Before ischemia, x400 MM
Before ischemia, x400 MT
After reperfusion x400 HE
After reperfusion x400 MT
A
B
C
D
E
F
A
B
C
D
E
F
Fig. 4. In control group micrographs, cytoplasms of cardiomyocytes are pink at A and E, red at B, D and F and blue in color at the C. Collagen fibrils in the connective tissue have green color with MT. At D–F congestion at the vessels and minimal edema (arrows) are noted. HE – Hematoxylin-Eosin, MT – Masson’s Trichrome, MM – Methylene blue
ishment with exogenous NO increases LV func-tion, pointing towards a positive effect of tonically released NO on LV function in healthy humans”.
Gonzalez et al. [9] in their study
investi-gated “the effect of efficacy of NO2– in
reduc-ing necrosis and apoptosis in canine myocardial infarction and to determine the relative role of
NO2–. They found that nitrite improved
micro-vascular perfusion, reduced apoptosis, and im-proved contractile function. The findings of the
After ischemia, x400 HE
After reperfusion, x400 HE
After ischemia, x400 MT
After reperfusion, x400 MT
After ischemia x400 MM
After reperfusion x400 MM
After ischemia, x400 HE
After reperfusion, x400 HE
After ischemia, x400 MT
After reperfusion, x400 MT
After ischemia x400 MM
After reperfusion x400 MM
A
B
C
D
E
F
A
B
C
D
E
F
f
Fig. 5. In nitrite groups micrographs, cytoplasms of cardiomyocytes appear pink at A and B, red at C, and D and blue in color at the E and F. Collagen fibrils in the connective tissue appear green with MT. Fat cells(f) are noted in B. There is local edema between cells in D. Protected intercalated discs (arrow) are noted after ischemia and reperfusion in E and F. Note the presence of mononuclear cellular infiltration near the cardiomyocytes. HE – Hematoxylin-Eosin, MT – Masson’s trichrome, MM – Methylene blue
After ischemia, x400 HE
After reperfusion, x400 HE
After ischemia, x400 MT
After reperfusion, x400 MT
After ischemia x400 MM
After repersuion x400 MM
After ischemia, x400 HE
After reperfusion, x400 HE
After ischemia, x400 MT
After reperfusion, x400 MT
After ischemia x400 MM
After reperfusion x400 MM
A
B
C
D
E
F
A
B
C
D
E
F
Fig. 6. In the nitrate group micrographs the cytoplasms of cardiomyocytes are pink at A and B, red at C, and D and blue in color at the E and F. Collagen fibrils in the connective tissue appear green with MT. At A–D (arrow) the myofibrils were separated from each other due to edema. Myocyte cytoplasms were partially depleted at E and F after ischemia and reperfusion. At F vascular congestion (wide arrow) was noted between the cells and the junctional com-plexes cannot be detected. Note the mononuclear cellular infiltration near the cardiomyocytes at C, D.
HE – Hematoxylin-Eosin, MT – Masson’s trichrome
present study are also consistent with the results of this study”.
When changes in the oxidative parameters following ischemia and reperfusion period are evaluated, enzyme systems such as superoxide
dismutase, glutathione peroxidase, catalase play important role. In the present study there were significant protective increases in SOD, GPx and CAT levels that protect myocardium from
isch-emia/reperfusion injury in NO2– group when
N
N
m
m
m
m
m
m
m
L
z
z
z
z
z
N
N
m
m
m
m
m
m
m
L
z
z
z
z
z
Before ischemia, x4646
After ischemia, x10000
Nitrite after ischemia, x4646
Nitrite after ischemia, x10000
Nitrite after reperfusion x4646
Nitrite after reperfusion x10000
Before ischemia, x4646
After ischemia, x10000
Nitrite after ischemia, x4646
Nitrite after ischemia, x10000
Nitrite after reperfusion x4646
Nitrite after reperfusion x10000
A
B
C
D
E
F
Figure 7:
Fig. 7. In the control and nitrite groups electron micrographs, the nuclei (N) and the mitochondria (m) appear healthy in A. A mitochondrial cristae deterioration was noted in control and the nitrite groups after ischemia (B–D). At F the cardiomyocyte exhibits intact mitochondrial membranes and also intact contractile apparatus after reperfu-sion with nitrite. Z – z band. Uranyl acetate and lead citrate
compared to other groups ([SOD serum level
P < 0.001, tissue level P < 0.001], [GPx serum level
P < 0.001, tissue level P < 0.001], [CAT serum level
P < 0.001, tissue level P < 0.001]).
Endothelial cells are activated in the reperfused myocardium and they express adhesion proteins,
secrete cytokines and decrease NO production. As a result of this process, neutrofills and monocytes accumulate and are activated in ischemic-reper-fused tissue. Release of reactive oxygen species and proteolytic enzymes from these activated cells may damage myocyte and vascular cells [4, 11]. High
m
m
m
m
m
m
m
m
z
z
m
m
Nitrate after ischemia, x4646
Nitrate after ischemia, x4646
Nitrate after reperfusion, x4646
Nitrate after reperfusion, x10000
After reperfusion x4646
After reperfusion x10000
A
B
E
Mf
Mf
m
Mf
Mf
m
N
Mf
m
m
m
m
m
m
m
m
z
z
m
m
Mf
Mf
m
Mf
Mf
m
N
Mf
F
E
C
D
Nitrate after ischemia, x4646
Nitrate after ischemia, x4646
Nitrate after reperfusion, x4646
Nitrate after reperfusion, x10000
After reperfusion x4646
After reperfusion x10000
Fig. 8. The control nitrate groups electron micrographs are presented. At A and B giant mitochondria (m) with dete-riorated cristae and disrupted membranes are noted after ischemia with nitrate. At C–F mitochondria with condensed and reduced cristae adjacent to myofilaments (Mf) are observed. The nucleus (N) is damaged but still exhibit an con-tinuous membrane in E. Uranyl acetate and lead citrate
levels of NO inhibit these processes during rep-erfusion. In this study serum and tissue levels of
NO2–/NO3– were statistically higher in nitrite group
from the other groups (Serum levels: Group 1:
P < 0.001, Group 3: P < 0.001, Group 1–3:
P = 0.466), (Tissue levels: Group 1: P < 0.05, Group 3:
P < 0.05, Group 1–3: P = 0.888).
Markers that are used to detect the myocyte damage (AST, ALT, LDH, CK-MB, Troponine-t) were also investigated in the study groups. In the four different sampling points there were only sig-nificant changes in ALT and AST levels at the rep-erfusion period (T3) in favor of nitrite group. There was no significant change in LDH levels in neither group at all time points. The reason for this may be the shortness of the experiment period. There were also no significant changes in CK-MB and tropo-nine-t levels at T0, T1, and T2 time points between groups. However, there was a statistically
signifi-cant difference in T3 time point in favor NO2– and
NO3– groups when compared to control group.
When both medicated groups compared to each other measured levels of CK-MB was significantly
less in NO2– group (P = 0.012). There were also
par-allel changes in troponine-t levels. These findings
also support the cardioprotective value of NaNO2.
Intact junctional complexes (intercalated
discs) at light microscopy in NO2– group and
bet-ter sarcomere alignment, mitochondria and nuclei
were preserved within the myocyte with NO2–
treatment at the electron microscopy also support the findings of oxidative parameters and cardiac destruction enzymes and they are the visual evi-dence of these findings.
As a conclusion, findings of the present study
support the cardioprotective role of NaNO2 against
myocardial ischemia-reperfusion injury when it is given at the pre-ischemic period.
Acknowledgement. The authors thank Ayse Eken, Asist. Prof., MSci for oxidative parameter measurements and Mr. Mustafa Ucar and Haluk Armutcu for their contribution during the experimental process.
References
[1] Bolli R: Cardioprotective function of inducible nitric oxide synthase and role of nitric oxide in myocardial isch-emia and preconditioning: an overview of a decade of research. J Mol Cell Cardiol 2001, 33, 1897–1918.
[2] Gladwin MT, Raat NJ, Shiva S, Dezfulian C, Hogg N, Kim-Shapiro DB, Patel RP: Nitrite as a vascular endocrine nitric oxide reservoir that contributes to hypoxic signaling, cytoprotection and vasodilatation. Am J Physiol 2006, 291, H2026–H2035.
[3] Dezfulian C, Shiva S, Alekseyenko A, Pendyal A, Beiser DG, Munasinghe JP, Anderson SA, Chesley CF, Vanden Hoek TL, Gladwin MT: Nitrite therapy after cardiac arrest reduces reactive oxygen species generation, improves cardiac and neurological function, and enhances survival via reversible inhibition of mitochondrial complex I. Circulation 2009 Sep 8, 120, 897–905.
[4] Bolcal C, Yildirim V, Doganci S, Sargin M, Aydin A, Kuralay E, Ozal E, Demirkilic U, Oz BS, Sayal A, Tatar H:
Do N-acetylcystein, beta-glucan, and coenzyme Q10 mollify myocardial ischemia-reperfusion injury? Heart Surg Forum 2007, 10, E222–227.
[5] Aebi H: Catalase in vitro. Methods Enzymol 1984, 105, 121–126.
[6] Millar TM, Stevens CR, Benjamin N, Eisenthal R, Harrison R, Blake DR: Xanthine oxidoreductase catalyses the reduction of nitrates and nitrite to nitric oxide under hypoxic conditions. FEBS Lett 1998, 427, 225–228.
[7] Zweier JL, Wang P, Samouilov A, Kuppusamy P: Enzyme-independent formation of nitric oxide in biological tissues. Nat Med 1995, 1, 804–809.
[8] Huang Z, Shiva S, Kim-Shapiro DB, Patel RP, Ringwood LA, Irby CE, Huang KT, Ho C, Hogg N, Schechter AN, Gladwin MT: Enzymatic function of hemoglobin as a nitrite reductase that produces NO under allosteric control. J Clin Invest 2005, 115, 2099–2107.
[9] Gonzalez FM, Shiva S, Vincent PS, Ringwood LA, Hsu LY, Hon YY, Aletras AH, Cannon RO 3rd, Gladwin MT, Arai AE: Nitrite anion provides potent cytoprotective and antiapoptotic effects as djunctive therapy to reperfusion for acute myocardial infarction. Circulation 2008 Jun 10, 117, 2986–2994.
[10] Rassaf T, Poll LW, Brouzos P, Lauer T, Totzeck M, Kleinbongard P, Gharini P, Andersen K, Schulz R, Heusch G, Mödder U, Kelm M: Positive effects of nitric oxide on left ventricular function in humans. Heart J 2006 Jul, 27(14), 1699–1705.
[11] Dhalla NS, Elmoselhi AB, Hata T, Makino N: Status of myocardial antioxidants in ischemia-reperfusion injury. Cardiovasc Res 2000 Aug 18, 47, 446–456.
Address for correspondence:
Suat DoganciGATA Kalp Damar Cerrahisi AD 06018 Etlik Ankara
Turkey
Tel.: +90 542 436 75 02
E-mail: [email protected]
Conflict of interest: None declared