Journal on Today’s Ideas – Tomorrow’s Technologies, Vol. 2, No. 1, June 2014 pp. 13–29 DOI: 10.15415/jotitt.2014.21002
Moment Curvature Characteristics for Structural
Elements of RC Building
RaVI KumaR C m1,*, VImal ChOuDhaRy2, K S BaBu NaRayaN3 aND D. VeNKaT ReDDy3
1Research Scholar, 2PG Student, 3Professors, Department of Civil engineering, National Institute of Technology Karnataka, Surathkal, Karnataka, India
*E-mail: cmravibdt@gmail.com
Received: april 17, 2014| Revised: may 20, 2014| accepted: June 22, 2014 Published online: June 30, 2014
The author(s) 2014. This article is published with open access at www.chitkara.edu.in/publications
Abstract: The paper highlights the investigation of nonlinear axial-force
and moment-curvature relationships for rectangular reinforced concrete (RC) beam and column cross sections for the reference reinforced concrete building structure considered for Probabilistic Seismic Risk evaluation. The highly popular model namely mander’s model is used for concrete stress-strain relationship since it is simple and effective in considering the effects of confinement. The module determines the expected behavior of a user-defined cross-section by first dividing the section into a number of parallel concrete and steel “fibers”. Then, the section forces and deformations are determined from the fiber strains and stresses using fundamental principles of equilibrium, strain compatibility, and constitutive relationships assuming that plane sections remain plane.
Index Terms: mander’s method, moment-Curvature, Stress-Strain Relationship
and moment Curvature
1. InTRoduCTIon
Ravi Kumar, C. m. Choudhary, V. Babu Narayan, K. S. Venkat Reddy, D.
procedures become necessary to identify the modes of failure and the potential for progressive collapse. The need to perform some form of inelastic analysis is already incorporated in many building codes. Theoretical moment-curvature analysis for reinforced concrete columns, indicating the available flexural strength and ductility, can be conducted providing the stress-strain relation for the concrete and steel are known. The moments and curvatures associated with increasing flexural deformations of the column may be computed for various column axial loads by incrementing the curvature and satisfying the requirements of strain compatibility and equilibrium of forces.
2. STRESS-STRAIn ModEL FoR ConCRETE
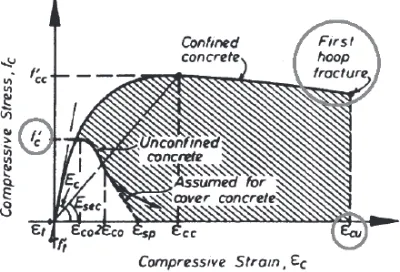
mander’s model is highly popular model since it is simple and effective in considering the effects of confinement. It considers increase in both the strength and ductility of RC members with confined concrete. The model is popularly used to evaluate the effective strength of the columns confined by stirrups, steel jacket and even by FRP wrapping as accomplished in Figure 1.
Figure 1: mander’s model for Stress-Strain Relationship for Confined
Concrete
3. STRESS-STRAIn CuRVES FoR REInFoRCInG STEEL
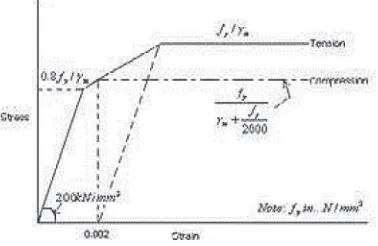
The idealized stress-strain curve for concrete as recommended by IS: 456-2000 is as shown in Figure 2. Stress-strain curve for steel as per British code CP 110-1972 as shown in Figure 3, accordingly the term 0.7fy is the simplification of
the expression fy
fy m
γ +
2000
. It gives all the simplified general equations which
moment Curvature Characteristics for Structural elements of RC Building
4. STRuCTuRAL SYSTEM
The building is an RC G+3 framed structure. The floor plan is same for all floors. The beam arrangement is different for the roof. It is symmetric in both the direction. The concrete slab is 120 mm thick at each floor level. Overall geometry of the structure including the beam layout of all the floors is as shown in Figure 4.
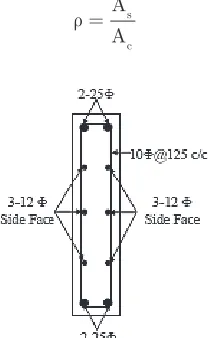
Figure 5 and 6 shows the size and reinforcement details for floor beam and roof beam sections at the column face. Figure 7 shows the size and reinforcement details for column at the beam face.
5. MoMEnT CuRVATuRE FoR BEAM
The most fundamental requirement in predicting the moment Curvature behaviour of a flexural member is the knowledge of the behaviour of its constituents. With the increasing use of higher-grade concretes, the ductility
Figure 2: Stress Strain Curve for Concrete
Ravi Kumar, C. m. Choudhary, V. Babu Narayan, K. S. Venkat Reddy, D.
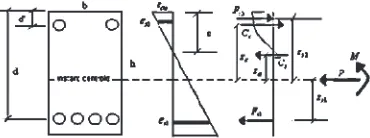
of which is significantly less than normal concrete, it is essential to confine the concrete. In a flexure member the shear reinforcement also confines the concrete in the compression zone. The relationship for the bending member as depicted in Figure 8 is as follows,
M
EI=E =R = f
x
c c
1 ϕ
Figure 4: Overall Geometry of the Structure
moment Curvature Characteristics for Structural elements of RC Building
hence,
ϕ= =
− =
+
εc εs εc ε
x d x d
S
Figure 6: Details of Floor Beams
Figure 7: Details of columns at various levels
Ravi Kumar, C. m. Choudhary, V. Babu Narayan, K. S. Venkat Reddy, D.
Where,
φ = Curvature
fc = maximum stress in compression in concrete
εc = maximum strain in concrete
εs = maximum strain in steel x = Depth of neutral axis d = effective depth of section
let consider BF205 beam section as depicted in Figure 9,
ρ = A
A s
c
Figure 9: Detailed BF204 Beam Section
modular Ratio (m) for elastic analysis = 280 14
fck =
Curvature φ at cracking moment just before cracking
fcr =0 7. fck =3 1305. MPa
at just before cracking moment is resisted by concrete in tension therefore Neglecting steel, N.a. = d/2
m f
y KNm
cr cr gr
= 1 =120 00.
ϕ=f = =
y M EI
cr 0 00028.
moment Curvature Characteristics for Structural elements of RC Building
Concrete does not take any tension so depth of neutral axis x is,
k =
k = 0.2179
(ρ ρ+ ′)2n2+2n(ρ ρ+ ′d′) (− ρ ρ+ ′)
d n
effective moment of inertia
Ieff =bx3+a m(D - x)s 2= mm4
3 7 990.
Φat M M
EI cr
cr
eff
= =0 00067.
εs strain in steel = fy/es = 0.0021
The neutral axis at yielding is given as distance kd from extreme compression fiber, where the ratio k is calculated using expression:
k =
k = 0.2179
(ρ ρ+ ′)2n2+2n(ρ ρ+ ′d′) (− + ′ρ ρ)
d n
Where ρ A
bd s
and ′ = ′ ρ A bd
s are the tension and compression steel ratios, n is
the modular ratio, and d and d’ are the distance of compression and tension steel from extreme compression fiber.
As Steel in tension
As, Steel in compression
Depth of Neutral axis at yield stage; x = kd =208.65mm = .21m
Taking moment about compressive force due to concrete, yield moment is given by:
My = − + ′ ′ − ′
A f dS y kd A fS y kd d
3 3
Since stress in the tension steel is fy, using similar triangles, stress in compression steel is calculated as
fy= − ′ mPa
− =
(d d ) .
d kd fy 99 01
Curvature is then obtained as
ϕy = y
− =
ε
Ravi Kumar, C. m. Choudhary, V. Babu Narayan, K. S. Venkat Reddy, D.
after yielding of tension steel, its stress remains constant but strain keeps increasing until compressive strain in extreme fiber of concrete reaches the strain value of εcu at maximum stress in concrete fc’. In order to address the nonlinearity in concrete at high strains, Whitney-block is used to approximate the parabolic stress distribution in concrete to an equivalent rectangular stress-block representation.
The calculation of ultimate state requires iteration. For hand calculations, let us assume that strain in compression steel εs, exceeds the yield strain εy. This assumption will be checked later. equilibrium of tension and compressive force gives the depth of neutral axis as;
c
b
A f A f f b s s
c
s y s s
c
= − ′ ′
′ =
− ′ ′
′ =
a f a f f s y
85 β1 36 187.33319
ultimate moment is then obtained by taking moment about tension steel as:
M C d c C d d
f Cb d c
u c S
c = − + − ′ = ′ − 2 36 2 ( ) ++ ′ ′ − ′ =
A f s s d d
KNm
( )
. 361 57
ϕu= =
0034
0 01868
c .
The ductility factor
D. F. = ϕ
ϕ u y
=6 74.
Where is φu ultimate strain in concrete at maximum stress, which is 0.0034 as per IS456-2000. This is first trial value of εu. assumption of yielding in compression is now checked by ensuring:
εs=(c d− )εcu≥εy
c
If the above condition is satisfied then assumption made is true and obtained value of(mu, φu) defines the ultimate state on the moment-curvature curve. If the condition is not satisfied further iteration is required with new trial strain value as
εs =εy +εs
2
6. ConCRETE PRoPERTIES
moment Curvature Characteristics for Structural elements of RC Building
method developed by mander et al. In this method, the concrete stress, fc is given as a function of the strain, εc as:
fc f
r in mPa
C
= ′
− +
x r xr . 1
x r = e
e e
co
c o sec
=
− ε
ε
c ,
εc0 is the strain at peak stress ( fc’) and ec is the tangent modulus of elasticity of concrete calculated as
ec=5000 fc mPa′
esec, the secant modulus of elasticity, is the slope of the line connecting the
origin and peak stress on the compressive stress-strain curve (i.e., Esec= fc′
εCO).
Crushing of the unconfined concrete is assumed to occur at εcu 2εco.
7. ThE MoMEnT-CuRVATuRE RELATIonShIPS oF ThE CoLuMn CRoSS-SECTIonS
This is an iterative process, in which the basic equilibrium requirement P = C-T is used to find the neutral axis location, c, for a particular maximum concrete compressive strain, εcm where P = axial force; C = internal compression stress resultant; and T = internal tension stress resultant. The total concrete compressive stress resultant and the location of its centroid are determined by integrating numerically under the concrete stress distribution. The bending moment is assumed to act such that the top surface of the cross-section is in compression.
The entire process can be summarized for a cross-section with two layers of reinforcing bars as depicted in Figure 10 follows
Figure 10: The Cross-Section with Two layers of Reinforcing Bars
Ravi Kumar, C. m. Choudhary, V. Babu Narayan, K. S. Venkat Reddy, D.
The calculation of the following four points on a moment-curvature curve will be taken for plotting the moment curvature curve for various column section shown in this example: εcm =0.25 εcu;εcm = 0.5 εcu;εcm = 0.75 εcu; εcm = 1.0εcu(concrete crushing).
A. Axial Load, P
The axial load considered for sample calculations of Cl15 is 50% of the balanced failure load. The balanced load, Pb, is computed as follows:
The neutral axis, c = cb cu cu y
= +
d ε
ε ε ,
Where, εy= fy/es
With εcu = 0.004 and d = 848m, cb = 0.525m.
The concrete compressive resultant, Cc, is determined by numerically integrating under the concrete stress distribution curve.
Cc
Cc = 3531.24KN
=
∫
f bdxc =∫
f b c d cc cm
c
b CU
0 0
ε
ε ε
The spacing of each layer of steel is s = 0.198m
The steel forces of each layer top to bottom wise, Fs1 and Fs2, Fs3, Fs4 and Fs5, respectively, are calculated using similarity to find the strains in the layers. Balanced failure condition, by definition, has strain values εcu = εcm = 0.0034 for concrete and εs5= εy= 0.002 for bottom layer of steel. For the top steel,
εs1= − ′ 0 0031
− =
εsS c d
d c .
Similarly for second and third layer,
moment Curvature Characteristics for Structural elements of RC Building
ε
ε
ε
s
s 1
3
4
0 0019 0 0008
2 0
= − ′−
− =
= − − =
= − − =
ε
ε
ε
sS
cm
cm
c d s d c d c s
c d c s
c
. . .. .
0006 0 0021 5
εs =εcmd c− =
c
This implies that the first and fifth layer of steel is at yield stress. hence,
Fs1= fyas1= 766.61 KN (compression) Fs2 = εs2esas2= 458.06KN (compression) Fs3 = εs3esas3=195.47KN (tension) Fs4 = εs4esas4= 142.45KN (tension) and Fs5 = fyas5= 766.61KN (tension)
Where, as1, as2, as3 as4 and as5 are the total reinforcing steel areas in each layer. as per IS456 consideration the concrete tensile strength in the tension region recommends the modulus of rupture to be taken as,
fr′ = f ′c MPa for normal weight concrete.
Thus, for f ′ =c 20 mPa, f ′ =r 3 3. mPa. The concrete tension force Ct =1 ′ Ct = KN (tension)
2f Ar cr, 22 97.
Where, acr is the area of concrete in tension calculated based on the linear strain diagram.
Then, the balanced axial load is found from equilibrium as,
Pb=Cc+Fs1+Fs2−Fs3−Fs4−Fs5−Ccr
Therefore, 50% of the balanced load used is P =1814.20kN.
B. Instant Centroid
Ravi Kumar, C. m. Choudhary, V. Babu Narayan, K. S. Venkat Reddy, D.
condition produces a uniform compression strain distribution throughout the cross-section.
let the uniform compression strain be equal to εci then,
P=f aci c+f as1 s1+f as2 s2+f as3 s3+f as4 s4+f as5 s5
From equilibrium,
a trial-and-error solution is needed since it is not known in advance. Then, the location of the instant centroid, x, from the top compression face is determined as,
x f A h
f A d f A d s f A d s
f A d s f
ci c
s s s s ss ss
s s ss
2 2
3
1 1 2 2
4 4
+ + − + − +
− +
( ) ( )
( ) AA d
f A f A f A f A f A f A
ss
ci c s s s s s s s s s s
′
+ 1 1+ 2 2 + 3 3+ 4 4+ 5 5
x = 0.4505m
The calculation of the first point on the moment-curvature relationship of the section can be summarized as follows:
1. εcm = 0.25 εcu= .00084
2. assume the neutral axis depth, a distance c = .4m 3. From the linear strain diagram geometry
εs εs c d
d c
1= 5 0 0031
− ′
− = .
Similarly for second and third layer,
ε ε ε ε ε ε s s s cm s cm
c d s
d c d c s
c
d c s
c 2 5 3 4 0 0019 0 0008 2 = − ′ − − = = − − = = − − = . . 00 0006 0 0021 5 . .
εs εcmd c
c
= − =
moment Curvature Characteristics for Structural elements of RC Building
5. Determine Cc by integrating numerically under the concrete stress distribution curve.
Cc =
Cc = 1755.09 KN
f bdxc f b c d c
c cm
c
b cu
0 0
∫
=∫
εε ε
The concrete that has not cracked below the neutral axis contributes to the tension force Ct.
′ = ′
=
fr f c
t
MPa C 3 82 KN0.
6. Check to see if
P C F F F F F C
P KN
b c s1 s2 s3 s4 s5 t
b
= + + + − − −
=1585 57.
So, the neutral axis must be adjusted downward, for the particular maximum concrete strain that was selected in Step 1, until equilibrium is satisfied. This iterative process determines the correct value of c. Trying neutral axis depth c = .431m gives,
εs5 = 00084 (below yield); εs4 = 0.0006; εs3 = 0.0008; εs2 = 0.0019; εs1 = 0.0031
and
Cc = 1917.44KN; Ct = 28.51KN; Fs1 =285.29KN; Fs2 = 95.34KN; Fs3 =101.08KN; Fs4 = 6.23KN; Fs5 = 293.91KN
Section curvature can then be found from,
ϕ=εcm =
c 0 002125.
The internal lever arms for the resultant compression and tension forces of the concrete measured from the instant centroid.
Then, the section moment can be calculated as,
m = C z + F z + F z + F z + F z + F z + Cc c s1 s1 s2 s2 s3 s3 s4 s4 s5 s5 tzz m = 872.22 kNm
t
Ravi Kumar, C. m. Choudhary, V. Babu Narayan, K. S. Venkat Reddy, D.
The moment-curvature plot for column has been shown in Figure 12 and for beam as shown in Figure 13.
Figiure 12: moment-Curvature Relationship Curve for Column
Figure 13: moment-Curvature Relationship Curve for Beam
moment Curvature Characteristics for Structural elements of RC Building
Table 1. Point at moment-Curvature Curve For Column
Point m(moment) Curvature φ
0 0 0
0.25εcu 872.2165 0.0019
0.5εcu 1395.398 0.0046
.75εcu 1579.791 0.0076
1.0εcu
(concrete crushing). 1520.344 0.0095
Table 2: moment at Various Points In Beams
Beam Before
Cracking Crackingafter yieldat Crushing of Concrete
BF205 120.00 120.00 365.62 361.57
BF204 120.00 120.00 153.21 154.78
BF225 120.00 120.00 237.57 238.17
BF223 120.00 120.00 366.72 363.35
BR6 120.00 120.00 237.45 238.21
BR7 43.20 43.20 88.19 88.20
BR21 120.00 120.00 236.39 236.97
BR20 120.00 120.00 237.57 238.17
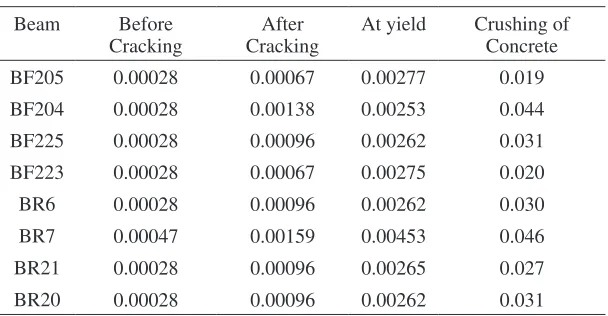
Table 3: Curvature at Various Points In Beams
Beam Before
Cracking Crackingafter at yield Crushing of Concrete
BF205 0.00028 0.00067 0.00277 0.019
BF204 0.00028 0.00138 0.00253 0.044
BF225 0.00028 0.00096 0.00262 0.031
BF223 0.00028 0.00067 0.00275 0.020
BR6 0.00028 0.00096 0.00262 0.030
BR7 0.00047 0.00159 0.00453 0.046
BR21 0.00028 0.00096 0.00265 0.027
Ravi Kumar, C. m. Choudhary, V. Babu Narayan, K. S. Venkat Reddy, D.
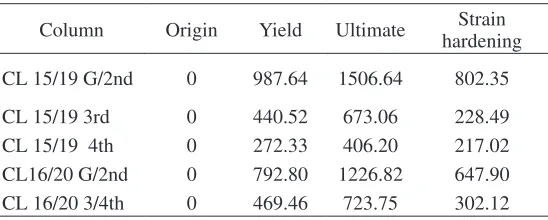
Table 4: moment at Various Points In Column
Column Origin yield ultimate hardeningStrain Cl 15/19 G/2nd 0 987.64 1506.64 802.35
Cl 15/19 3rd 0 440.52 673.06 228.49
Cl 15/19 4th 0 272.33 406.20 217.02
Cl16/20 G/2nd 0 792.80 1226.82 647.90
Cl 16/20 3/4th 0 469.46 723.75 302.12
Table 5: Curvature at Various Points In Column
Column Origin yield ultimate hardeningStrain Cl 15/19 G/2nd 0 0.0054 0.0078 0.1468
Cl 15/19 3rd 0 0.0072 0.0102 0.1938
Cl 15/19 4th 0 0.0072 0.0104 0.1938
Cl16/20 G/2nd 0 0.0054 0.0073 0.1462
Cl 16/20 3/4th 0 0.0054 0.0086 0.1281
8. ConCLuSIon
an analytical model is presented to simulate the moment curvature behavior of reinforced concrete. Based on control of load increments, the algorithm proposed by mander enables determination of moment – curvature-strain relationship with any geometry and material properties up to the maximum capacity of the section; however with a constant axial load or control of deformation increments, this model can be used to compute both the ascending and descending branches of the curvature curve. The moment-curvature (or moment-rotation) relations play an important part in the study of limit analysis of two or three dimensional reinforced concrete frames.
REFEREnCES
[1] Bai, Zhizhou, “Nonlinear analysis of Reinforced Concrete Beams and Columns with Special Reference to Full-range and Cyclic”, Ph.D Thesis, The University of Hong Kong, China, 2006.
http://hdl.handle.net/10722/50666
[2] Cinitha a*, umesha P. K, Nagesh R. Iyer, “Evaluation of Seismic Performance of Existing Steel
moment Curvature Characteristics for Structural elements of RC Building [3] Filip C. Filippou, ahmad Issa, “Non-Linear Analysis of Reinforced Concrete Frames under
Cyclic Load Reversals”, Report No. uCB/eeRC–88/12earthquake engineering Research Center College of engineering, university of California, Berkeley September 1988.
[4] hyo-Gyoung Kwak, Filip C. Filippou, “Finite Element Analysis of Reinforced Concrete
Structures under Monotonic Loads”, Report No. uCB/Semm-90/14, Structural engineering, mechanics and materials Department of Civil engineering university of California, Berkeley, November1990.
[5] mander, J.B., Priestley, m.J.N., and Park, R. “Theoretical Stress-Strain Model for Confined
Concrete”, Journal of Structural engineering”, american Society of Civil engineers, Vol.114, No. 8, 1988, pp. 1804-1825. http://dx.doi.org/10.1061/(aSCe)0733-9445(1988)114:8(1804) [6] Sifat Sharmeen muin, “A Parametric Study of RC Moment Resisting Frames at Joint Level
by Investigating Moment -Curvature Relations”, International Journal of Civil and Structural engineering, Vol. 2, No. 1, 2011.