This is an open access journal, and articles are distributed under the terms of the Creative Commons Attribution-Non Commercial-ShareAlike 4.0 License, which allows others to remix, tweak, and build upon the work non-commercially, as long as appropriate credit is given and the new creations are licensed under the identical terms.
© 2019 Journal of Advanced Pharmacy Education & Research | Published by SPER Publication
54
Measurement of knowledge risk factors of Lung Cancer disease
in salted-fish-traders at Pangandaran Indonesia
Ia Nurmayanti
1*, Ajeng Diantini
1, 2, Tiana Milanda
11Faculty of Pharmacy, Universitas Padjadjaran, Indonesia. 2Center of Excellence in Higher Education for Pharmaceutical Care Innovation, Universitas Padjadjaran, Indonesia.
Correspondence:Ia Nurmayanti, Faculty of Pharmacy, Universitas Padjadjaran, Indonesia. E-mail: nurmayantiia036 @ gmail.com
ABSTRACT
A study was conducted on measuring knowledge of risk factors for lung cancer disease in the community with traditional salted fish traders in Pangandaran village in the framework of community service performed in September 2017. The method used was a cross-sectional study. In this case, we were able to see the relationship of several independent variables consisting of socio-demography factor, environment, and dependent variable: lung cancer risk factor. The confounding variable is promotion and policy. Respondents consisted of 25 people answered questionnaires which amounted to 50 questions. The result of this study can be seen in the correlation between Promotion Factor and Policy with Environmental Factor including a strong association degree category with 10,048 counts and a p-value equal to 0,040. The result of statistical test shows that p-p-value (0,040) <0,05. However, there is no correlation between the risk factor and socio-demographic factor with count value 3,690 and the p-value equal to 0,450. Result of statistic test show that p-value (0,450)> 0,05. There is no correlation between Risk Factor and Environmental Level, the calculate value is 9,649 and the p-value is 0,047. The result of the statistical test shows that the p-value (0,047)> 0,05. The conclusion from this study is lung cancer risk factors have no related to socio-demographic factors and environmental factors.
Keywords:Knowledge, risk factors, socio-demographic factors, environmental factors, policy promotion factors.
Introduction
Cancer is one of the major causes of death worldwide. About 8.2 million deaths were caused by cancer in 2012. Lung cancer, breast, liver, stomach, and colorectal cancer are the biggest causes of cancer deaths each year. [1]
There are five risk factors for dietary and dietary behaviors, namely [1] high body mass index, [2] lack of consumption of fruits
and vegetables, [3] lack of physical activity, [4] smoking, and [5]
alcohol consumption causes more than 30% of cancer deaths. Smoking is a major risk factor for cancer that accounts for more than 20% of cancer deaths worldwide. And about 70% of deaths from lung cancer worldwide. More than 60% of new cases and about 70% of cancer deaths worldwide occur annually in Africa,
Asia, and Central and South America. The estimated annual cancer cases will increase from 14 million in 2012 to 22 million in the next two decades. [2]
Certain cancers that are related to irresistible exposures may well be anticipated through behavioral changes, immunizations, or anti-microbial. The connection between dietary components (Useful Nourishments) and malady are directed by the Joined together States Nourishment and Medicate Organization (FDA) beneath the specialist of two laws; The Government Nourishment, Sedate, and Restorative Act (FD&C) of 1938 gives for the direction of all nourishments and nourishment added substances. Eating propensities in high and low socioeconomic (SES) bunches is considered as one of the foremost effective indicators of wellbeing status and mortality around the world. High-risk wellbeing behaviors are more common in people of moo SES (LSE). The abundance mortality and dreariness related to LSE have commonly been credited to high-risk wellbeing behaviors counting eat less, smoking, need of physical activity, and corpulence. Encourage, the expanding rate of cancer chance in numerous populaces was related basically with the utilization of protected angle, cold cuts, oleaginous natural products, liquor, [3].
Access this article online
Website:www.japer.in E-ISSN: 2249-3379
More than 30% of cancers can be prevented by altering risk factors for behavior and dietary causes of cancer. Cancer that is known early on can get better handling. Therefore, prevention efforts need to be done to increase public awareness in recognizing the symptoms and risks of cancer so that it can determine the precautions and early detection measures appropriate [1].
Lung cancer is the leading cause of death in the world both for men and women. Worldwide, deaths from lung cancer alone rank 7th after ischemic heart disease, stroke, lower respiratory tract infections, chronic obstructive pulmonary disease (COPD), diarrhea and human immunodeficiency virus / acquired immunodeficiency syndrome (HIV / AIDS). Lung cancer, along with tracheal and bronchial cancers, accounted for 7.6 million deaths or about 13% of deaths worldwide in 2008. [4, 5]
In the United States, the number of recently analyzed cases for lung cancer positioned moment in 2017 after prostate cancer in men and cervical cancer in ladies. In men, there were 116,990 unused cases and in 105,510 new cases. Whereas within the same year, the malady positions to begin with cause of passing by cancer in guys (84,590 occupants) and ladies (71.280 occupants)
[2].
Lung cancer is the driving cause of cancer passing in the United States and around the world. An endless larger part of lung cancer passings are inferable to cigarette smoking, and controlling the rates of cigarette smoking is basic. Understanding the study of disease transmission and causal components of lung cancer can give an extra establishment for infection anticipation. This article centers on modifiable hazard variables, counting tobacco smoking, word related carcinogens, count calories, and ionizing radiation. It too talks about briefly the atomic and hereditary angles of lung carcinogenesis[6, 7].
Lung cancer is the deadliest of all cancers within the United States and the world. It slaughters more Americans than the other four most common cancers combined. Lung cancer is generally preventable; advances in diminishing cigarette smoking are having a positive impact, although other natural exposures too put individuals at the chance[8].
More noteworthy than one-third of all recently analyzed lung cancers happened in China, speaking to an overwhelming burden for the patients, families, society, and nation. In China, lung cancer is the foremost commonly analyzed cancer and the driving cause of cancer-related passing. The chance variables related to lung cancer have been well examined beneath constrained conditions by therapeutic staff locks in lung cancer avoidance. Be that as it may, the conclusion regularly happens so late that roughly two-thirds of patients have misplaced the opportunity for radical surgery[9].
Among males, lung cancer is the leading cause of passing in most nations in Eastern Europe, Western Asia (eminently within the previous Soviet Union), Northern Africa, and particular nations in Eastern Asia (China) and South‐Eastern Asia (eg, Myanmar, the Philippines, and Indonesia)[10].
According to Globocan 2018, In Indonesia lung cancer leading to cancer in men (22440 new cases)[11].
The prevalence of cancer in the population of all ages in Indonesia in 2013 amounted to 1.4% or an estimated 347,792 people. Province D.I. Yogyakarta has the highest prevalence of cancer of 4.1%. Based on the estimated number of cancer patients, West Java Province is the third province with the highest estimated cancer patients after Central Java Province and East Java Province which is about 45,473 people[1].
Pangandaran Village is one of the coastal villages in Pangandaran District, Ciamis Regency, West Java. Geographically located at coordinates 108020 'up to 108040' East Longitude and 70040'20 "up to 7040'20 'South Latitude. Pangandaran Village is located in the north of Babakan Village, south of the Indian Ocean, west of Pananjung Village, and east of Ocean Indonesia. The original inhabitants o Pangandaran Village are actually few, as is stated above, that according to the history of the Pangandaran area stopover and then the settlers settled in to Pangandaran villagers. The immigrants are diverse backgrounds, there are travelers, businessmen, and others who eventually settled as residents of Pangandaran Village[12].
The high number of Pangandaran villagers has a positive influence and negative influence. The positive influence that can be seen is the growth of socioeconomic indigenous people who increase because of the high number of tourism, in addition to the increase in communication flow due to the influence of the settlers either permanent or temporary settled. Whereas the negative influence is in terms of the psychosocial behavior of immigrants who have a big effect on indigenous behavior that can be seen from lifestyles and habits[13].
One of the numerous negative propensities that happen is the smoking propensity of the populace, both male and female, in different callings both anglers and dealers who are the foremost callings within the range Pangandaran. As we know smoking is the greatest hazard figure for lung cancer. Around the world over 1 million individuals kick the bucket due to lung cancer each year. It is assessed that cigarette smoking clarifies nearly 90% of lung cancer chance in men and 70 to 80% in ladies [14].
Smoking causes the majority of lung cancers — both in smokers and in individuals uncovered to used smoke. But lung cancer too happens in individuals who never smoked and in those who never had drawn out introduction to used smoke[14].
Therefore, Community Service Activities is very appropriate in this area, in this case to Measure Community Knowledge Level of Pangandaran Village about Lung Cancer Risk Factors.
Method
1. Sample
Respondents were taken from the population of Pangandaran Village who work as salted fish traders.
Inclusion Criteria:
1) Healthy respondents have not been exposed to cancer 2) Respondents are male female
3) Respondents can write and read 4) Age of respondents 18-80 years.
Exclusion Criteria:
1) Respondents have been exposed to cancer
2) Respondents can not follow the extension activities and fill out the questionnaire
2. Research Methods
This study designed as a cross-sectional study and examines the relationship between risk factors (exposure) and effects (outcomes) by observing the status of risk factors (exposure) and effects simultaneously in individuals from a single population, at one time or a period. In this case, we can see the relationship of several independent variables consisting of sociodemographic factors, environment, and dependent variable: lung cancer risk factors while confounding variables: promotion and policy.
Questionnaire filling activity accompanied by an explanation of the intention of the question because the education level of respondents almost homogeneous, after the activity of filling questionnaires respondents were educated about lung cancer risk factors.
3. Analysis of data
The method of data analysis used in this study is a comparison test of two paired samples. Paired comparison test using paired t-test if the data is normally distributed and using the Wilcoxon test if the data is not normally distributed. Chi-Square test used to see the relationship between variables with a 95% confidence level and alpha 5% (0.05). All data processes used by software SPSS for Windows version 20.0.
Results
A. Respondent Category
Table 1. and Figure 1. illustrate the categories of respondents based on Socio demography, Environment, Promotion, Policy, and Risk Factor. Based on Socio-demography, which included the high category as many as five peoples (20.0%), which included the moderate category of eighteen peoples (72.0%), and the low category as many as two peoples (8.0%).Based on the environment, which included a high category as many as nineteen people (76.0%), which included the moderate category as one people (20.0%), and the low category as much as one person (4.0%).Based on Promotion and policy, which included the high category as many as twelve peoples (48.0%), which included the moderate category of eleven peoples (44.0%), and the low category as many as two peoples (8.0%).
B. Relationship between Promotion Level and
Policy with Sociodemographic Level.
According to Table 2, it can be seen that from twelve people whose promotion rate and policy are included in the high category, two of them have a high socio-demographic level, Eight of them have a moderate sociodemographic level and two of them have the low sociodemographic level. Eleven people whose Promotion Rate and Policy are in the medium category, Three of them have a high socio-demographic level, Eight of them have a moderate demographic level and none have a low socio-demographic level. two people whose Promotion Rate and
Policy are included in the low category, none have high sociodemographic, two of them have a moderate sociodemographic level and none have a low socio-demographic level. The relationship between Promotion Level and Policy with Socio demography, chi-square analysis is used with the following hypothesis.
Hypothesis:
Ho: There is no relationship between Promotion Level and Policy with Socio-Demography.
H1: There is a relationship between Promotion Level and Policy with Socio-Demographic Level.
Statistical Analysis:
=
2
2 3 21 1
(
ij ij)
i j ij
O
E
E
= =
−
Test criteria:
Reject Ho if count> table, thank Ho in other things.
Based on the results of statistical calculations obtained calculated value of 3.190 and p-value of 0.527. The result of statistical test shows that p-value (0,527)> 0,05. Ho is therefore accepted. That is, there is no relationship between Promotion level and Policy with Sociodemographic Level. To see how close the relationship is between Promotion Rate and Policy with Socio-Demographic Level.
a. Relationship between Promotion Level and
Policy with Environmental Level
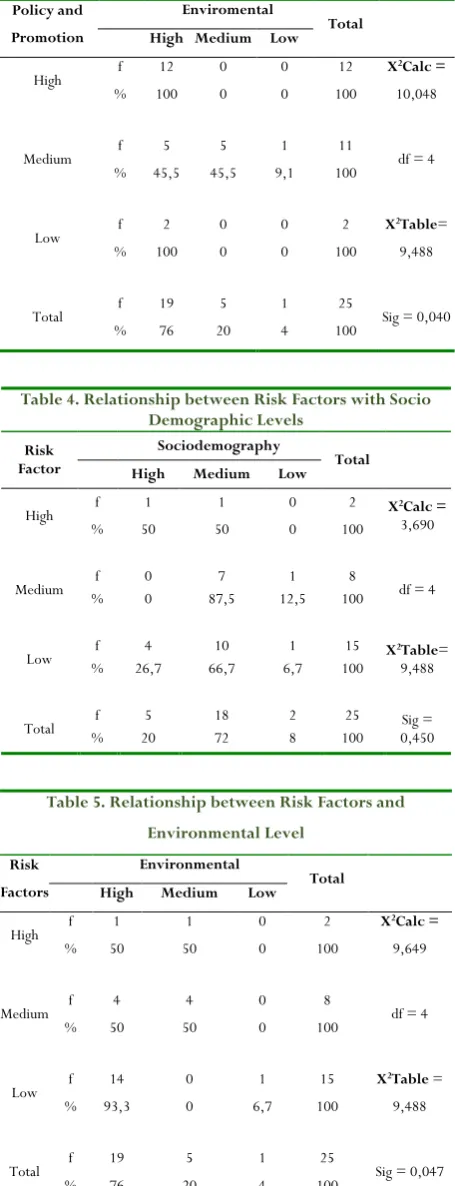
Table 3. shown that from twelve peoples whose Promotion Rate and Policy are included in the high category, twelves of them have a high level of environment, none of which have a moderate level of Environment and none has Low Environment level. Eleven people whose level of promotion and policy are in the medium category, five of them have a high level of Environment, five of them have a moderate level of Environment and one person with low environmental level. Two peoples whose promotion rate and policy are included in the low category, they all have a high level of Environment. The relationship between Promotion Level and Policy with Environmental Level, chi-square analysis is used with the following hypothesis
Hypothesis:
Ho: There is no relationship between Promotion Rate and Policy with Environmental Level.
H1: There is a relationship between Promotion Level and Policy with Environmental Level.
Test criteria:
Reject Ho if count> table, thank Ho for other things.
b. Relationship between Risk Factors and Socio-Demographic Levels
According to the Table 4. can be seen from two people whose risk factors are included in the high category, one person has high Socio-Demography level, one person has a Socio-Demography level and no one has low Socio-Demographic level. Eight people, whose risk factors were included in the moderate category, none had a high level of Socio demography, seven of whom had moderate sociodemographic levels and one person with low sociodemographic level.
Of the fifteen peoples whose risk factors were included in the low category, four people had a high Socio-Demographic level, ten had a moderate sociodemographic level and 1 person with a low Sociodemographic level. the relationship between Risk Factors with Socio-Demography Level, chi-square analysis is used with the following hypothesis.
Hypothesis:
Ho: There is no relationship between Risk Factors with Socio-Demographic Level.
H1: There is a relationship between Risk Factors with Socio-Demographic Levels.
Based on the statistical calculation results obtained calculated value of 3.690 and p-value of 0.450. The result of statistical test shows that p-value (0,450)> 0,05. Ho is therefore accepted. there is no relationship between Risk Factors with Socio-demographic Level.
c. Relationship between Risk Factors and Environmental Level.
Table 5. shows that from two peoples whose risk factors are included in the high category, one of them has a high level of Environment, one person has a moderate level of Environment and none has a low level of Environment. Eight peoples whose risk factors are included in the moderate category, four peoples have a high level of environment, four of them have a moderate level of environment and none have a low level of the environment. Fifteen people whose risk factors fall into the low category, fourteen peoples with a high level of environment, none of which have a moderate level of Environment and one person with a low level of Environment. The relationship between Risk Factors and Environmental Level, chi-square analysis is used with the following hypothesis.
Hypothesis:
Ho: There is no relationship between Risk Factors and Environmental Level.
H1: There is a relationship between Risk Factors and Environmental Level.
Based on the results of statistical calculations obtained calculated value of 9,649 and p-value of 0.047. The result of statistical test shows that p-value (0,047)> 0,05. Ho is therefore accepted. That is, there is no relationship between Risk Factors with Environmental Level.
Discussion
Based on the above statistical test results we can see in the category of respondents who are homogeneous enough there is no relationship between socio demographic-environmental variables, socio demographic-risk factors. This is due to the uniformity of data obtained, both from the age category, income, habit factors so that the results obtained are also uniform. The geographic and worldly designs of lung cancer rate, as well as lung cancer mortality, on a populace level, are mainly decided by tobacco utilization, the most aetiological calculate in lung carcinogenesis. Other variables such as hereditary defenselessness, destitute count calories, word related exposures, and discuss contamination may act autonomously or in concert with tobacco smoking in forming the expressive the study of disease transmission of lung cancer. Moreover, novel approaches within the classification of lung cancer based on atomic strategies have begun to bring modern bits of knowledge to its etiology, in specific among nonsmokers. In spite of the victory within the depiction of tobacco smoking as the major risk figure for lung cancer, this exceedingly preventable illness remains among the foremost common and most deadly cancers all-inclusive [15].
Environmental exposures, hereditary inclination, hormonal variables, and viral disease may all play a part in lung cancer in ladies. A much better understanding may give a road for more successful screening, conclusion, and treatment [16].
But it is different with environmental variables and health promotion there is a strong relationship, this is because the environment close to where the promotion of health or an active environment is often used as a health promotion will affect the surrounding communities.
Introduction to a wide assortment of common and man-made substances within the environment accounts for at slightest two-thirds of all the cases of cancer within the Joined together States. These natural components incorporate a way of life choices like cigarette smoking, over the top liquor utilization, destitute count calories, need of work out, intemperate daylight presentation, and sexual behavior that increments introduction to certain infections. The cancer dangers related to numerous natural chemicals have been recognized through considers of word related bunches that have higher exposures to these chemicals than the common populace [16].
The Research in Australia, The subjective discoveries moreover propose that information may not lead to prior introduction; a need of direness around indications considered trifling, and smoking-related boundaries such as shame may too contribute to time delays within the introduction. Open wellbeing interventions may be required to extend mindfulness of chance and emphasize the significance of looking for restorative consideration for a continuous side effect [17].
communities with similar professions of respondents so there is still a need for study or research for different demographics.
Conclusions
It is imperative that sustainable studies and education be undertaken on people living in coastal areas or those living in the mountains to increase public knowledge about cancer risk factors, so long-term targets can be an effort to prevent future about lung cancer can be achieved.
Funding
This research was supported by Ministry of Research and Technology Indonesia.
References
1. Ministry of Health Indonesia. Stop Cancer, Infodatin of Cancer. Center of information data ministry of health Indonesia. 2015.
2. Facts C. Cancer Facts & Figures 2017. United States; 2017. 3. Aly HF. Dietary habits and relation to cancer disease in
different population. 2012;1(1):1–26.
4. Facts C. Cancer Facts & Figures. United States; 2008. 5. Kirk GD, Merlo C, O’Driscoll P, Mehta SH, Galai N,
Vlahov D, et al. HIV Infection Is Associated with an Increased Risk for Lung Cancer, Independent of Smoking. Clin Infect Dis. 2007;45(1):103–10.
6. de Groot P, Munden RF. Lung Cancer Epidemiology, Risk Factors, and Prevention. Radiol Clin North Am [Internet]. 2012;50(5):863–76. Available from: http://dx.doi.org/10.1016/j.rcl.2012.06.006
7. Dela Cruz CS, Tanoue LT MR. Lung Cancer,
Epidemiology, Etiology and Prevention Elsevier Inc. USA. 2011;605–7.
8. Society AC. Cancer Facts and Figures. American Cancer Society Inc. 2017.
9. Hong Q, Wu G, Qian G, Hu C, Zhou J. Prevention and Management of Lung Cancer in China. 2015;
10. Bray F, Ferlay J, Soerjomataram I. Global Cancer Statistics 2018 : GLOBOCAN Estimates of Incidence and Mortality Worldwide for 36 Cancers in 185 Countries. 2018;394–
424.
11. Country-specific I, Method N, Country-specific M. 360-Indonesia,Fact -sheet. Vol. 256. 2019.
12. Martasuganda MK, Tjahjono B, Yulianda F. Coastal Tourism Development Planning based on Community and Natural Resources in Pangandaran Regency. 2016;5(5):2102–5.
13. Pramanik PD, Ingkadijaya R. The Impact of Tourism on Village Society and its Environmental. 2018;(July). 14. Walser T, Cui X, Yanagawa J, Lee JM, Heinrich E, Lee G,
et al. Smoking and Lung Cancer The Role of Inflammation. 2008;5:811–5.
15. Malhotra J, Malvezzi M, Negri E, Vecchia C La, Boffetta P. Risk factors for lung cancer worldwide. :889–902.
Available from:
http://dx.doi.org/10.1183/13993003.00359-2016 16. Services US department of H and H. Cancer and The
Environment. 03-2039th ed. United State: NIH Publication; 2003. 1 p.
17. Crane M, Scott N, O’Hara BJ, Aranda S, Lafontaine M,
Figure 1.Category of Respondents
Table 1. Category of Respondents
Variable High Medium Low Total
Socio-demography 5 18 2 25
20,00% 72,00% 8,00% 100,00%
Enviromental 19 5 1 25
76,00% 20,00% 4,00% 100,00%
Policy and Promotion
12 11 2 25
48,00% 44,00% 8,00% 100,00%
Risk Factor 2 8 15 25
8,00% 32,00% 60,00% 100,00%
Table 2. Relationship between Promotion Level and Policy with Socio Demographic Level
Policy and Promotion
level
Sociodemography
Total High Medium Low
High f 2 8 2 12 X
2Calc
= 3,190
% 16,7 66,7 16,7 100
Medium f 3 8 0 11 df = 4
% 27,3 72,7 0 100
Low f 0 2 0 2 X
2Table
= 9,488
% 0 100 0 100
Total f 5 18 2 25 Sig =
0,527
% 20 72 8 100
Table 3. Relationship between Promotion Level and Policy with Environmental Level
Policy and Promotion
Enviromental
Total High Medium Low
High f 12 0 0 12 X
2Calc =
10,048
% 100 0 0 100
Medium f 5 5 1 11 df = 4
% 45,5 45,5 9,1 100
Low f 2 0 0 2 X
2Table=
9,488
% 100 0 0 100
Total f 19 5 1 25 Sig = 0,040
% 76 20 4 100
Table 4. Relationship between Risk Factors with Socio Demographic Levels
Risk Factor
Sociodemography
Total High Medium Low
High f 1 1 0 2 X23,690Calc =
% 50 50 0 100
Medium % f 0 0 87,5 7 12,5 1 100 8 df = 4
Low % f 26,7 4 66,7 10 6,7 1 100 15 X2Table9,488=
Total % f 20 5 18 72 2 8 100 25 0,450 Sig =
Table 5. Relationship between Risk Factors and Environmental Level
Risk Factors
Environmental
Total High Medium Low
High f 1 1 0 2 X
2Calc =
9,649
% 50 50 0 100
Medium f 4 4 0 8 df = 4
% 50 50 0 100
Low f 14 0 1 15 X
2Table =
9,488
% 93,3 0 6,7 100
Total f 19 5 1 25 Sig = 0,047
% 76 20 4 100
5
19
12
2 18
5
11
8
2
1 2
15
0 2 4 6 8 10 12 14 16 18 20