www.adv-radio-sci.net/13/149/2015/ doi:10.5194/ars-13-149-2015
© Author(s) 2015. CC Attribution 3.0 License.
A test method for analysing disturbed ethernet data streams
M. Kreitlow1, F. Sabath1, and H. Garbe2
1Bundeswehr Research Institute for Protective Technologies and NBC Protection, Munster, 29633 Germany
2Institute of Electrical Engineering and Measurement Technology, Leibniz University Hannover, Hannover, 30167 Germany Correspondence to: M. Kreitlow ([email protected])
Received: 13 January 2015 – Revised: 12 May 2015 – Accepted: 22 May 2015 – Published: 3 November 2015
Abstract. Ethernet connections, which are widely used in many computer networks, can suffer from electromagnetic interference. Typically, a degradation of the data transmis-sion rate can be perceived as electromagnetic disturbances lead to corruption of data frames on the network media. In this paper a software-based measuring method is presented, which allows a direct assessment of the effects on the link layer. The results can directly be linked to the physical in-teraction without the influence of software related effects on higher protocol layers. This gives a simple tool for a quanti-tative analysis of the disturbance of an Ethernet connection based on time domain data. An example is shown, how the data can be used for further investigation of mechanisms and detection of intentional electromagnetic attacks.
1 Introduction
Ethernet following the IEEE 802.3 standard (IEEE Standard Association, 2012) is a technique, which is used in many net-work environments. At least the lowest level in big netnet-work installations is usually realised with CAT5e copper twisted pair lines for signal transmission. This enables for data trans-mission using the variant 1000BASE-T, which is also known as Gigabit Ethernet. Twisted pair lines of the category CAT5e do not require a metallic shielding. Therefore, these lines are more susceptible against radiated electromagnetic inter-ferences. Especially intentional interferences have been sub-ject of many investigations over the past years (Mojert et al., 2001; Jeffrey et al., 2004; Parfenov et al., 2008; Brauer, 2010). Amongst others, it was shown that interference from high-power electromagnetics (HPEM) can have a dramatic impact on data transmissions over Ethernet networks.
Typically the effects can be perceived on the application layer with regard to their criticality, e.g. when the data
trans-Application
send_socket() recv_socket()
Transport
Link
TCP/UDP
Interface
Twisted pair cable TCP/UDP
Interface
Physical Interaction
Data transmission
Internet IP
IP
Er
rors pr
opagating
thr
ough layers
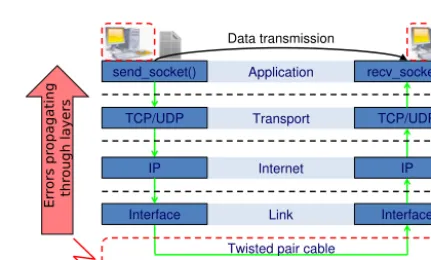
Figure 1. Communication with the TCP/IP reference model.
mission rate of a file transfer drops significantly or an inter-active network application like voice-over-IP shows big lags (Sabath, 2008). In practise, it is very hard to find out what exactly is causing such a behaviour as the effects on appli-cation layer are normally not directly linked to the physical interaction. Figure 1 illustrates the process of logical commu-nication within modern IP networks and physical interaction on the basis of the TCP/IP reference model (Postel, 1981a). This model can be considered as simpolified breakdown of the more general OSI layer model (ITU, 1994).
Errors within the communication can be caused by a hard-ware problem, a bottle-neck in the network infrastructure due to high utilization or even by a intentional electromag-netic interference (IEMI). Observing and detecting the last-mentioned is a real challenge. Reliable detection with field monitors is still subject of ongoing research and in big net-work infrastructures an effective field monitoring will prob-ably be a high cost factor (Adami et al., 2014).
layers, like control algorithms reacting to data errors, have to bypassed. It will be shown that a practical software im-plementation of a new test method gives a finely granulated time resolution of Ethernet frames and disturbances on the physical layer. This data can be used for further analysis to detect IEMI. Additionally this new method allows for testing network equipment with comparable results independently from user applications and specific software environments.
2 Error mechanisms in classical TCP based communication
Many network applications, such as file transfers, require a reliable data transmission. Altering or loss of data is un-acceptable. Therefore typical techniques, like the file trans-fer protocol (FTP), utilize the transmission control protocol (TCP) on the transport layer, as this protocol offers integrated security measures. TCP operates on top of the IP protocol (Postel, 1981b). Whereas IP is only responsible for the log-ical routing of data packets from one destination to another through the network topology, TCP opens the communica-tion endpoint for an applicacommunica-tion.
When testing a network for effects due to EMI, traffic has to be generated. This is often done by simply copying a file from one computer to another while the interference is present (Adami et al., 2012). This approach presents a prob-lem, as the TCP protocol’s integrated security mechanisms will react to occurring packet losses and delays. Therefore, the perceived effects are not linked to the physical processes on the network cables or within the computers. In van Leer-sum (2013) and Kreitlow et al. (2014) it was shown that an observed drop of the transmission speed can be a result of the control algorithms, although the physical degradation of the network is not very strong.
To conclude this, it can be said that investigating an IT network under the influence of EMI with TCP based appli-cations will only give information on this specific network application in a specific network environment. This data is hardly comparable, as the TCP implementation will act as a “black box”. To overcome these issues s new method shall be implemented.
3 Design of a new test method
The basic idea for a new measuring method is not to use a “black box” software like a FTP server/client to generate load on the network, which can be observed using network sniff-ing tools like Wireshark. Rather the data stream itself shall be generated in a well defined way without the influence of software based control algorithms. To achieve this, the user datagram protocol (UDP) will be used. UDP is also a part of the network stack of every modern operating system and operates on top of IP like TCP does (Postel, 1980).
Compared to this, UDP is a stateless protocol that provides no security and integrity checks on the transport layer. If a data packet gets lost or the data gets corrupted within an UDP connection, there will be no way to detect and handle this on protocol level as opposed to TCP. This makes UDP a very simple protocol with less overhead, but for this reason the application itself has to handle segmenting, flow-control and especially loss or corruption of data. Exactly this behaviour of UDP will be used to detect interferences without having influences of unknown control algorithms.
3.1 Testing procedure
As stated before the new method is based on UDP. It consists of a client, which requests a data stream from the server ad-dressed by its IP address. The request itself is sent as an UDP datagram and defines all necessary testing parameters. In par-ticular these are the test duration in seconds and the payload, which is the same for each packet to be sent. The payload size also defines the actual size of the packet. Additionally, there is a possibility to define delay-times for throttling the data transmission by inserting a delay after each UDP datagram. This is usually set to zero to achieve the maximum speed.
After sending the request to the server, the client immedi-ately starts listening for incoming UDP datagrams originat-ing from the servers IP address. The server will process the request and start sending UDP datagrams back to the clients IP address. The first four bytes of each datagram represent an 32-bit integer number, which acts as a sequence number. For each packet this number is increased consecutively, then the packet is filled up with the given payload up to the defined size. This process is running in a loop, that stops, when the server has been sending data for the specified duration.
On the other side of the connection the client will wait for incoming data. If a UDP datagram from the sever arrives, the client will check first check whether the payload speci-fied in the request has been altered. This can be handled as a corruption. In practical tests this will actually never hap-pen as data corruption due to bit flips will cause the frame check sequence of this Ethernet frame to fail. If this happens, the whole frame will be discarded. If an UDP datagram with the correct payload arrives, the sequence number will be read from the first 4 bytes of the datagram. This sequence number in combination with a time stamp is consecutively logged to a file. The client will stop its receiving and logging process, when it receives no datagrams for a specified time. After each test run, the logged data can be analysed off-line. This file will have the following format, where the first column is the time stamp in microseconds and the second column is the sequence number: [time stamp];[SEQ#];.
Requesting data
• Duration, Payload
Receiving Request:
• Process parameters
Send UDP datagram: SEQ# + Payload
SEQ ++;
Duration?
End Receive UDP datagram:
SEQ# + Payload
End
Timeout? •• Check PayloadGenerate time stamp
• Write log-file
Offline analysis Interference
No
Yes
No
Yes
Client Server
Figure 2. Flowchart for the test procedure.
8 bytes
IP header
Ethernet header UDP header SEQ# + payload Frame check sequence Interframe gap
Preamble + start of frame delimiter
20 bytes
14 bytes 8 bytes 18 – 1472 bytes 4 bytes 12 bytes
Figure 3. Frame structure.
this can be directly seen in the log file as the sequence num-ber in the corresponding UDP datagram will not occur, be-cause UDP uses no techniques like retransmission or error correcting for securing the data transmission. Also all fol-lowing Ethernet frames will not be affected by a single event due to the absence of flow control algorithms. By using this behaviour of UDP and the implementation above it is possi-ble to detect interferences with the data transmission with a resolution down to single Ethernet frames.
3.2 Implementation
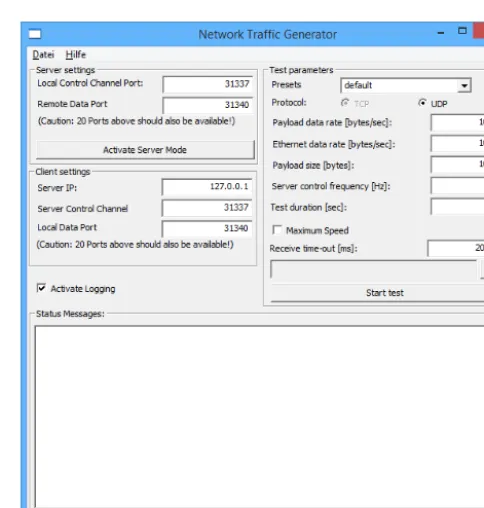
For a of concept the method was implemented in C as a Win32 application. The software has a user interface as shown in Fig. 4. An off-line analysis of the log file was done in MATLAB. However, there are some limitations in this implementation. As every UDP datagram is unique and must be generated in real-time, the maximum transmission speed is currently limited to 7.5 Mbyte s−1 at the moment. This is equivalent to approximately 5000 full-sized Ether-net frames (1538 bytes frame−1) per second. Using high-resolution timers from Microsoft Windows, the time resolu-tion is basically in the range of microseconds. Actually the absolute precision of this timers differs up to 10 % from the exact time in this testing set-up. This is a consequence from the fact, that a high resolution and a good absolute accuracy with negligible drift, while summing up each small time step, is not possible at the same time using the software defined clock of an operating system.
Figure 4. User interface of the test software.
4 Test results
PC1 CAT5e SW1 opticalfiber SW2 CAT5e SW3 opticalfiber SW4 CAT5e PC2
Figure 5. Topology of the test network.
Time [s]
11.02 11.03 11.04 11.05 11.06 11.07 11.08 11.09 11.1
Data transmission rate [bytes/s]
×106
0 2 4 6
Figure 6. Data transmission rate over time.
connected over a line of switches SW1 to SW4. The comput-ers are connected to the switches using CAT5e twisted pair cables. The switches SW2 and SW3 are also connected by twisted pair cables. SW1 and SW2 as well as SW3 and SW4 are linked with an optical fibre. Using an optical connection between these switches ensures that electromagnetic distur-bances can not spread out over the whole network when only one component is exposed to interferences.
4.1 Measuring data transmission rate
Each line in the log file represents one UDP packet and there-fore one Ethernet frame. The size of the frame is defined within in the test software. This information can be used to calculate the current data transmission rateR on the lowest layer as
Rn= S tn−tn−1
, (1)
whereSis the size of the complete Ethernet frame,tnis the
time when the actual frame arrived andtn−1is the time when the previous frame arrived.
Figure 6 shows the result for an experiment where PC2 was exposed to ultra wide band (UWB) pulses with a a field-strength of 7.5 kV m−1 and a pulse repetition frequency of 100 Hz, while PC2 was sending data to PC1. The data shows that the data transmission rate drops with every UWB pulse, but almost no data gets corrupted. In this detailed view only at 11.065 s, where the data rate drops to zero, a packet loss actually happens. From this data it can be deduced, that the data transmission itself is not directly affected most of the time, but the PC delays sending new data for a short time, when it is affected by an UWB pulse.
This time domain data can be used to detect intentional attacks on computers as the pulse repetition frequency is re-flected in the data transmission rate measured with the new method. Otherwise it would be hard to detect due to the
ab-Time [s]
12 12.5 13 13.5 14 14.5 15 15.5 16
Corrupted frames
Figure 7. Corrupted Ehernet frames over time.
sence of exorbitant packet loss, although the transmission speed within applications will slow down.
4.2 Measuring of packet losses
Corrupted Ethernet frames can be detected by enumerating the sequence numbers in the log file. Without disturbances they should increase by one with each line. If the difference between two sequence numbers of two subsequent lines in the log file is higher than one, this indicates the number of missing Ethernet frames. The time stamps give the time win-dow for the data corruption.
Another experiment was done, where an error current was directly coupled into the twisted pair cable between SW2 and SW3. The current also had the shape of an UWB pulse and the pulse repetition frequency was set to 20 kHz. Figure 7 shows at which time Ethernet frames get corrupted due to the interference. Each line in the diagram represents a corrupted frame. Although the disturbance source was permanently ac-tivated, the errors occur in bursts. The reason for this is a beat effect between the the packet rate (∼5000 Hz) and the repetition frequency of the source.
The data show that it is possible to catch single disturbance for a data stream with a high resolution in time. However due to the limited packet rate not every single event on the link layer can be caught as the software is not able to utilize the network line by 100 %. But if an effect occurs while the test software occupies the network line, it will be detected by this method. This makes the approach behind this method suitable especially for detecting repetitive interferences.
5 Conclusions
issue, a new test method was developed and implemented as a simple user application using the stateless user datagram protocol. In contrast to observing normal data transfers from e.g. FTP servers/clients, the effects on application layer per-ceived with this new method are directly linked to the dis-turbances on the physical layer. The results of the method are presented as time-domain data within a resolution in the range of approximately a few hundred microseconds. This data can be used for further investigations using known tech-niques of signal analysis to detect intentional interferences.
The implementation of the test-software is a proof of concept and still under development status. The source code can be requested from the corresponding author.
Edited by: F. Gronwald
Reviewed by: S. Dickmann and one anonymous referee
References
Adami, C., Braun, C., Clemens, P., Jöster, M., Suhrke, M., and Taenzer, H.-J.: High Power Microwave Tests of Media Convert-ers, International Symposium on Electromagnetic Compatibility 2012 (EMC Europe), Rome, Italy, 17–21 September, 2012. Adami, C., Braun, C., Clemens, P., Jöster, M., Suhrke, M.,
Schmidt, H.-U., and Tänzer, H.-J.: HPM-Detektionssystem mit Frequenzbestimmung, EMV Konferenz 2014, Düsseldorf, Ger-many, 11–13 March, 2014.
Brauer, F., ter Haseborg, J. L., Potthast, S.: Protection Circuits for IT Equipment under HPEM Conditions, AMEREM 2010, Ottawa, Canada, 2010.
IEEE Standard Association: IEEE 802.3-2012 – IEEE Standard for Ethernet, Section 3, 2012.
International Telecommunication Union (ITU): Telecommunica-tion StandardizaTelecommunica-tion SecTelecommunica-tion Sector of ITU (ITU-T), InformaTelecommunica-tion technology – Open Systems Interconnection – Basic Reference Model: The basic model, Recommendation X.200, 1994. Jeffrey, I., Gilmore, C., Siemens, G., and LoVetri, J.: Hardware
in-variant protocol disruptive interference for 100BaseTX Ethernet communications, IEEE Transactions on Electromagnetic Com-patibility, 46, 412–422, 2004.
Kreitlow, M., Garbe, H., and Sabath, F.: Influence of Software Ef-fects on the Susceptibility of Ethernet Connections, IEEE In-ternational Symposium on Electromagnetic Compatibility EMC, Raleigh, NC, USA, 3–8 August, 2014.
Mojert, C., Nitsch, D., Friedhoff, H., Maack, J., Sabath, F., Camp, M., and Garbe, H.: UWB and EMP Susceptibility of Micropro-cessors and Networks, 14th International Zürich Symposium & Technical Exhibition on Electromagnetic Compatibility, Zurich, Switzerland, 20–22 Februar, 2001.
Parfenov, Y. V., Kohlberg, I., Radasky, W. A., Titov, B. A., and Zdoukhov, L. N.: The Probabilistic Analysis of Immunity of a Data Transmission Channel to the Influence of Periodically Re-peating Voltage Pulses, Asia-Pacific Symposium on Electromag-netic Compatibility & 19th International Zurich Symposium on Electromagnetic Compatibility, Singapore, 283–286, 2008. Postel, J.: User Datagram Protocol, RFC 768, USC/Information
Sciences Institute, available at: http://tools.ietf.org/rfc/rfc768.txt, 1980.
Postel, J. (Ed.): Internet Protocol, DARPA Internet Program – Protocol Specification, RFC: 791, Defense Advanced Research Projects Agency (DARPA), Arlington, Virginia, USA, available at: http://tools.ietf.org/rfc/rfc791.txt, 1981a.
Postel, J. (Ed.): Transmission Control Protocol, DARPA Internet Program – Protocol Specification, RFC: 793, Defense Advanced Research Projects Agency (DARPA), Arlington, Virginia, USA, available at: http://tools.ietf.org/rfc/rfc793.txt, 1981b.
Sabath, F.: Classification of electromagnetic effects at system level, Proceedings of the 2008 International Symposium on Electro-magnetic Compatibility (EMC Europe), Wroclaw, Poland, 18–22 August 2008, 1–5, 2008.