RESEARCH
Agroforestry and farm income
diversification: synergy or trade-off? The case
of Ethiopia
Geremew Worku Kassie
*Abstract
Background: This study analysed the relationship between agroforestry and non-farm income diversification activi-ties. A survey was conducted on 136 farm households by employing both structured and semi-structured question-naires in four farm villages of Northwest Ethiopia. The bivariate probit model was employed to estimate the simul-taneous adoption of agroforestry and non-farm diversification activities. In addition, a focus group discussion was administered by choosing participants composed of village leaders, male and female farm household heads, young farmers, and key informants.
Results: The result indicated that agroforestry adoption and non-farm income generating activity participation incidences jointly determined significantly and positively by the comparative economic return of adopting the joint activities, moderately secured land property right perceptions, non-farm income and agroforestry adoption experi-ence. On the other hand, as the household is distant from the proximate market and the main road, and a number of oxen the farm household owns have the significantly negative impact on the likelihood of simultaneous adoption likelihood by the farm household on both activities in Northwest Ethiopia. In the focus group discussion, the agricul-tural extension and naagricul-tural resource conservation experts and the participants said that better economic return of agroforestry production compared to food crop farming, less labour intensity of agroforestry than food crop pro-duction, and better land management system for agroforestry than food crop production were found to determine positively the agroforestry and non-farm joint participation decisions.
Conclusion: The findings indicated that substantial parts of the study area have been converted from cereal crop production system to agroforestry land use which enables the community to diversify their income. The farm house-hold participated in agroforestry production not only just from its expected comparative economic return but also from the synergy effects it has with the non-farm income generating activities. Therefore, policy interventions that simultaneously motivate agroforestry and non-farm income diversification activities could enhance the sustainabil-ity of land management and maximise the farm households’ economic return from these joint practices. Accessing farm technologies like fertiliser and improved seed, and institutions such as rural markets and infrastructures for farm households will be helpful to economically empower them in a sustainable way.
Keywords: Non-farm income, Agroforestry adoption, Bivariate probit model, Joint marginal effect
© The Author(s) 2017. This article is distributed under the terms of the Creative Commons Attribution 4.0 International License (http://creativecommons.org/licenses/by/4.0/), which permits unrestricted use, distribution, and reproduction in any medium, provided you give appropriate credit to the original author(s) and the source, provide a link to the Creative Commons license, and indicate if changes were made.
Background
Agroforestry is often defined as an economically viable land-use option on the environmental rehabilitation
and sustainable agricultural development (Djalilov et al. 2016). In terms of land use arrangement, agrofor-estry systems cannot be grouped under foragrofor-estry, rather they are systems that deliver tree products and services (Rahman et al. 2016). Some researchers (Pattanayak et al. 2003) consider it as a joint forest production sys-tem whereby farm inputs are combined to produce trees
Open Access
*Correspondence: geremew_worku@dmu.edu.et; geremewworku@yahoo.com
and agricultural crops on the same plot of land. Empiri-cal evidences on the determinants of agroforestry adop-tion categorized under five groups: economic incentives, biophysical, risk and uncertainty, resource endowments, and household choices (Barrett et al. 2001; Current et al. 1995; Davis 2003; Ellis and Freeman 2004; Ellis 1998, 2000; Farrington et al. 1999; Jagger and Pender 2003; Kifle et al. 2016; Lee 2005; Pandey et al. 2016; Pattanayak et al. 2003; Pender et al. 2001; Scoones 2009; Shiferaw and Holden 1998; Young 1989).
Diversification is widely implicit as a form of self-insur-ance in which people exchange some foregone expected earnings for reduced income variability achieved by selecting a portfolio of assets and activities that have a low or negative correlation of incomes. The accepted wisdom is that diversification is merely an ephemeral phenom-enon or one associated with the struggle for survival in declining economies (Barrett et al. 2001; Ellis 1998; Lan-jouw and LanLan-jouw 2001; Pattanayak et al. 2003). Never-theless, diversification may not be so transitory, and it may be associated with success in achieving livelihood security under improving economic conditions as well as liveli-hood distress in deteriorating conditions. It may transpire both as a deliberate household strategy and as an invol-untary response to the crisis, and as a safety value for the rural poor and as a means of accumulation for the rural rich. Diversification can also bear farm investment and productivity or impoverish agriculture by withdrawing critical resources. Therefore, the causes and consequences of farm diversification are differentiated in practice by location, assets, income, opportunity and social relations (Barrett et al. 2001; Breman 1996; Ellis 1998; Lanjouw and Lanjouw 2001; Mishra and Moss 2013).
Diversification is neither just a rural nor only a devel-oping country phenomenon; rather, it is also a fortitude strategy of urban dwellers in developing countries. It is also becoming increasingly prevalent amongst farm fami-lies in developed countries. Sometimes, diversification is also an emerging facet of labour markets more gener-ally in the industrialised countries, being associated with the rise of part-time and home-based working patterns (Ellis 1998). Conversely, the orthodox outlook of courses of economic change is that they involve transitions between states of economic structure or performance for instance from agriculture to the industrial sector that can be plainly distinguished from each other. The central implication of this view is that economic sectors are com-partmentalised. That is, rural is contrasted with urban, agriculture is contrasted with industry and specialization and division of labour are decisive ingredients for the transformation of national economies rather than diver-sification of inputs and outputs (Barrett et al. 2001; Lan-jouw and LanLan-jouw 2001; Pender et al. 2004).
Most studies revealed that non-farm earnings account for a substantial share of farm household income in rural Africa. There is widespread reliance on non-farm income sources by African farm households (Author and Bryce-son 2002). The question that needs to be justified is that why do households branch out their income? The diversi-fication motives are classified into two; these are pushing and pulling factors (Barrett et al. 2001). Pushing factors include risk reduction, response to diminishing factor returns in any given use, such as family labour supply in the presence of land constraints goaded by population pressure and fragmented land holdings, reaction to a crisis or liquidity constraints, high transaction costs that influence households to self-provision in several goods and services. Quite the opposite, pulling motive factors comprise the realisation of strategic complementarities between activities, such as crop-livestock integration or milling and hog production. An interrelated but distinct role of diversification is to cope ex-post with distresses to income (Barrett et al. 2001; Ellis 1998; Lanjouw and Lanjouw 2001). When crops fail or livestock die, house-holds must reallocate labour to other livelihood pursuits, whether formal employment off-farm (e.g. wage labour), informal employment off-farm (e.g. hunting) or non-agri-cultural activities on-farm (e.g. weaving, brewing). The auxiliary explanation for diversification is the existence of economies of scope in production. Economies of scope exist when the same factor inputs generate greater per-unit profits when spread across multiple outputs than when dedicated to any one output. On the other hand, an economy of scale leans to favour specialisation rather than diversification (Barrett et al. 2001; Ellis 1998; Kimhi and Lee 1996; Lanjouw and Lanjouw 2001).
The majority of the population in developing countries reside in rural areas, and it persists to grow at a substan-tial rate Hayes et al. (1997), Hunt (2000). Given limits to arable and farmland, this growth in the rural labour force will not be productively absorbed into the agri-cultural sector. Either migration to urban areas or the development of non-farm employment in rural quarters must take up the slack (Lanjouw and Lanjouw 2001). The share of non-farm income climbs up in due course among farm households in Africa. For instance, (Ellis 1998) reviewed data from 31 different surveys in 18 Sub-Saharan African countries and reached a conclusion that the share of non-farm income from total income varies from 15–93%. Farm households in Northwest Ethiopia have been engaged in agroforestry practices and non-farm income generating activities such as petty trades, animal-cart transportations, and grain mills to overcome diverse risks in agriculture which usually lead to volatility of livelihoods. Consequently, analysing the determinant factors of the farmland allocation for agroforestry adop-tion practices and its synergy or trade-off with participa-tion decisions to the non-farm activities is imperative to understand (Abdulai and Huffman 2005; Govereh and Jayne 2003).
Methods Study area
This study was conducted in the Mecha District, West Gojam Zone in Amhara National Regional State of Ethio-pia (Fig. 1).
According to 2015 Amhara National Regional State projection, Mecha District has a population size of 370,032 (BoFED-ANRS 2015). In the District, there are 43 kebeles1 from which Ambomesk, Kudmi, Bachima, and Goragot were included in this study. The farming system in these study areas mainly has been concentrated on cereal production; however, in recent days farmers have been shifting their farmlands to tree plantations and have been participating in non-farming income generat-ing activities. The question will be why farm households engage their labour to agroforestry agricultural system by abandoning the customary cereal production. In addi-tion, does the farm household participation in agrofor-estry have a synergy or tradeoff effect with non-farm activities? To address these research questions a survey questionnaire was administered to 136 farm households using simple random sampling technique in the selected kebeles.
1 Kebele is the lowest government administrative unit in Ethiopia.
Focus group discussion
Focus group discussion is becoming increasingly a pop-ular qualitative research method in socio-economic research for discovering what individual farm households perceive in the manner they do. It is a method of get-ting qualitative data from many individuals via informal discussions that are concentrated on a specific research topic (Nili et al. 2014; Krueger and Casey 2014; Stewart and Shamdasani 2014). The method was first dissemi-nated in sociological research and later in marketing studies of consumer behaviours towards demands for commodities. However, during the last two decades, it has been progressively and extensively used in a number of fields (Onwuegbuzie et al. 2009; Krueger and Casey 2014). Methodologically, the focus group is part of quali-tative research, as its main exploration technique is all qualitative. However, dependent on the objective of the research, focus group data can be examined quantita-tively (Rabiee 2004; Morgan 1996; Stewart and Sham-dasani 2014).
Kitzinger (1994) supports the use of pre-existing groups, as consociates could relate to each other’s com-ments and may be more able to argue one another. Per-sonal practice indicates that when exploring sensitive and personal issues the use of pre-existing groups might be advantageous, as there is already an extent of trust amongst the members of the group, which will encour-age the expression of views (Burrows and Kendall 1997; Krueger and Casey 2014). This study uses four groups in which participants across the group did not know each other, however, with in the group there is pre-existing relationships and know each other. The optimum num-ber of participants for a focus group may vary. Some researchers suggest that for a simple research question the number of focus groups necessary may only be three or four (Krueger and Casey 2014). Focus group is unique in its ability to create data based on the interaction of the group interface (Nili et al. 2014; Green et al. 2003; Rabiee 2004).
farm household heads, and young farmers. Moreover, the study used four key informants who are agricultural extension and natural resource conservation experts in Mecha District Agricultural Office. From the discussion farm household heads and key informants were asked why farmers decided to shift their farmlands from food cropping to tree cropping, notably eucalyptus tree pro-duction; how the land use shift affects the farm income and agricultural landscape and finally how it affects the farm income landscape and the land management practices.
Model for simultaneous adoption of agroforestry and non‑farm schemes
Consider a farm household that has a discrete choice of farming and non-farming practices and seeks to max-imise the present value of expected income from pro-duction and participation in non-farming schemes in a specified time horizon. Suppose the same farm house-hold adopts or not adopt agroforestry plantation in its own farmlands. Let Ua and Una represent his expected utility from adopting and non-adopting agroforestry plantations respectively. Let Uf and Unf represent farm household’s expected utility from participating and non-participating in non-farming income generating schemes of the farm household respectively. The latent variables
Ua* (Ua − Una), and Uf* (Uf − Unf) are implicit in being random functions of vectors of observed exogenous vari-able Xa and Xf respectively:
where εa and εf are random errors distributed normally with mean zero and variance one, and βa and βf are vec-tors of unknown coefficients (Greene 2003; Maddala 1986; Maddala and Lahiri 1992). The observable choices of the decision maker are;
Accordingly, following (Greene 2003) the bivariate pro-bit model is designated as:
Ua∗=Xaβa+εa
(1)
Uf∗=Xfβf +εf
Pa=1 if Ua∗>;0; Pa=0, otherwise
(2)
Pf =1 if Uf∗>;0; Pf =0, otherwise
(3) Ya=X
′ aβa+εa
(4)
where Ya represents agroforestry adoption and Yf denotes the participation of the farm households in the non-farm activities. If random factors that determine the two adop-tion decisions are not independent due to unobserved variables that could influence both adoption decisions, then Cov
εa,εf
=ρ. As pointed out in Eq. (1) above the error term of the two activities will have a bivariate nor-mal distribution with mean vector zero and covariance matrix:
This study analysed the synergy or trade-off between agroforestry and non-farm income generating scheme adoptions among the farm households, thus the simulta-neous equation model (SEM) of a bivariate probit tech-nique was employed.
The validation behind applying the bivariate models over the accustomed logit or probit models is that inde-pendently defined univariate logit or probit models can be used to examine the adoption decision for each com-ponent. But when technologies are interconnected, that is, if there is a synergy or trade-off effect between them, such univariate models are inefficient since they disre-gard the correlation in the error terms of equations that could simultaneously explain adoption decisions for these components. The correlation may exist because identical unobserved characteristics may influence adop-tion decisions for all inter-related components. Besides, the single equation models ignore the possibility that a decision to adopt a particular component may be con-ditional on the adoption of another complementary ele-ment and they only examine the adoption of the bundle as a whole disregard the possibility that the same factors could differently stimulus the adoption of each of the components. However, for the comparison purpose, the univariate probit models for agroforestry and non-farm income diversification are showed in the Additional file 1: Appendix.
Therefore, a simplified form of the two inter-related simultaneous equations is set as follows:
The model to designate the actions about Ya and Yf, in this case, simultaneously participations in agrofor-estry and non-farming activities, can be systematically determined. The system of equations from the theoreti-cal model building in the above equations will then be anticipated using a bivariate probit procedure. Subse-quently, assuming the two adoption decisions is defined over the intact set of observations, and consequently, a (5)
∈a
∈f /Xa,Xf/} ∼N
0 0
.1 ρ
ρ 1
(6)
Ya=ϑa+β
′
aXa+εa
Yf =ϑf +βf′Xf +εf
joint decision model of four-system arrays of observa-tions in the following groupings with a non-zero ρ leads to a bivariate model with the probability of the four outcomes:
where Φ and Φ2 are the cumulative distribution func-tion of the standard normal distribufunc-tion and the standard bivariate normal distribution with correlation coefficient
ρ respectively; and Paf, Panf, Pnaf and Pnanf represent the probabilities of adopting both agroforestry and non-farm income generating activity, adopting agroforestry but not non-farm income generating activity, adopting non-farm activity but not agroforestry, and not adopting both prac-tices respectively.
All the dependent and explanatory variables with their expected relations are indicated in Table 1.
Results and discussion Descriptive analysis
Of the total 136 sample households, 69% adopt agrofor-estry farming on their farmlands. Correspondingly, 52.2% of the households have been engaged in non-farm income generating activities while 47.79% concentrated only on on-farm activities. Out of the adopters of agroforestry, 28.72% did not adopt non-farm income diversification activities while 71.28% of them simultaneously joined in non-farming practices. Tables 2 and 3 describe the socio-demographic attributes, farm and economic structures of agroforestry and non-farm income participators.
Regression analysis
Estimates of the joint adoption model using the bivari-ate probit approach, together with the marginal effects of the explanatory variables are indicated in Table 4. The projected parameter enlightened that the null hypoth-esis that ρ (Rho) is zero rejected at the 1% significance level, indicating the validity of estimating the two selec-tion equaselec-tions jointly rather than using the univariate estimation techniques. A positive value for ρ indicated that the unobserved factors that influenced the adoption of agroforestry also jointly determined on the likelihood of participating in the non-farm income diversification activities.
(7)
Paf =Pr
Pa=1;Pf =1
=Φ2Xaβa,Xfβf,ρ
(8)
Panf =Pr
Pa=1;Pnf =0
=Φ
Xaβa,−Xfβf,ρ
(9)
Pnaf =Pr
Pa=0;Pnf =1
=Φ
−Xaβa,Xfβf,ρ
(10)
Pnanf =Pr
Pa=0;Pnf =0
=Φ
The comparative economic incentive essential to those agroforestry and farm income diversification joint activi-ties has a significant and positive impact on the concur-rent adoption decisions. On the margin, citreous Paribas, as the relative economic returns of the agroforestry adop-tion and non-farm activity participaadop-tion enhanced by 1%, the percentage of combined adoption decision by the farm households will be risen by 29.5% units. As farm-ers are rational decision makfarm-ers, they strive to maxim-ise return by allocating their resources, mainly land and labour, for the higher economic return activities. This finding is in line with (Bravo-Monroy et al. 2016; Cur-rent et al. 1995; De Souza Filho et al. 1999; Moreno and
Sunding 2005) who found out that there was a positive and significant relation between economic return and espousal of agroforestry. The study conducted in Tig-ray Region of northern Ethiopia on the role of trees, by estimating economic returns of eucalyptus tree using Internal Rate of Return (IRR), concluded that plant-ing eucalyptus tree yields higher rates of return well above 20% under most circumstances, that is compared to classical farm crop returns (Jagger and Pender 2003). Another study done in Ethiopia at Alemaya, Hitosa, and Merhabete areas on rural households found that the uncertainties surrounding food crop production and the inadequacy of the returns to maintain for the entire year Table 1 Definition of variables and their expected signs
The maximum likelihood estimation techniques estimate the above models; and the analyses of the models are carried out using the statistical package of STATA 13 version
Variable name Definition of variables Expected sign
Dependent variables
Model: AGROECUDUM and
DOFFORNON-FARM Dependent dummies weather a household simultaneously adopt agroforestry and non-farming income generating activities Independent variables
DMALE A dummy for sex of the household head (1=male; 0=female) + (−)
LNRESPOAGE Age of the household head + (−)
FSIZE Family size of the household + (−)
DEPRATIO Proportion of family members whose age is ≤15 and ≥65 to total family size + (−) PROPOSTUDENT Proportion of family members who are students + (−) DUEDU1 A dummy for household head level of education (=1 illiterate; =0 otherwise) − DUEDU2 A dummy for household head level of education (=1 elementary; =0 otherwise) + (−) DUEDU3 A dummy for household head level of education (=1 secondary and above;=0
otherwise) +
FARMSIZE Total farm size of the household +
NONCROPFARM Farmland allocated for non -food crop farming (like chat, vegetable) + (−) DLANDEGRA A dummy for land degradation (=1 if the farmland is degraded; =0 otherwise) + DULANDRIGHT A dummy for land right (=1 if the household perceive moderately secured; =0
otherwise) +
DECONINCENT A dummy for economic incentive (=1 if there is economic incentive of agroforestry;
=0 otherwise) +
LNUMOX Number of ox the household owns +
LNTOTLIVESTOKVAL Estimated livestock value (in 2007/2008 current market price, in log form) + (−) LNEQUEXPER Number of years the household adopts agroforestry in his/her farmland s (in log
form) + (−)
LNTOTOFFORNONFARMY Total income of non-farm activity (in log form) − AVHOMEDISTA Average home distance from the farm plot (in Minutes walk) − AVMARKETDISTA Average home distance from the proxy market (in Minutes walk) − AVROADISTA Average home distance from the main road (in Minutes walk) + CREDITDUM A dummy for credit service (=1 if the household has access for credit service; =0
otherwise) +
push farm households to connect in undertaking diverse activities in seeking additional income from sources other than just for food crop production (Bogale and Hagedorn 2003).
Accesses to infrastructure and institutions by the farm household have the strong significant effect on the joint adoption decisions of agroforestry and non-farm income
schemes. That is, as the farm households have located distant from the market and the main road, they found out to be less participating in adopting both activities. To be precise, as farm households’ residence location from the proxy market and main road increased by 1%, the joint adoption decision of the farm household will be declined by 6.8 and 17.6% units respectively. Conversely, Table 2 Socio-demographic characteristics of agroforestry and Non-farm income generating activity adopters (Pearson chi-square test for categorical variables) (Source: computed from own survey data)
***, **, * shows the significance level at 1, 5, and 10%
Variables Total N = 136 Agroforestry adopters and non‑adopters Non‑farm income diversification activity adopters and non‑adopters
Adopters N1 = 94
(69%) Non adopter N2 = 42 (31%) χ
2‑statistics Adopters N1 = 71
(52.2%) Non adopters N2 = 65 (47.79%) χ
2‑statistics
DAMBOMESK 24.26 29.79 11.90 5.051** 30.99 16.92 3.651**
DKUDMI 25.74 25.53 26.19 0.006 23.94 27.69 0.249
DBACHIMA 25.00 23.40 28.57 0.413 22.04 26.65 0.481
DGORAGOT 25.00 21.28 33.33 2.250 22.54 27.69 0.489
DMALE 72.79 84.04 46.03 19.446*** 81.69 63.08 5.936**
DUEDU1 33.82 27.66 47.62 5.167** 23.94 44.62 6.478**
DUEDU2 32.30 34.04 38.10 0.208 33.21 31.38 0.004
DUEDU3 35.29 41.49 21.43 5.115** 43.66 26.15 4.554**
DOFFORNONFARM 52.21 71.28 9.52 44.366*** – – –
AGROECUDUM – – – – 94.37 41.54 39.54**
CREDITDUM 20.48 19.51 21.43 0.001 21.43 21.54 0.002
DULANDRIGHT 49.26 56.38 33.33 6.170** 59.15 38.46 5.813**
Table 3 Farm and economic structure of agroforestry and non-farm income generating activity adopters and non-adop-ters (t test for continuous variables) (Source: computed from own survey data)
***, **, * shows the significance level at 1, 5, and 10%
Variables Total N = 136 Agroforestry adopters and non‑adopters Non‑farm income diversification activity adopters and non‑adopters
Adopters N1 = 94 Non adopter
N2 = 42 t tatistics Adopters N1 = 71 Non adopters N2 = 65 t statistics
RESPOAGE 43.985 (10.12) 44.277 (10.381) 43.333 (9.624) 0.999 43.746 (9.867) 42.615 (10.86) 0.636 FSIZE 5.743 (1.558) 5.723 (1.513) 5.786 (1.675) 0.214 5.465 (1.548) 6.046 (1.525) 2.203** DEPRATIO 0.378 (0.201) 0.378 (0.205) 0.379 (0.195) 0.043 0.359 (0.212) 0.399 (0.189) 1.192 PROPOSTUDENT 0.420 (0.213) 0.457 (0.184) 0.339 (0.251) 3.052*** 0.454 (0.199) 0.383 (0.222) 1.968** AVHOMEDISTA 61.106 (54.94) 56.297 (54.607) 71.869 (54.802) 1.534 48.654 (47.075) 74.707 (59.86) 2.833*** AVMARKETDISTA 165.232 (148.98) 149.953 (148.37) 199.429 (146.343) 1.804* 129.045 (124.6) 204.759 (163.67) 3.050*** AVROADISTA 142.332 (138.13) 125.529 (134.80) 179.941 (139.703) 2.150** 110.72 (117.76) 176.86 (150.88) 2.862*** FARMSIZE 2.037 (0.841) 2.163 (0.829) 1.757 (0.810) 2.658*** 2.109 (0.739) 1.959 (0.940) 1.036 NONCROPFARM 0.044 (0.123) 0.049 (0.131) 0.030 (0.105) 0.826 0.056 (0.149) 0.03 (0.087) 1.210 NUMOX 2.595 (1.077) 2.776 (1.099) 2.190 (0.917) 3.017*** 2.69 (1.022) 2.492 (1.133) 1.070 TOTLIVESTOKVAL 17553.5 (8066.05) 19338.0 (8059.7) 13559.74 (6575.58) 4.076*** 18994 (7510.16) 15980.14 (8410.23) 2.207**
as farm households have better access to market and road, there will not be information asymmetry about market opportunities, and the transportation and time costs will be significantly declined. Similarly, studies (Barrett et al. 2001) in Uganda and Tanzania, and (Sills and Caviglia-Harris 2009) in Brazil reviled that access to market could significantly promote non-farm earning prospects. Likewise, differences in geographical location of the farm household indicated as a determinant factor for farm households’ variation in joint adoption of the extent of agroforestry and non-farm income activities. This is due to divergences in agro-ecological locations will be resulted in natural resource endowment dispari-ties among rural villages of the farm household.
Male-headed households showed a higher probabil-ity of participating in tree cropping than female headed counterparts. But gender difference has no significant effect on the probability of adopting non-farm income generating practices and on the joint adoption likeli-hoods. This might be because female-headed households may not recognise quickly the benefits gained in agrofor-estry plantations and long-term sustainable land manage-ment activities attributable to their margins in accessing technology and information in the study area. Likewise, the proportion of students in the farm household indi-cated a significant impact on the probability of adopting agroforestry in the farmlands. This may be because the stock of knowledge may help the male farm households Table 4 Determinants of joint adoption of agroforestry and non-farm activity (Source: computed from own survey data)
***, **, and * indicates significant level at 1, 5, and 10%, respectively
Variables Bivariate probit model Joint marginal effects of both activities
Agroecudum Doffornonfarm
Dependent variables
AGROECUDUM (agroforestry adoption) DOFFORNONFARM (non-farm activity) Explanatory variables
DECONINCENT 1.263** (0.506) 0.770** (0.370) 0.295** (0.133) LNAVHOMEDIST −4.231 (0.344) −0.296 (0.350) −0.118 (0.139) LNAVMRKTDIST −2.499* (0.504) −1.172** (0.415) −0.068* (0.165) LNROADISTA −2.134*** (0.331) −0.443** (0.281) −0.176** (0.112) DMALE 0.937** (0.475) 0.491 (0.458) 0.189 (0.169) LNRESPOAGE 0.113 (0.746) −0.138 (1.049) −0.055 (0.416) FSIZE 0.046 (0.146) −0.111 (0.126) −0.044 (0.049) DEPRATIO −0.559 (1.529) −1.615 (1.155) −0.640 (0.458) PROPOSTUDENT 2.131* (1.255) 0.047 (0.929) 0.018 (0.369) DUEDU2 −0.848 (0.463) −0.551 (0.387) −0.213 (0.143) DUEDU3 −0.503 (0.531) 0.314 (0.473) 0.124 (0.186) FARMSIZE 2.682** (1.238) −0.060 (0.557) −0.024 (0.220) NONCROPFARM −1.310 (1.77) 1.772 (1.367) 0.703 (0.542) DLANDEGRA 0.298 (0.361) −0.386 (0.331) −0.152 (0.128) DULANDRIGHT 0.287 (0.418) 1.045*** (0.376) 0.397*** (0.130) NUMOX 0.745** (0.35) −0.458* (0.249) −0.181* (0.098) LNTOTLIVESTOKVAL 0.745 (0.676) 0.224 (0.542) 0.089 (0.215) LNEQUEXPER −0.728** (0.368) 0.485* (0.265) 0.192* (0.105) LNTOTOFFORNONFARMY 0.147** (0.063) – 0.105*** (0.021)
CREDITDUM − 0.114 (0.164) 0.045 (0.138)
DKUDMI −0.315 (0.712) −0.412 (0.550) −0.159 (0.205) DBACHIMA −2.94*** (0.979) −1.006* (0.535) −0.363** (0.161) DGORAGOT −1.302 (0.759) 0.175 (0.604) 0.069 (0.240)
_CONSTANT −11.331 (6.96) −6.393 (6.054) –
Number of obs = 136 Wald χ2 (48) = 57.17
to develop awareness about sustainable land manage-ment and long-term investmanage-ment practices on their plot land.
Farm size has a positive effect on the possibility of agroforestry adoption incidences, but it has no signifi-cant effect on the probability of participating in non-farm income generating activities and joint adoption rates. It is because agroforestry plantation cannot be commenced without having plots of land as they are complemen-tary in use. On the other hand, non-farm activities may not prerequisite owning plots of land; rather these indi-rectly can determine non-farm income generating activi-ties—like income from renting out plots. Another study (Bravo-Monroy et al. 2016) found out that farm-size determined coffee cropping positively and significantly.
Farmers who experienced moderately secured percep-tion of land property rights are found to bend more likely to non-farm activities than those who feel less secured. On the margin and keeping other factors constant, farm-ers who feel moderately more secured about their land rights were 40% units more likely to adopt the joint activities than farmers who feel less protected. This is because when farm households feel more secured about their lands, they may hire out their lands and engage in non-farming activities. For instance, in the study area, some farmers are buying horse and cart and engaged in transporting commodities from home to market and the reverse. Agricultural landowners who feel secured about their farmland ownership are found to participate more intensively in land conservation programs (Yeboah et al. 2015) than their counterparts. Other studies (Bravo-Monroy et al. 2016) found out that farm households who felt secured about their land right were found to adopt agroforestry, and likewise the study (Meinzen-Dick and Mwangi 2009) indicated that formalising property rights in Kenya could reduce ecological stress.
A number of oxen the farm household owned have the positive and noteworthy effect on the probability of agro-forestry plantation. On the other hand, it has an adverse effect on the adoption probability of non-farming activi-ties, similarly, the number of oxen resulted in a negative impact on joint adoption decision. That is, as the number of oxen the farmer owned increase by one, the probabil-ity of the joint adoption decision will be declined by 18% units. This may be because farmers who have more oxen will allocate their resources for intensive farming, rather than engaging in non-farm income generating activi-ties. In the study area, due to the constraints in farming technology availability, oxen have been mainly served as ploughing duties and substituting ploughing tractors.
The supplementary variable that affects the adoption likelihoods is the experience of the farm household on agroforestry adoption. It has a negative impact on the
possibility of additional agroforestry plantations; how-ever, it has a positive impact on the adoption of non-farm income generating activities. On the margin, if the expe-rience in years of the farmer in adopting agroforestry activity increased by 1%, the joint probability of adopt-ing both schemes will be raised by more than 19% units. This could be because farmers who have more experi-ence and early adopters of agroforestry presently would sell their tree products, such as charcoal, fuel woods, and wood poles. The most non-farming activity component in Northwest Ethiopia of Mecha District is transporting eucalyptus tree products from home to the proximate towns, Merawi and Bahir Dar, using carts and trucks. Therefore, farmers who are early adopters can also engage in transporting their eucalyptus tree products with their own carts, and these joint activities can gener-ate better non-farm income.
Non-farm income indicated a significantly positive effect on the simultaneous adoption probability of both agroforestry and non-farm income generating practices. On the margin, keeping other factors constant, if an income from the non-farm activity is increased by 1%, the probability of joint adoption decisions will be lifted up by more than 10% units. This could be owing to non-farm activity operators would have the less available hour to allocate their labour resource for food crop produc-tion purposes. Because food crop farming activity in the study area found to be more labour intensive compared to the tree cropping and thus farm households shift their farmlands for agroforestry, notably for eucalyptus tree plantation purposes. Besides, participating in non-farm-ing activity could solve the cash constraints of the farm household that would induce farm households to per-form long-term investments, which are expected to yield higher returns in the future, on the farm plots compared to the classical agricultural production system in the study area. In addition, the synergetic effect, that most non-farm activity participants in Mecha District repre-sent 64% of the total non-farm operators had their own carts that used to transport tree products to the proxi-mate markets. The major use of carts and trucks include in transporting fuelwood and wood poles of the euca-lyptus tree, which are agroforestry products, from their homelands to the nearest markets. This indicated that the agroforestry participants have been further engaged and integrated into non-farm activities. In line with this, on their empirical work (Bravo-Monroy et al. 2016) noted that off-farm job affected the coffee plantation paths positively.
Agriculture landscape analysis
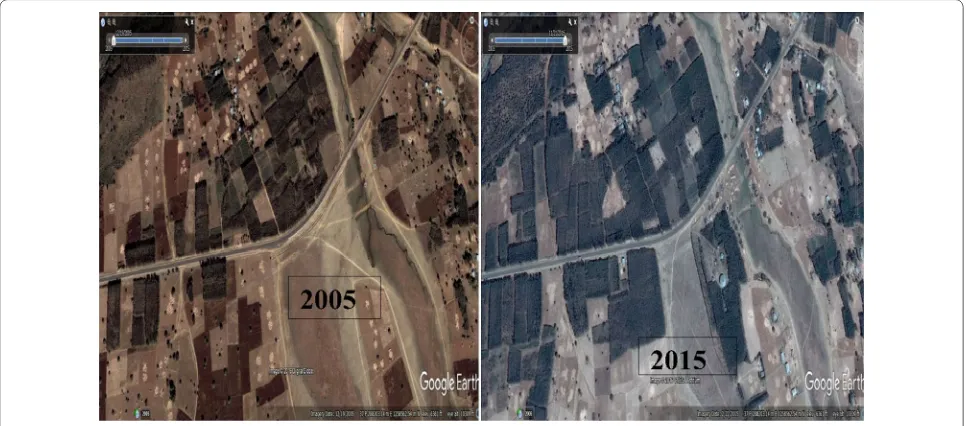
The agricultural extension and natural resource conser-vation experts, who were used as key informants at the Agricultural Office of Mecha District, argued that farm households shift their farmland to perennial crops, nota-bly eucalyptus tree mainly because of four fundamental justifications. First, the economic return generated from producing and marketing eucalyptus tree has been grow-ing from time to time compared to food crop produc-tion. Second, the expenses of farm inputs for food crop production such as fertiliser and improved seed have been rising from time to time, which push farm house-holds to shift their farmlands to agroforestry plantation. Third, food crop production is found to be more labour-intensive and requires close supervision and manage-ment than tree cropping. Finally, focus group participant experts synonymously argued that the urban expansions such as Merawi and Bahir Dar and their dynamic popu-lation growth demand the eucalyptus tree products for constructing residence houses and fuel consumption purposes. The participants also reported that the food crop land has shrunk from time to time while tree planta-tion gets expanded. This has been confirmed using satel-lite data taken from Google Earth globe image that covers from 2005 to 2015 at Ambomesk rural specific village, one of the sampled farm villages, as indicated in Fig. 2.
The land cover analysis has also shown a tremendous change in the notable cereal food crops such as: teff ( Era-grostis tef), maize (Zea mays), barely (Hordeum vulgare),
niger seed (Guizotia abyssinica), and millet (Eleusine coracana) which had been produced for the past many
years in Mecha District now have been replaced by euca-lyptus tree (predominantly by Eucalyptus globulus and
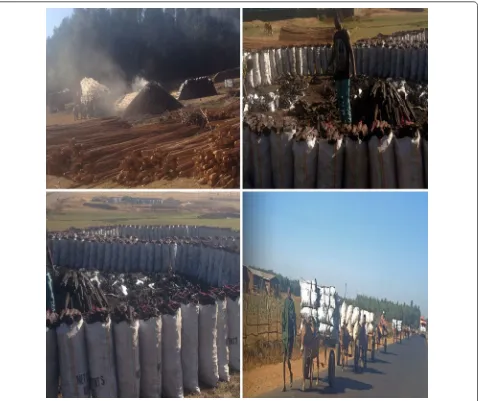
Eucalyptus calamidulensis) as well as by other perennial crops. On the other hand, extension and natural resource experts have described that land conversion from food crop production to agroforestry dominated land use helps to improve the land management system in the area which could substantially reduce the level of soil and mineral erosion. The following figures demonstrated the eucalyptus tree production in Mecha Rural District of Ambomesk and Kudmi Rural Farm Villages (Fig. 3).
From the discussion, the farm households’ income diversification strategy in that particular agricultural landscape shifts from on-farm income to non-farm income sources. The annual income of the participants’ who engaged in agroforestry production has been rising and they confirmed that their income source could be no more limited just on food crop farm income (on-farm income). They described that their income sources have been diversified to non-farm income sources such as pro-ducing charcoal and eucalyptus poles. Some participants have also informed that their annual income could grow by threefold after they engage in agroforestry production compared to their previous routine food crop production practices.
The focus group discussion participants also argued that they preferred to shift their farmlands from produc-ing food crops to tree plantation since tree plantation was found to be more weather shock resilient agricultural system than seasonal food crop productions that mostly
could face seasonal crop failures. In addition, the partici-pants of Ambomesk, Goragot, and Kudme rural villages have explained that after they are engaged in eucalyptus tree production their livelihood has been improved so that they could afford to send their children to modern school, construct better residence houses, and could access better health services. Some of the participants of FGD also reported that while food crop farming in their area depends on rain-fed agriculture and expected to be harvested annually, the tree crop production will not be determined by seasonal variations so that participants could get sustainable annual income (Fig. 4).
Participants also argued that tree plantation could reduce their labour time and input resources compared to annual food crop productions. Therefore, these agro-forestry based farming system helps farm households, especially young farmers to engage in non-farming activi-ties (Figs. 4, 5). Finally, the agroforestry production by the farm households in Mecha Rural District facilitates the development of rural–urban market chain and also helps traders, tree crop retailers and middlemen in Merawi town and Bahir Dar City to generate income and resulted in creating better rural–urban economic linkages.
Conclusion and policy implication
The findings revealed that substantial parts of the study area have been converted from cereal crop produc-tion system to agroforestry land use which enables the
community to diversify their income. Farm households allocate their labour time for non-farming activities dur-ing the slack periods. Subsequently, the household-level synergies have occurred when the farm households’ adoption decision to engage in agroforestry activi-ties have coincided with the participation in non-farm income generating activities. This simultaneous partici-pation decision by the farm households enables them to acquire resources that otherwise would not be accessible to maximise farm households economic returns. There-fore, this study has confirmed that agroforestry practices have been conducted by the farm households not only just from the comparative economic return (from the customary food crop farming) it has but also from the synergetic effect it has with the non-farm income gen-erating activities. Furthermore, farmers allocate their labour time for non-farming activities, notably for the transportation of eucalyptus tree products and other commodities, after planting their farm plots with trees, which is relatively less labour intensive than the annual food crop farming systems.
Fig. 4 Charcoal production and supply to Merawi Town
Acknowledgements
I would like to thank Mecha District Agricultural Office extension and natural resource conservation experts, focus group discussion participants and farm households for their hospitality and generous support in providing me with the necessary information during the data collection and the focus group interview process.
Competing interests
The author declares that he has no competing interests.
Financial and non‑financial competing interests
The Amhara National Regional State helped the author by providing data and the author received no fund from any organisation to publish this manuscript and no article processing fee is received from any source. The author holds no stocks or shares from an organisation that may in any way gain or lose financially from the publication of this manuscript, either now or in the future. The author declares that he has no financial and non-financial competing interests.
Received: 14 May 2016 Accepted: 24 January 2017
References
Abdulai A, Huffman WE (2005) The diffusion of new agricultural technolo-gies: the case of crossbred-cow technology in Tanzania. Am J Agric Econ 87(3):645–659. doi:10.1111/j.1467-8276.2005.00753.x
Author E, Bryceson DF (2002) Multiplex livelihoods in rural Africa: recasting the terms and conditions of gainful multiplex livelihoods in rural Africa: recasting the terms and conditions of gainful employment. J Mod Afr Stud 40(40):1–28. doi:10.1017/S0022278X01003792
Barrett CB, Reardon T, Webb P (2001) Nonfarm income diversification and household livelihood strategies in rural Africa: concepts, dynam-ics, and policy implications. Food Policy 26(4):315–331. doi:10.1016/ S0306-9192(01)00014-8
BoFED-ANRS (2015) Population census estimate of Amhara Region. Bahir Dar, Ethiopia
Bogale A, Hagedorn K (2003). Poverty profile and livelihood diversification in Rural Ethiopia: implications to poverty reduction. In1st international conference on the Ethiopian economy
Bravo-Monroy L, Potts SG, Tzanopoulos J (2016) Drivers influencing farmer decisions for adopting organic or conventional coffee management practices. Food Policy 58:49–61. doi:10.1016/j.foodpol.2015.11.003 Breman J (1996) Footloose labour: working in India’s informal economy.
Cam-bridge University Press, CamCam-bridge
Burrows D, Kendall S (1997) Focus groups: what are they and how can they be used in nursing and health care research? Soc Sci Health 3:244–253 Current D, Lutz E, Scherr SJ (1995) The costs and benefits of agroforestry to
farmers. World Bank Res Obs 10(2):151–180. doi:10.1093/wbro/10.2.151 Davis JR (2003) The rural-non-farm economy, livelihoods and their
diversifica-tion: issues and options. doi: 10.2139/ssrn.691821
De Souza Filho HM, Young T, Burton MP (1999) Factors influencing the adop-tion of sustainable agricultural technologies: evidence from the State of Espı́rito Santo, Brazil. Technol Forecast Soc Change 60(2):97–112. doi:10.1016/S0040-1625(98)00040-7
Djalilov BM, Khamzina A, Hornidge A-K, Lamers JPA (2016) Exploring con-straints and incentives for the adoption of agroforestry practices on degraded cropland in Uzbekistan. J Environ Plan Manag 59(1):142–162. doi:10.1080/09640568.2014.996283
Additional file
Additional file 1: Appendix. Univariate probit estimation of agroforestry and farm income generated activities.
Ellis F (1998) Household strategies and rural livelihood diversification. J Dev Stud 35(1):1–38. doi:10.1080/00220389808422553
Ellis F (2000) The determinants of rural livelihood diversification in developing coun-tries. J Agric Econ 51(2):289–302. doi:10.1111/j.1477-9552.2000.tb01229.x Ellis F, Freeman HA (2004) Rural livelihoods and poverty reduction strategies in four
African countries. J Dev Stud 40(4):1–30. doi:10.1080/00220380410001673175 Farrington J, Carney D, Ashley C, Turton C (1999) Sustainable livelihhods in
practice: early applications of concepts in rural areas, vol 42. Odi, London, pp 1–2. http://hdl.handle.net/10535/4235
Govereh J, Jayne TS (2003) Cash cropping and food crop productivity: syner-gies or trade-offs? Agric Econ 28(1):39–50. doi:10.1111/j.1574-0862.2003. tb00133.x
Green J, Draper A, Dowler E (2003) Short cuts to safety: risk and rules of thumb in accounts of food choice. Health Risk Soc 5(1):33–52. doi:10.1080/1369857031000065998
Greene WH (2003) Econometric analysis. Pearson Education India
Hayes J, Roth M, Zepeda L (1997) Tenure security, investment and productivity in Gambian agriculture: a generalized probit analysis. Am J Agric Econ 79(2):369–382. doi:10.2307/1244136
Hunt RC (2000) Labor productivity and agricultural development: Boserup revisited. Hum Ecol 28(2):251–277. doi:10.1023/A:1007072120891 Jagger P, Pender J (2003) The role of trees for sustainable management of
less-favored lands: the case of eucalyptus in Ethiopia. For Policy Econ 5(1):83–95. doi:10.1016/S1389-9341(01)00078-8
Kifle S, Teferi B, Kebedom A, Legesse A (2016) Factors influencing farmers deci-sion on the use of introduced soil and water conservation practices in the lowland’s of Wenago Woreda, Gedeo Zone, Ethiopia. Am J Rural Dev 4(1):24–30. doi:10.12691/ajrd-4-1-4
Kimhi A, Lee MJ (1996) Off-farm work decisions of farm couples: estimating structural simultaneous equations with ordered categorical dependent variables. Am J Agric Econ 78(3):687–698. doi:10.2307/1243286 Kitzinger J (1994) The methodology of focus groups: the importance of
interaction between research participants. Soc Health Illn 16(1):103–121. doi:10.1111/1467-9566.ep11347023
Krueger RA, Casey MA (2014) Focus groups: a practical guide for applied research. Sage publications, Thousand Oaks
Lanjouw JO, Lanjouw P (2001) The rural non-farm sector: issues and evidence from developing countries. Agric Econ 26(1):1–23. doi:10.1111/j.1574-0862.2001.tb00051.x
Lee DR (2005) Agricultural Sustainability and technology adoption: issues and policies for developing countries. Am J Agric Econ 87(5):1325–1334. doi:10.1111/j.1467-8276.2005.00826.x
Maddala GS (1986) Limited-dependent and qualitative variables in economet-rics (No. 3). Cambridge University Press, Cambridge
Maddala GS, Lahiri K (1992) Introduction to econometrics, vol 2. Macmillan, New York
Meinzen-Dick R, Mwangi E (2009) Cutting the web of interests: pitfalls of formalizing property rights. Land Use Policy 26(1):36–43. doi:10.1016/j. landusepol.2007.06.003
Mishra AK, Moss CB (2013) Modeling the effect of off-farm income on farm-land values: a quantile regression approach. Econ Model 32:361–368. doi:10.1016/j.econmod.2013.02.022
Moreno G, Sunding DL (2005) Joint estimation of technology adoption and land allocation with implications for the design of conservation policy. Am J Agric Econ 87(4):1009–1019. doi:10.1111/j.1467-8276.2005.00784.x Morgan DL (1996) Focus groups as qualitative research, vol 16. Sage
publica-tions, Thousand Oaks
Nili A, Tate M, Johnstone D, Gable G (2014) A framework for qualitative analysis of focus group data in information systems. ACIS
Onwuegbuzie AJ, Dickinson WB, Leech NL, Zoran AG (2009) A qualitative framework for collecting and analyzing data in focus group research. Int J Qual Methods 8(3):1–21
Pandey VC, Bajpai O, Singh N (2016) Energy crops in sustainable phytoremedi-ation. Renew Sustain Energy Rev 54:58–73. doi:10.1016/j.rser.2015.09.078 Pattanayak SK, Mercer DE, Sills E, Yang JC (2003) Taking stock of
agro-forestry adoption studies. Agrofor Syst 57(3):173–186. doi:10.102 3/A:1024809108210
Pender J, Nkonya E, Jagger P, Sserunkuuma D, Ssali H (2004) Strategies to increase agricultural productivity and reduce land degradation: evidence from Uganda. Agric Econ 31(2–3):181–195. doi:10.1111/j.1574-0862.2004. tb00256.x
Rabiee F (2004) Focus-group interview and data analysis. Proc Nutr Soc 63(04):655–660. doi:10.1017/S026144480000536X
Rahman SA, Sunderland T, Roshetko JM, Basuki I, Healey JR (2016) Tree culture of smallholder farmers practicing agroforestry in Gunung Salak Valley, West Java, Indonesia. Small Scale For 15(4):433–442. doi:10.1007/ s11842-016-9331-4
Scoones I (2009) Livelihoods perspectives and rural development. J Peasant Stud 36(1):171–196. doi:10.1080/03066150902820503
Shiferaw B, Holden ST (1998) Resource degradation and adoption of land conservation technologies in the Ethiopian highlands: a case study in Andit Tid, North Shewa. Agric Econ 18(3):233–247. doi:10.1016/ S0169-5150(98)00036-X
Sills EO, Caviglia-Harris JL (2009) Evolution of the Amazonian frontier: land values in Rondônia, Brazil. Land Use Policy 26(1):55–67. doi:10.1016/j. landusepol.2007.12.002
Stewart DW, Shamdasani PN (2014) Focus groups: theory and practice, vol 20. Sage publications, Thousand Oaks
Yeboah FK, Lupi F, Kaplowitz MD (2015) Agricultural landowners’ willingness to participate in a filter strip program for watershed protection. Land Use Policy 49:75–85. doi:10.1016/j.landusepol.2015.07.016