RESEARCH ARTICLE
Rivers as integration devices in cities
Ehsan Abshirini
1*and Daniel Koch
2Abstract
Background: As dynamic systems rivers and cities have been in interaction under changing relations over time, and the morphology of many cities has risen through a long and steady struggle between the city functions and the river system flowing inside. This makes river cities an interesting case to study how the presence of geographical features interacts with spatial morphology in the formation of cities.
Methods: The basis of this research is enabled by utilizing a novel model for cross-city comparison presented by Hillier in his Santiago keynote in 2012 called a “star model”. This is done on large samples of cities investigating concur-rent configurations, as well as how the properties in this star model react to specific forms of disturbance.
Results: Results illustrate that the foreground network as identified through maximum choice values in cities are more vital to the structure of cities than the bridges. The overall syntactic structure tends to retain its character (degree of distributedness) and the location of its foreground network (which street segments constitute the fore-ground network) even when bridges are targeted. Furthermore, counter to the initial hypothesis, river cities tend to change less than non-river cities after targeted disturbance of the systems. Finally, the results show that while there is a statistical morphological difference between river cities and non-river cities, this difference is not directly explained through the bridges.
Conclusion: Integrating space syntax with statistical and geospatial analysis can throw light on the way in which the properties of city networks and urban structure reflect the relative effect of rivers on the morphology of river cities. The paper, finally, contributes through offering one piece of a better perception of the structure of river-cities that can support strategies of river-cities interaction as well as enhance our knowledge on the constraints and limits to that interaction.
Keywords: River-cities, Morphology, Space syntax, Structured or distributed city, Foreground network
© 2016 Abshirini and Koch. This article is distributed under the terms of the Creative Commons Attribution 4.0 International License (http://creativecommons.org/licenses/by/4.0/), which permits unrestricted use, distribution, and reproduction in any medium, provided you give appropriate credit to the original author(s) and the source, provide a link to the Creative Commons license, and indicate if changes were made.
Background
Rivers, as an important element of urban geographical environments influencing and confining the urban struc-ture morphology, have been a vital part in the emergence of societies (Silva et al. 2006). Rivers characterize not only a primary circumstance for growth and development of many settlements but they also affect the artistic quality of urban forms as well as the functionality and size of cit-ies (Čakarić2010).This paper develops on the morphol-ogy of urban space, as a field of scientific discourse on the built environment. The Paper aims to elucidate the
effects of the presence or absence of rivers on the mor-phological configuration of street networks. Thus riv-ers are considered as solid morphological phenomena with discerning boundaries from the surrounding areas. Therefore the physiography of rivers in their own right, although an important factor that is the focus of a large part of river studies (Kubat 1999; Ellis et al. 2007; Cengiz 2013; Jawarneh et al. 2015), is not examined in this paper.
It is further based on the consideration that analysis of the spatial patterns of settlements can further lead to knowledge about the social norms of societies. As this is said, it is important to clarify that we do not intend to postulate a direct link from a certain spatial pattern to a certain set of social norms; cities need to be understood as complex systems with inherent dynamic parameters, large numbers of discrete actors and a heterogeneous
Open Access
*Correspondence: ehab@kth.se
1 Division of Geoinformatics, Department of Urban Planning and Built Environment, KTH (Royal Institute of Technology), 100 44 Stockholm, Sweden
Page 2 of 21 Abshirini and Koch City Territ Archit (2016) 3:1
nature (Crooks 2012). This heterogeneity also concerns how a specific city population makes its relation to the spatial pattern through individual and collective pro-cesses—the current situation of a city is the result of con-tinuous interactions and the interrelationships between people, space and objects. These processes take also part in structuring cities, as is cognitive, social and mental aspects with various degrees of direct relations to the physical environment (e.g. Portugali 2011, Batty 2013, Frank et al. 2001), meaning that ‘society and space’ affect one another rather than one depending on or emerging from the other. We acknowledge that given this complex nature of the city and its involving characters including spatial and socio-cultural objects, describing the behav-ior of such a complex dynamic system only with one analytical approach is insufficient. Therefore, as we dis-cuss relations between spatial morphology and society in the coming, the limited methodological focus is seen as offering grounds to start reasoning around on how the analysis can contribute to a by necessity much larger and broader field addressing society-space relations. In the respect of realization and substantiation of the real evolution of the mentioned complex system many efforts have been made by researchers in recent decades lead-ing to a bottom-up approach model called agent-based modeling (Batty 2005, 2008). Thus, even though it can be said that spatial patterns, or morphology of space, is one of the more consistent means through which society reifies itself, the extent to which this is done and what relations in society comes to be embedded, vary greatly (Hillier and Hanson 1984). This forms an important rea-son why the work of Hillier and others form the basis for the research presented in this paper, even if the specific relation between spatial and social aspects are not closely investigated.
In the extension of the research presented here, a fuller address of how the effects on spatial morphology found herein relates to other parts of socio-spatial relations and patterns is of importance as at this point, many of the social implications can only be inferred. Such an inves-tigation should clearly more concretely take into account individual perceptual and cognitive capacities and its relation to legibility and imageability of space (e.g. Lynch 1960; Frank et al. 2001; Montello 2001; Peponis 2012). To further elucidate how individual cognition, dynamic social interaction processes and emergent complexity (e.g. Portugali 2011) would be affected, agent-based mod-eling (e.g. Ferber 1999; Batty 2013) would offer signifi-cant input to what in this paper remains a base reasoning built on findings on relations between specific aspects of behavioral patterns and syntactic properties in space syn-tax research. Our aim is simply to refine how we perceive the addition syntactical analysis can offer amongst all the
technical, functional, social, spatial and other factors that would need to be studied to address ‘social’ or ‘societal’ effects of disturbances as tested here. Agent-based mod-eling is here especially of interest since it can account for how cities are complex and highly dynamic in both space and time (Crooks et al. 2014). In this light, we consider spatial configuration as offering a spatial interface (Hillier and Hanson 1984; Koch 2013) for individual and collec-tive action and interaction, which has purchase on the ranges of probable and possible emergent patterns, but where the specific patterns are subject to complex pro-cesses reaching beyond what an analysis of spatial config-uration can provide. However, as the investigation to be presented here is focused on syntactic properties, it is in order to more thoroughly review earlier related research in this field.
This paper focuses on the spatial properties specifi-cally to advance theory and knowledge on spatial con-figuration, and to develop further how this can be worked with in large samples of cities. As examples of working with large samples of cities in the context of space syn-tax we can notice to some research done earlier although the objectives are different from this paper. Early work of Peponis et al. (1989) attempts to decompose cities by choice values to found a syntactic typology. Furthermore Shpuza in a series of papers Shpuza (2006, 2011, 2013, and 2014) study different syntactical measures of Adri-atic and Ionian coastal cities prepared for three historical stages between 1800 and 2010. In a recent paper, titled algometry in the syntax of street networks (Shpuza 2014), he tried to explore generic principles of urban evolution and urban growth using quantitative analysis of algo-metric effect on space syntax properties such as depth, choice, and entropy.
the contribution of the river to these cities. Their findings show dissimilarity between the two cities in their inter-action with river space as manifested in the high degree of urbanity in one city and the low degree of urbanity in another city. They point out the importance of social relationships and the interaction between people and the river side as the configurations that endorse the degree of urbanity in river-cities. Their work therefore points to aspects of river city morphology as analyzed through space syntax methods that complement the research of this paper, where we believe it is crucial to follow up in the future.
Space syntax as a set of theories and tools used for morphological analysis originally emerging in the field of architecture and analysis of settlements (Hillier and Hanson 1984; Hillier 1996; Hillier et al. 2012; Penn et al. 1998) can play a significant role in the research aimed to better understand the way a city’s structure and physical form relates to the presence of a river. One reason is that it allows gaining in-depth knowledge on a particular set of aspects of the morphology through focused analysis that concerns the material configuration of spaces into networks and systems. The interpretation of the configu-rational network morphology of river cities and the con-tribution of rivers to the development of their physical form will be of value to planners, urban designers, and architects.
This paper aims to benefit from statistical and geospa-tial analysis integrated with analysis of syntactical prop-erties of cities, utilizing the former’s tradition to work with large samples of data to gain knowledge of general tendencies and common patterns, while the latter is often concerned with specific understanding of smaller sam-ples or individual cities. Analysis of larger samsam-ples does exist and several methods used to enable the integra-tion of geospatial analysis and space syntax in this paper come from this research (Hillier et al. 2012; Peponis 2012; Shpuza 2014). This research aims to –in an explora-tive way- extract patterns formed by the effect of rivers on urban spatial structures in river cities and compare them to the same morphological properties in non-river cities. In this analysis the river cities form the primary study and the non-river cities the control sample. One purpose is to methodologically and theoretically show how a large sample of river-cities can be analyzed and to begin to unearth if there are morphologically recogniz-able types or physical forms that coincide with the river-cities. Finally, the paper aims to study these properties under the hypothesis that the limitation to the morphol-ogy of urban space placed on cities by the need to bridge the water affects how they react to changes and strategi-cally develop in relation to these particular acts of cross-ing. In this way we expect that cities affected by the rivers
streaming through them show even slightly different pat-terns in comparison to cities without river.
Finally in this research we try to increase the under-standing of relations between architectural and urban morphology and topography, and hereby contribute to the way we understand cities as responses to social, cul-tural, functional, nacul-tural, and technical conditions in a broader sense as outlined above. The aforementioned premises are the reasons why this research is focused on finding possible scientific-theoretical and practical elements of the effects of rivers on the physical form of cities.
The sample: data and area of research
Due to the comparative and explorative structure used in this paper and thanks to the pattern- recognition basis of the research, one of the big concerns in doing this research was collecting a good sample of cities from dif-ferent sizes and in difdif-ferent countries, a time-consuming, tedious, and costly process that often needs adequate resources, appropriate funding, and sufficient time. Prov-identially, nowadays with coming into existence of vol-unteered geographic information, which presents tools for creating and assembling data provided voluntarily by people (Goodchild 2007), GIS researchers and users have access to a massive resource of geographic data called user generated content. In this paper we benefit from the open street map (OSM) database which is a project aim-ing to produce and freely distribute digitally editable geo-graphic maps and data of the world in different formats through the World Wide Web (Haklay and Weber 2008). We prepared data in the format of shape files from Geo-fabrik’s free download server (2015) which contains data extracts from OSM project which are normally updated every day and in the different file formats ( http://down-load.geofabrik.de). It should be noted that the data needs some editing to be ready for the analyses, and that this data is susceptible to the quality of user generated con-tent. As the focus is on larger scale phenomena and a large sample of cities, their quality has been judged as adequate for the purpose of the research.
Page 4 of 21 Abshirini and Koch City Territ Archit (2016) 3:1
Due to the emphasis of this paper on river-cities as well as time- consuming process of data collection and data preparation so that they meet our conditions (same size, same location, and reasonably without river or any other egregious morphological phenomena like mountain and seas), we decide to confine the number of non-river-cities to 21, which while a smaller sample it is still statistically significant.
Methods
The measures: normalized angular choice, normalized angular integration, and the star model
The basis of this paper is calculating the normalized angular integration (NAIN) value and normalized angu-lar choice (NACH) value. These two key properties in space syntax are comparable to closeness central-ity (Bavelas 1950) and betweenness centrality in graph theory (Freeman 1977) (for more information see Hillier et al. (2012). Integration has been defined as the degree to which each segment is accessible from all others in a sys-tem. According to Hillier and his colleagues, integration value shows the “to movement” property of a space and reveals how easy and how often a route or segment would
be passed through by pedestrians (Hillier et al. 2012; Hill-ier and Iida 2005). Choice has conceptually been more concretely defined in relation to movement, and is calcu-lated as the number of shortest paths that passes through each segment of all shortest paths between all pairs of segments in a system. According to Hillier and his col-leagues, this shows the “through movement” property of a space and explains how likely it is a pedestrian would pass through a segment on a trip or how probable (how many times) a segment would act like a bridge along the shortest path between all others (Hillier et al. 2012; Hill-ier 2009; Hillier and Iida 2005).
As time has gone by, space syntax research has devel-oped new techniques which enable researchers to be more attentive to differentiations revealed in the struc-ture and spatial configuration of different cities. Angular segment analysis (ASA) is one of the methods recently added in the segment analysis which has shown relatively better relationships to movement pattern than the same properties in axial line analysis (Hillier et al. 2012; Hillier and Iida 2005). Additionally, it has been demonstrated (Turner 2007; Dalton et al. 2003) that ASA properties are free of some axial line problems as highlighted by Ratti Table 1 Collection of river-cities and non-river-cities studied in this paper
City (with
river) Country No. of segments City (with river) Country No. of segments City (without river) Country No. of segments
Amiens France 8910 Lohr Am Main Germany 8823 Aix
-En-Provence France 27666 Angers France 25,058 Maghull UK 1618 Basingstoke UK 19,825 Aschaffenburg Germany 24,108 Montlucon France 7771 Beaun France 4130 Auxerre France 4526 Leicester UK 30,559 Beauvais France 5486 Bergerac France 6998 Oberhausen Germany 26,349 Böblingen Germany 9971 Blackburn UK 6854 Örebru Sweden 18,013 Braga Portugal 23,529 České
Budějovice Czeck Republic 7057 Orleans France 7410 Châteaubriant France 3608 Český Krumlov Czeck Republic 1953 Prerov Czeck Republic 2430 Colmar France 10,237 Charleroi belgium 29,397 Saintes France 4428 Coventry UK 46,253 Châtellerault Franceance 5078 Saint-Quentin France 9999 Gloucester UK 16,098 Cluj-Napoca Romania 8789 Schweinfurt Germany 22,085 Harrogate UK 8500 Criel-Sur-Mer Franceance 2938 Tours France 20,561 Issoudun France 2605 Dax France 5100 Umeå Sweden 33,895 Les Herbiers France 4575 Dresden Germany 86,828 Valenciennes France 4304 Luton UK 14,688
Fontenay-Sous-Bois France 4434 Venlo Netherlands 15,779 Mansfield UK 7757 Haarlem Netherlands 17,254 Villeneuve France 6112 Modena Italy 25,396 Helmond Netherlands 24,550 Vilnius Lithuania 43,366
(2004). In the meanwhile, the choice value is also gaining popularity in the recent works of researchers. It shows a correlation to movement on par with, and in some cities better than, integration as a traditional measure of space syntax (Hillier and Iida 2005; Turner 2007).
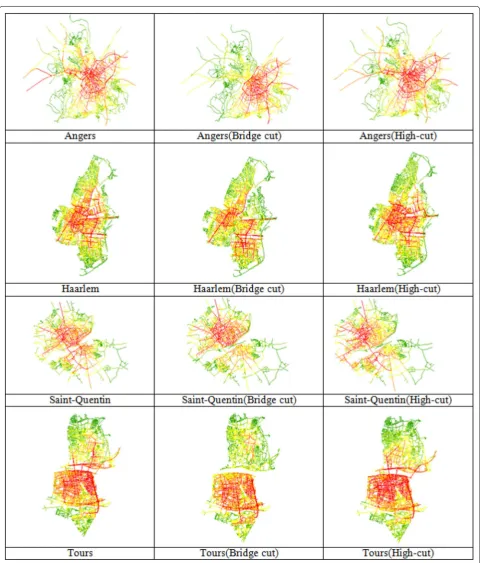
Although the integration value for axial analysis origi-nally was normalized, this initially was not done for the angular measures for methodological reasons as well as the way the measures were used; normalization becomes important primarily when the measures of different sys-tems are compared which has not been the focus of most research using angular analysis. In order to avoid having large amount of values for choice which makes calcula-tion and especially spatial comparison between cities in different sizes problematic, Hillier et al. (2012) suggest a method of normalization of angular choice and angu-lar integration values. In this way not only the calcula-tions are free of large spreads of values but there is also an opportunity to compare different cities with different sizes and even streets with cities. In addition, they show that the normalization in this way slightly improved the correlation between choice and the movement rates. Figures 1, 2 and 3 show a subsample of river-cities and non-cities and their extractions (cut, river-high-cut, and non-river-high-cut samples discussed in the next sections) illustrating NACH and NAIN properties.
Presenting a way of comparison between cities based on normalized values, Hillier et al. establish a star model and try to compare and interpret the structures and spa-tial configurations of different cities in terms of struc-tured and distributed cities or organic and planned cities. Before going through the characters of a star model, we concisely describe the properties of these two differ-ent types of spatial configurations of cities. A structured city is a city where there is a clear differentiation of the network role of different street segments; that is, where there are a smaller set of streets that are more central, and a high number of streets that rely on these central streets for their global connections. A distributed city, in comparison, is a city where the streets have a more simi-lar network role, and where the dependency on specific streets for global connectivity is less in favor of a larger portion of the network operating as global connectors to an equal extent (Hillier et al. 2012).
Elaborating on the complexity of spatial configuration as spatial embedding of socio-cultural relations, a range of studies have shown its relevance and importance, but simultaneously the complexity with which configuration of space relates to social and cultural questions which necessitates inclusion of other factors in the analysis (Hillier and Hanson 1984; Markus Thomas 1993; Hillier 1996; Hanson 1998). As a specific example Karimi (1997)
conducted space syntax research comparing six Iranian cities representing the Islamic tradition cities and six England cities representing the western medieval cities based on integration derived from axial lines. The results showed that although cities from the same category (genotype) tend to represent different spatial characters, they share common characters especially at local levels. He also shows that English cities are shallower and more connected than Iranian cities which were deeper and less connected. The integration core was denser and more compact in Iranian cities.
In another comparative study between a sample of 12 American and European cities, (Major 1997) using space syntax analysis tried to show the similarities and dissimilar-ities in the spatial structure between the two classes of cit-ies based on axial line integration in local and global scale, depth and connectivity along with metric characters such as area and length of line and segment length. He found that American cities are well-structured and do not show typically a geometrical grid, but preserve their formal com-position as they grow in size. European cities, similarly, also tend to preserve their spatial structure during the growing process, which comes from their core. Both thus show a tendency for preserving the primitive plan.
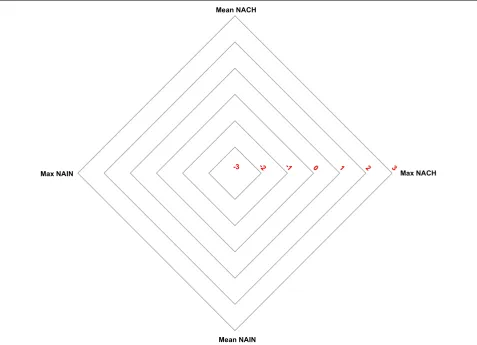
While there thus are tendencies on a generic level to be links between how structured and how planned a city is; this is not the concern of our research that focus on the question of structured versus distributed systems. The central methodological reference to large portions of this study is the research on comparison of the overall config-urational properties of cities developed by Hillier and his colleagues (Hillier et al. 2012) called star model. The star model, as shown in Fig. 4, is based on four measures all extracted from normalized ASA properties placing one measure on each corner.
Mean choice and mean integration values which meet the background properties of a city network are placed at the top and down of the model. Maximum choice and maximum integration values which match the fore-ground properties of a city network are set at the right and left side of the model respectively. To make these four measures comparable to each other, standardiza-tion is conducted on each set of measures varying from −3 at the center, showing the minimum value for that measure, to +3 at the edge of star model, showing the maximum value for that measure. Figure 5 shows the star models prepared for a subsample of cities illustrated in Figs. 1–3.
Page 6 of 21 Abshirini and Koch City Territ Archit (2016) 3:1
Fig. 1 Illustration of NAIN value for a subsample of river-cities, river-cut and river-high-cut group. In all figures the color range varies from green to
left side of the model, the more structured the city is (Hillier et al. 2012).
Coming back to our research specifically, we intend to clarify if and how the space syntax properties explore the effect of the presence of a river on the configurational
form of cities and if and in addition by use of a control sample compare how rivers make the structure of cities different from non-river-cities.
In the next steps, data preparation for different analyses conducted on our sample is explained;
Fig. 2 Illustration of NAIN value for a subsample of non-river-cities and non-river-high-cut group. In all figures the color range varies from green to
Page 8 of 21 Abshirini and Koch City Territ Archit (2016) 3:1
Bridges and cities with river banks
In geography a river bank is defined as the land beside the body of a river in which its slope can differ from vertical to horizontal (Leopold et al. 1964). Here we use this term in a wider range including the infrastructure of a city located in each river-bank connected to the opposite side of the river by crossing bridges. A bridge across a river is one of the most morphologically and a visually recognizable objects in river- cities. It plays a significant role not only from aesthetic point of view but also has a great effect on the connection and transportation between riverbanks. Bridges are currently the most common way, among all other ways like e.g. shipping or tunneling, to connect two river-banks together (Hölzer et al. 2010) and additionally convey economic and cultural meaning in cities as well (Chang and Choo 2009; Ioannidis 2011; Psarra 2012).
In this respect, giving a role to bridges to study the effect of rivers does not mean that we limit the effect of a river on the structure of a city to the bridges across it. We need to have in mind that bridges are only a part of the relation between city and river, and the bigger part might be the city itself. There are many cities settled in a side of rivers without any bridges while the river still shows its effect on development and expansion of the city. How-ever, we here try to understand the effect of rivers on the spatial form of cities by using the role of the bridges in connecting the city, through correlation studies of sys-tems with and without bridges.
An initial hypothesis here is that the cities are structured around the bridges, and that they constitute central, key structural parts of the city network. If this is true, remov-ing the bridges should lead to dramatic changes of the configurative characters of the cities. Furthermore, river cities would be comparatively more sensitive to this kind of change than cities without rivers or similar geographi-cal conditions that enforce key structural connectivity ele-ments. To test this hypothesis, we simply cut all connecting bridges from the city and conduct a space syntax analysis on the remaining part of the city and extract the proper-ties. We henceforth use the term of river-cut for this type of analysis. Figures 1 and 3 illustrates NACH and NAIN properties for a subsample of river-cut cities extracted from river-cities by cutting the bridge connections.
Cutting the highest value of choice measure
In order to understand the structure of river-cities, we compare the results to a control sample of non-river- cit-ies in terms of structure and urban form consisting of 21 non-river-cities about the same size as the river-cities with a similar geographical as well as size distribution. In the first step, non-river-cities are analyzed in the same way as the river-cities based on angular properties, and then followed by the comparison to river-cities in their properties and their star models.
Working under the initial hypothesis of a central sys-temic role of bridges, there is a challenge to identify
similar segments in non-river cities. Since we are look-ing after segments of central importance to structur-ing the city, this does not translate easily to ‘bottleneck segments’. We have chosen to consider the property best corresponding to the hypothesized role of bridges to be those included in what Hillier (2009) names the fore-ground network; i.e. the limited number of segments that tend to have a distinctly higher centrality than the other segments operating as connectors in the city’s configura-tion. It is worth mentioning that the number of segments, with the highest values of choice measurement, which were cut from each river-city, is the same as the number of segments which forms the bridges in that city. Also for the non-river-cities, it is the same as the number of segments cut in the river –cities with the same size. Our stress on the size and number of cutting segments is to establish comparability between the effect of bridges (in wider view rivers) and the effect of the highest values of choice (in a wider view foreground network). For reasons
that will become clear, we also made a sample where the method of cutting segments was exactly the same in river cities as in non-river cities. In this respect we will have two types of results from a mathematically consistent method; river-high-cut (Figs. 1 and 3) and non-river-high -cut (Fig. 2) pointing out respectively to the river-cities and non-river-cities in which the segments including the highest values of choice measurement are cut from them.
At the end we need to note that the idea of cutting bridges or the highest choice values which to some extent evokes the foreground network is unique and not remarked in any similar research in space syntax. The only possible work which may show some similarities is Shpuza’s paper, (Shpuza 2013), on the effect of fore-ground network properties such as length and connec-tivity on the integration of street network in order to quantify this effect he defined the foreground network in four different thresholds including the highest 90, 80, 70, and 60 % values of choice. He showed that among them
-3
Mean NACH
Max NACH
Mean NAIN
Max NAIN -2 -1 0 1 2 3
Page 10 of 21 Abshirini and Koch City Territ Archit (2016) 3:1
the mean length and the mean connectivity of the 80 % foreground network had the highest influence on the axial map integration. The method also has conceptual similarities to some of Hillier’s investigations in ‘the laws of the field’ (Hillier 1996b) where he identifies how within the confines of a grid, inserting walls have different dis-tance and configurational effects depending on where in the field they are added—and consecutively where addi-tional walls are added in relation to earlier additions. It also similarly relates to some investigations of office floor plate shapes and configuration by Shpuza (2006) that studies how interruptions in floor plan layouts by e.g. structural elements have different effects depending on both floor plate shape and organization of work places in offices.
Result and discussion
We intend to make the comparisons between our sam-ples in two ways: a statistical part which includes cor-relation between different properties, and an anova test to verify if our data are significantly different from each other in their mean. Then in the main part, we figure out star models of cities for different groups of samples and analyze and interpret the different tendencies observed in different groups. We need to remark that due to a big sample of cities we are not going to thoroughly dis-cuss the result for each unique city but the research is based on the general trend perceived in each group and
comparison between them. Future research may further elucidate if and how differentiation within the samples is further related to other morphological properties of riv-ers or other geographical conditions.
Basic statistical analysis
As seen in Table 2, we have the correlation between the size of cities (NC) in a logarithmic scale and all normal-ized angular properties (NAP) including mean and maxi-mum choice values and mean and maximaxi-mum integration values for the both river-cities and non-river-cities. Based on the correlation values, there are no significant relationships between the size of cities and NAP suggest-ing that NAP is independent of size as Hillier et al. (2012) commented. It is worth nothing that the correlation val-ues for the river cities are greater than the correlation for the non-river-cities in all cases and among them; maxi-mum integration (and maximaxi-mum choice show the higher correlation in both groups. Also based on Table 2 which shows the correlation between each pair of properties, the correlation between mean and maximum integration is the highest among all, as expected the mean is a well-dependable forecaster of the maximum in NAIN (Hillier et al. 2012).
However, this value differs in different groups of cit-ies as shown in Table 2; it is the highest for non-river- high-cut cities with a value of 0.968 and the lowest for the river-cut with 0.621. Bridges seem more related to
the accessibility than the through movement(choice). The maximum changes among different groups of river-cities is for maximum integration in river-cut (0.631) while this change for mean integration is at the minimum level (0.135) for river-cut at the same time. This will be further explained later (Table 7) as it depends on addi-tional methodological steps to be explained first. This might explain why the correlation between these two properties for the river-cut is the lowest among all espe-cially when we can see that changes between maximum and meanintegration for the other cases are very close to each other.
As the general patterns explored in almost all pairwise correlations, the pair of mean and maximum integra-tion and the pair of maximum integraintegra-tion and maximum choice shows the highest correlations, conversely the cor-relations between the pair of mean choice and maximum choice and the pair of mean choice and mean integration are the lowest among all.
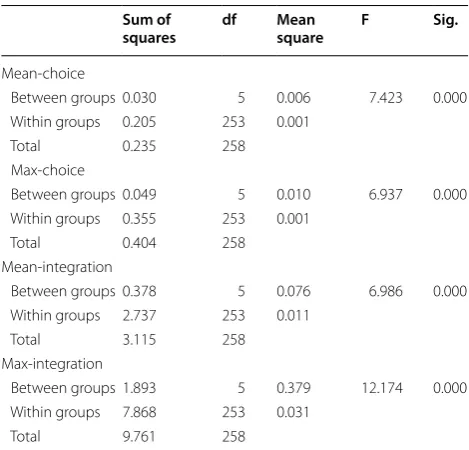
Doing further analysis is reasonable when we can ver-ify that there is a significant difference among different groups of cities (five different groups) prepared for the analysis (Field 2007). Without performing the anova test we could not say for certain if rivers have any effect on the form of cities or not, since the anova test ensures that the samples are valid for comparative analysis. This literally means that space syntax analysis alone is not able to reveal the influence of morphology on cities. To do so, auteurs apply the anova test. Analysis of variance (ANOVA), developed by Fisher (1932), is the most accepted statisti-cal methods used to analyze the differences among group means. The result of anova generally shows if the mean of samples in different groups are different. The null hypoth-esis which needs to be rejected, in this case, is that the samples of cities in different groups are derived from pop-ulations with the same mean values. To do so, the test of anova along with the test of homogeneity and the robust test of equality of means are conducted. Based on the test of homogeneity, shown in Table 3, which means that the
population variances in each group are equal, the p value of Levene’s test for all variables are higher than the signifi-cance level (p < 0.05). This means that the null hypothesis assuming that variances of the populations from which different samples are drawn are equal is accepted and sat-isfied for doing the anova test. Table 4 shows the result of anova test for all properties in all different samples includ-ing river-cities, non-river-cities, and their extractions (five groups). As one can see there are significant effect of rivers on the form of cities as at the p < 0.01 level for the three conditions [F(5, 253) = 7.423, p = 0.000] for mean choice value, [F(5, 253) = 6.937, p = 0.000] for maximum choice value, [F(5, 253) = 6.986, p = 0.000] for mean inte-gration value and [F(5, 253) = 12.174, p = 0.000] for max-imum integration value. Furthermore based on Table 5 which shows robust tests of equality of means, p-value for all properties in different groups of samples are less than significance level of 0.01 and equal to 0.000. This again means that the null hypothesis of having equal means between groups is rejected and therefore the difference between means of groups is significant. This suggests that such differences in different groups are rooted in spatial and structural form of different groups. This is what we intend to scrutinize it in the next step by means of star models.
Star models
In this part, we draw out star models for each individual group in three levels including minimum, maximum, Table 2 Pairwise correlations (R-value) between different properties for the river-cities and the non-river-cities in differ-ent situations
Correlation River River-cut River-high-cut Non-river Non-river-high-cut
Mean and maxchoice −0.324 −0.319 −0.316 −0.303 −0.005 Mean and max integration 0.964 0.788 0.98 0.978 0.984 Mean integration and mean choice −0.132 0.008 −0.095 −0.064 0.213 Max choice and max integration 0.77 0.682 0.863 0.709 0.614 Mean choice and log NC −0.321 −0.328 0.117 −0.402 −0.211 Max choice and log NC 0.429 0.255 −0.034 0.441 0.533 Mean integration and log NC 0.488 0.322 0.039 −0.024 0.071 Max integration and log NC 0.5 0.303 0.009 0.002 0.104
Table 3 Test of homogeneity of variances Levene
statistic df1 df2 Sig.
Page 12 of 21 Abshirini and Koch City Territ Archit (2016) 3:1
and mean which together replicate the general specifica-tions of that group and try to compare the related results. Figure 6 shows the star model emerged from river-cities and Fig. 7 is the same extraction for non-river-cities. As one can see river-cities show a wider star on the horizon-tal range whereas the two models show similar distribu-tion of values on the vertical range.
To reveal differences between these two groups the star models of river-cities and non-river-cities in aver-age, minimum, and maximum level are shown in Fig. 8. Generally speaking, the average is indicating higher val-ues for all measures in river-cities. According to Table 6 the maximum difference (0.243) is between averages of mean integration values for river-cities and non-river
cities while averages of maximum choice are showing the minimum difference (0.042).
Looking at Fig. 8 reveals that the minimum and maxi-mum star models for these two groups show the different trends from the average star model. As seen in Table 6 mean choice values are equal (1.743) for both groups for the maximum star model and unlike the average star model maximum choice value in maximum star model shows a big difference (0.635) although the maximum dif-ference stands for maximum integration value which is equal to 0.712. The situation in minimum star model is more surprising in which unlike the average star model maximum choice values show the maximum difference (0.565) and also unlike the maximum star model maxi-mum integration values show the minimaxi-mum difference (0.179).
Figure 9 show the average, minimum and maximum star models for the river-cut sample in comparison to the other samples including river-cities and non-river-cities. Based on Table 6 a dramatic increase in just about all measures is observed. This situation is more prob-lematic when we see a substantial increase in the maxi-mum choice values (−1.329, 0.382 and 3 respectively for minimum, average and maximum) and integration values (−1.266, 0.184 and 3 respectively for minimum, average and maximum) in comparison to river-cities and non-river-cities.
This is part of the reason, aside ensuring comparability between samples, why we develop our research to inves-tigate the effect of cutting the highest value of choice in river-cities and non-river-cities as well. Star models in different levels are shown in Fig. 10 for both river-high-cut and non-river-high-river-high-cut samples along with all other star models for a better comparison.
At first look it can be seen that star models for both river-high-cut and non-river-cut show a dramatic decrease in almost all values (Table 6). The only excep-tions are higher mean choice value (1.784) and equal maximum choice value (2.059) in maximum star model for river-high-cut in which compared to the same val-ues for river-cities. Another trend is that river-high-cut contains higher values in almost all properties (the only exception is maximum choice value in minimum star models which is −3 for river-high-cut compared to −2.718 for non-river-high-cut).
This arguably means that the spatial configuration of river-cities is more distributed and more differentiated from the non-river-cities and at the same time it is more integrated as we can see in the model (we discuss it more in “Quantitative comparison of reaction to cutting the highest value and bridges” section.).
To go even deeper and test the emerging evidence and interpretations put forward above, we decided to apply Table 4 ANOVA test
Sum of
squares df Mean square F Sig.
Mean-choice
Between groups 0.030 5 0.006 7.423 0.000 Within groups 0.205 253 0.001
Total 0.235 258 Max-choice
Between groups 0.049 5 0.010 6.937 0.000 Within groups 0.355 253 0.001
Total 0.404 258 Mean-integration
Between groups 0.378 5 0.076 6.986 0.000 Within groups 2.737 253 0.011
Total 3.115 258 Max-integration
Between groups 1.893 5 0.379 12.174 0.000 Within groups 7.868 253 0.031
Total 9.761 258
Table 5 Robust tests of equality of means
a Asymptotically F distributed
Statistic a df1 df2 Sig.
Mean-choice
Welch 6.367 5 82.323 0.000 Brown-Forsythe 7.116 5 141.480 0.000 Max-choice
Welch 8.299 5 84.043 0.000 Brown-Forsythe 7.193 5 189.387 0.000 Mean-integration
Welch 5.737 5 82.329 0.000 Brown-Forsythe 6.714 5 140.321 0.000 Max-integration
the same analysis on each river-bank disjointedly and then compare the results to current outcomes. As seen in Table 6 the average values for the separated river-banks are bigger than the values for river-cities as their origins. However according to Table 6 the values meas-ured for the maximum and minimum star models are more dispersed while the minimum star model seems to be smaller than minimum star model for non-river-cities, maximum star model is the biggest among all (the measured values for all the properties are equal to 3) and forms the climax of the models.
The reasonable answer for such pattern seems to be concealed in the physical shape and interaction between other characters of river cities, such as river dimen-sion, size of each riverbank, landuse, and utility of each
river-bank (Silva et al. 2006). As an example in Fig. 11, we show the effect of asymmetrical river-banks on the average star model for the banks of Zlin a river-city in Czech Republic. Here, the river crosses the river-city asymmetrically with a big river-bank in the south part (river-bank1 in Fig. 11), and a small one in the north part (river-bank2 in Fig. 11).
The space syntax properties derived for both sides of the river-city and river-cut are brought for the compar-ison in Fig. 12. As we can see, the values for the south part of the city are the highest among all, showing a well-structured and well-distributed city, which is internally highly integrated. Inversely the north part is showing the lowest values among all suggesting an unstructured and internally segregated part of the city.
-3
Mean NACH
Max NACH
Mean NAIN
Max NAIN -2 -1 0 1 2 3
Page 14 of 21 Abshirini and Koch City Territ Archit (2016) 3:1
In this case, one well-structured river-bank compen-sates not only the effect of a river in the city but also for the unstructured and segregated part of the city located in the other side of the river. On one side of the river, the city depends on its relation to the other side, whereas the other side of the river, the city acts largely independently from the other side—from the point of view of the struc-ture of the street network. This implies the role of the city, itself, on the interaction with its river.
Quantitative comparison of reaction to cutting the highest value and bridges
To further develop on the usability of the star models in comparison between the river- cities and non-river
cities in response to cutting the highest choice values, in Table 7 we calculate the absolute distance between val-ues extracted from different star models of river-cities as original values to all other extraction of river-cities including river-cut, river-banks and river-high-cut. The same comparison is done for non-river-cities and their values are compared to Non-river-high-cut values. According to Table 7, it is seen that non-river-cities show a higher reaction to losing the highest choice value (fore-ground network) in comparison to the river-cities at the same situation as the total change for non-river-cities is equal to 3.158 while it is 1.732 and 1.445 for river-cut and river-high-cut cities respectively. Furthermore the prop-erty with the lowest change within groups and between
-3
Mean NACH
Max NACH
Mean NAIN
Max NAIN -2 -1 0 1 2 3
groups is mean choice value in which its total change is 1.313. However, we need to mention that the impact of cutting bridges is additive but the impact of cutting the highest choice value is completely deductive. River-high-cut with a total change of 1.445 shows the minimum changes among all.
Reflections on the statistical results
Before concluding, it seems in place to make some reflec-tions on the results of these analyses as they have to an extent perplexed us. How come river cities seem more robust in their syntactic structure than non-river cities, when they clearly have a distinct set of connections that are crucial for their function? The results suggest that the
foreground network is not directly dependent on how the geographic barrier in river-cities is crossed. One might speculate that this is because of the role and importance of the foreground network in transportation and move-ment, leading to that a river-city is so configured as to keep and preserve the best efficiency for the foreground network in reaching to and along the river as much as or more than to reach past it. However, the higher value of maximum integration means that generic accessi-bility in river-cities is higher than the non-river-cities as well. In this respect the average star model for the cut sample is asserting that the structure of river-cities is able to compensate the effect of disconnection and disintegration caused by the river running through
-3
Mean NACH
Max NACH
Mean NAIN
Max NAIN -2 -1 0 1 2 3
Page 16 of 21 Abshirini and Koch City Territ Archit (2016) 3:1
it. From perspective of overall configurative properties, the bridges themselves are not structurally important. In relation to our initial hypothesis, this is a surprising result, since the initial hypothesis would suggest that the effect of removing bridges would significantly lower most of the values, since it would mean removing the hypoth-esized main focus of the connectivity of the city.
Cutting bridges from cities reveal that the river-cities are comparatively robust in their structures and less dependent on the crossing bridges. The latter is also supported by the big effect of cutting the highest choice values on the same sample of these cities and the bigger effect on the non-river-cities. Therefore we can assert that non-river-cities are more sensitive to changes in their spatial form.
While the results suggest there is something in the dis-tinctly segregating effect of a river splitting a city into two parts that leads to some sort of compensation in the network as a whole, the reasons why this is and the processes leading to it remain to be established. It also needs to be further investigated what the effective sepa-ration of river banks mean, in relation to and regardless of how the syntactical properties are affected. Here, limi-tations to the approach and the overall methodology to understand the complex socio-spatial relationships of cit-ies become apparent, and the benefits of expanding the analysis to include, for instance, agent-based modeling is, we argue, clear. Such analysis would allow to take better into account the effect on social relationships on indi-vidual and collective basis as structured in and through
the city, and to what extent these are affected depending on a much wider range of factors, and from a more com-plete set of aspects. Arguably this becomes even more of interest as the analysis here show some results that were unexpected and raise questions regarding how to inter-pret and understand them that challenge some com-mon explanations utilized in space syntax research. This would also further clarify the extent to what on syntactic level appears to remain similar or changed affect people’s ranges of possibilities in appropriating and making use of the city in other ways.
Conclusion
As a common element in the development of urban form and function throughout history, with significant effects on the physical structure of cities the aim of pre-sent research is to explore the relationship and influence of river systems on the physical form of cities. Using normalized properties of integration and choice values support us to realize some significant points of the inter-action between rivers and cities as well as significant dis-similarity between river-cities and non-river-cities.
The first finding shows that although bridges are the most important way of connection between the two river-banks in river-cities, they are not as clearly important to manage the limits arisen from rivers in other respects. This was found by comparison between river cities and non-river cities, and how the networks in general, and ‘without’ bridges, are configured on a generic, averaged level. Analysis of the foreground and Table 6 Mean, Maximum and minimum values extracted from the star models of different groups
Value Mean-choice Max-choice Mean-integration Max-integration
Minimum −2.473 −2.106 −1.735 −2.179 River-cities
Mean −0.387 −0.066 0.035 −0.447
Maximum 1.743 2.059 2.120 1.685
Minimum −2.919 −1.541 −2.099 −2.000 Non-river-cities
Mean −0.571 −0.108 −0.208 −0.658
Maximum 1.743 1.424 1.705 0.973
Minimum −3.000 −2.718 −3.000 −3.000 Non-river-cities-high-cut
Mean −1.201 −0.959 −1.024 −1.519
Maximum 1.297 0.388 1.159 0.141
Minimum −2.270 −1.329 −2.079 −1.266 River-cut
Mean 0.131 0.382 0.170 0.184
Maximum 2.432 3.000 2.019 3.000
Minimum −2.878 −1.776 −2.707 −2.848 River-bank
Mean 0.204 −0.011 0.232 −0.299
Maximum 3.000 3.000 3.000 3.000
Minimum −2.635 −3.000 −2.858 −2.989 River-high-cut
Mean −0.552 −0.259 −0.506 −0.993
background network in a star model reveals that the river-cities are well-structured as if to compensate the discontinuity occurred by rivers, to the extent that as a general tendency, they are more integrated and better internally connected than non-river cities on each side of the river.
The second finding illustrates that the foreground net-work as identified through maximum choice values (c.f. Hillier 2009) in cities are more vital to the structure of cities than the bridges. This again emphasizes that the morphological adaption of a city to its river takes place in the structure of the city in general and not in the connec-tion area across the river which includes the bridges. In other words, having the higher choice value in compari-son to non-river-cities and showing more stability and control on the structure after cutting the highest value
of choice shows that river-cities are more flexible in their structure than non-river-cities.
This suggests a kind of double-sided relation between rivers and cities on the overall urban morphological level. On the one hand, it is clear that rivers and bridges form important morphological elements, and they are clearly related to in various ways through history. Be it for trans-port, for views, for gathering places, or for other social, cultural, or functional reasons. On the other hand, it seems that the river cities tend to respond to the sepa-ration generated by a river by becoming more connected and integrated on a general network level. The social, cultural, functional, and other possible reasons for this remain to be investigated and it is premature to make any conclusions aside from these tendencies however tempt-ing it is.
Page 18 of 21 Abshirini and Koch City Territ Archit (2016) 3:1
In this way, integrating space syntax with statistical and geospatial analysis can throw light on the way in which the properties of city networks and urban struc-ture reflect the relative effect of rivers on the morphol-ogy of river cities. In this paper, some of these network properties have been investigated, contributing with a small piece to an understanding that needs to be taken
further by other analytical approaches to contextualize and develop a broader understanding that at this stage remains inferred from a focused and limited study of the specific network aspect analyzed through syntax. The paper, finally, contributes through offering one piece of a better perception of the structure of river-cities that can support strategies, not only to improve river-cities
Fig. 11 A city (Zlin in Czech Republic) asymmetrically crossed by its river; forming a big river-bank in the south part (river-bank1 in figure), and a small one in the north part (river-bank2) in figure
Mean Choice Max Choice Mean Integraon Max Integraon
River 0.899 1.572 0.811 1.361
River-cut 0.91 1.612 0.771 1.613
River-bank1 0.915 1.612 0.93 1.613
River-bank2 0.904 1.469 0.575 0.833
River-high-cut 0.892 1.529 0.681 1.084
0 0.4 0.8 1.2 1.6 2
Page 20 of 21 Abshirini and Koch City Territ Archit (2016) 3:1
interaction but to also enhance our knowledge on the constraints and limits to that interaction.
Authors’ contributions
EA initiated the idea and conceived the study, performed experiments, ana-lyzed data and wrote the paper. DK gave technical support and conceptual advice; helped interpret the result and edited the paper. Both authors read and approved the final manuscript.
Authors’ information
Ehsan Abshirini received the Master degree in remote sensing and GIS from Shahid Chamran University, Ahwaz, Iran in 2005. He is currently pursuing the PhD degree in Geoinformatics at the Royal Institute of Technology (KTH). He presently joined the Spatial Analysis and Design (SAD) research group at KTH School of Architecture that aims at the development of knowledge and theory on architectural space and form. His research interests are mainly in the area of GIS, Space Syntax and integration between them for the analysis of urban morphology. Daniel Koch is a researcher at the KTH School of Archi-tecture, Vice Director for the research environment Architecture in the Making, and on the board for the national research school ResArc. He has contributed to space syntax research through a number of years, focusing largely on space syntax in relation to architecture theory, and is editor of The Journal of Space Syntax. In addition to papers, he has been the author of or contributor to a number of books, several of which focus on the relation between architecture and fashion. He is furthermore co-founder of and still active as a designer at Patch- work Architecture Laboratory operating primarily in Stockholm.
Author details
1 Division of Geoinformatics, Department of Urban Planning and Built Environ-ment, KTH (Royal Institute of Technology), 100 44 Stockholm, Sweden. 2 School of Architecture, KTH (Royal Institute of Technology), 100 44 Stockholm, Sweden.
Competing interests
Both authors declare that they have no competing interests.
Received: 28 October 2015 Accepted: 8 January 2016
References
Asad R, Ahsan R (2012) Structuring urban sustainability with water: a case of kamrangir chor, Dhaka, Bangladesh. J Soc Dev Sci 3(8):293–303 Batty M (2005) Cities and complexity: understanding cities with cellular
automata, agentbased models, and fractals. MIT Press, Cambridge Batty M (2008) Fifty years of urban modelling: macro-statics to
micro-ics. In: Albeverio S, Andrey D, Giordano P, Vancheri A (eds) The dynam-ics of complex urban systems: an interdisciplinary approach. Springer Physica-Verlag, New York, pp 1–20. doi:10.1007/978-3-7908-1937-3_1
Batty M (2013) The new science of cities. Mit Press, Cambridge. doi:10.1111/ gean.12042
Bavelas A (1950) Communication patterns in task-oriented groups. J Acoust Soc Am. doi:10.1121/1.1906679
Čakarić J (2010) Water phenomenon: urban morphology transformation. Facta Univ Ser Archit Civ Eng 8(4):375–388. doi:10.2298/FUACE1004375C
Cengiz B (2013) Urban river landscapes, advances in landscape architecture, book edited by Murat Özyavuz, InTech, pp 978–953
Chang SP, Choo JF (2009) Values of bridge in the formation of cities. In: IABSE Symposium Report, International Association for Bridge and Structural Engineering 95(1):25–46 doi:10.2749/222137809796089142
Crooks AT (2012) The Use of Agent-Based Modelling for Studying the Social and Physical Environment of Cities. In: De Roo G, Hiller J, Van Wezemael J (eds) Complexity and planning: systems, assemblages and simulations. Ashgate, Burlington, pp 385–408
Crooks AT, Patel A, Wise S (2014) Multi-agent Systems for Urban Planning. In: Pinto NN, Tenedório J, Antunes AP, Roca J (eds) Technologies for urban and spatial planning: virtual cities and territories. IGI Global, Hershey, pp 29–56
Dalton N, Peponis J, Dalton R (2003) To tame a TIGER one has to know its nature: extending weighted angular integration analysis to the descrip-tion of GIS road-center line data for large scale urban analysis. Proceed-ings of the 4th International Space Syntax Symposium, London Ellis PA, Mackay R, Rivett MO (2007) Quantifying urban river–aquifer fluid
exchange processes: a multi-scale problem. J Contam Hydrol 91(1):58–80. doi:10.1016/j.jconhyd.2006.08.014
Ferber J (1999) Multi-agent systems: an introduction to distributed artificial intelligence. Addison-Wesley Longman, Harlow
Field A (2007) Analysis of variance (ANOVA), in NJ Salkind (ed.) Encyclopedia of measurement and statistics, SAGE Publications, Inc., Thousand Oaks, CA, pp 33-36. doi:10.4135/9781412952644.n19
Fisher R A (1932) Statistical methods for research workers, Oliver & Boyd, Edinburgh, 4th Edition
Frank AU, Bittner S, and Raubal M (2001) ‘Spatial and cognitive simulation with multi-agent systems’. In spatial information theory—foundations of geographic information science (Int. Conference Cosit 2001, Morro Bay, USA, September 2001). (Montello DR, ed.), Lecture Notes in Computer Science, Vol. 2205, Berlin Heidelberg, Springer-Verlag, pp 124–139. doi:10.1007/3-540-45424-1_9
Freeman LC (1977) A set of measures of centrality based on betweenness. Sociometry 40:35–41. doi:10.2307/3033543
Geofabrik GmbH and openstreetmap contributors (2015). http://download. geofabrik.de. Accessed 22 Feb 2015
Goodchild MF (2007) Citizens as sensors: the world of volunteered geography. GeoJournal 69(4):211–221. doi:10.1007/s10708-007-9111-y
Haklay M, Weber P (2008) Openstreetmap: user-generated street maps. Perva-sive Comput IEEE 7(4):12–18. doi:10.1109/MPRV.2008.80
Hanson J (1998) Decoding homes and houses. Cambridge University Press, Cambridge
Hillier B (1996a) Space is the Machine. Cambridge University Press, Cambridge Hillier B (1996b) Space is the machine, part three: the laws of the field. Space
is the machine: a configurational theory of architecture. Cambridge University Press, Cambridge, pp 273–368
Hillier B (2009) Spatial sustainability in cities: Organic patterns and sustain-able forms. In: Koch D, Marcus L and Steen J (ed) Proceedings of the 7th International Space Syntax Symposium, Royal Institute of Technology, Stockholm, p.K01.1–K01.20
Hillier B, Hanson J (1984) The Social logic of space. Cambridge University Press, Cambridge. doi:10.1017/CBO9780511597237
Hillier B, Iida S (2005) Network and psychological effects in urban movement. In: Cohn AG, Mark DM (eds) Spatial information theory. Springer, Berlin, Heidelberg, pp 475–490. doi:10.1007/11556114_30
Table 7 Absolute distance between values extracted from different star models and their origins (river-cities and non-river-cities)
Distances to origin Mean-choice Max-choice Mean-integration Max-integration SUM
River-cut 0.469 0.447 0.135 0.631 1.682
Non-river-high cut 0.629 0.850 0.816 0.861 3.157
River-high cut 0.214 0.193 0.541 0.546 1.494
Hillier B, Yang T, Turner A (2012) Normalising least angle choice in depthmap-and how it opens up new perspectives on the global depthmap-and local analysis of city space. J Space Syntax 3(2):155–193
Hölzer C, Wiethüchter A, Räume M, Regionale (2010) Riverscapes: designing urban embankments. Birkhauser, Basel
Hossain N, Bahauddin KM (2013) Integrated water resource management for mega city: a case study of Dhaka city, Bangladesh. J Water Land Dev 19(1):39–45. doi:10.2478/jwld-2013-0014
Ioannidis K (2011) Designing the edge: an inquiry into the psychospatial nature of meaning in the architecture of the urban waterfront, Doctoral dissertation. KTH, Stockholm
Jawarneh RN, Julian JP, Lookingbill TR (2015) The influence of physiography on historical and future land development changes: a case study of central Arkansas (USA), 1857–2030. Landsc Urban Plan 143:76–89. doi:10.1016/j. landurbplan.2015.06.010
Karimi K (1997) The spatial logic of organic cities in Iran and the United King-dom. Proc. Space Syntax 1st Intl. Sym. Vol 1. Comparative Cities, London, pp 1–17
Koch D (2013) The architectural interface inside-out. In: Kim YO, Park HT, Seo KW (eds) Proceedings to ninth international space syntax symposium. Sejong University Press, Seoul, pp 067:1–067:16
Kubat AS (1999) The morphological history of Istanbul. Urban Morphol 3(1):28–41
Kubat A S, Kaya H S, Sarı F, Güler G, Özer Ö (2007) The effects of proposed bridges on urban macroform of Istanbul: a syntactic evaluation. In Pro-ceedings of 6th international space syntax symposium Istanbul, Turkey Leopold LB, Wolman MG, Miller JP (1964) Fluvial processes in geomorphology.
W.H. Freeman and Co, San Francisco
Lynch K (1960) The Image of the city. MIT Press, Cambridge
Major M D (1997) Are American cities different? Proc. Space Syntax 1st Intl. Sym. Vol 3, London, pp 1–14
Markus Thomas A (1993) Buildings, power: freedom and control in the origin of modern building types. Routledge, London
Mello S, Holanda F (2009) There is a City on the Riverside. In: Koch D, Marcus L and Steen J (ed) Proceedings of the 7th International Space Syntax Sym-posium. Royal Institute of Technology, Stockholm, Sweden,) 075(1-12
Montello D (2001) Spatial cognition. In: Smelser NJ, Baltes PB (ed). International encyclopedia of the social and behaviorial sciences. Pergamon Press, Oxford, 14771–14775. doi:10.1016/b0-08-043076-7/02492-x
Penn A, Hillier B, Banister D, Xu J (1998) Configurational modelling of urban movement networks. Environ Plan 25(1):59–84. doi:10.1068/b250059
Peponis J (2012) Building layout as cognitive data: purview and perview interface. Cogn Crit 6:11–37
Peponis J, Hadjinikolaov E, Livieratos C, Fatouros DA (1989) The spatial core of urban. Ekistics 56:43–55
Portugali J (2011) Complexity, cognition and the city. Springer Science & Busi-ness Media
Psarra S (2012) A Shapeless hospital, a floating theatre and an island with a hill: the invisible architecture of Venice. In: Greene M, Reyes J, Castro A (ed) Proceedings to the Eighth International Space Syntax Symposium, Santiago, 2012
Ratti C (2004) Urban texture and space syntax: some inconsistencies. Environ Plan 31(4):487–499. doi:10.1068/b3019
Shpuza E (2006) Floorplate shapes and office layouts: a model of the effect of floorplate shape on circulation integration, Doctoral dissertation. Georgia Institute of Technology, Atlanta
Shpuza E (2011) A coupled configurational description of boundary shape based on distance and directionality artificial intelligence for engineering design. Anal Manufact 25:357–374. doi:10.1017/S0890060411000217
Shpuza E (2013) Foreground networks during urban evolution: the effect of length and connectivity on street network integration. In: Kim YO, Park HT, Seo KW (eds) Proceedings of the 9th International Space Syntax Symposium. Sejong University, Seoul
Shpuza E (2014) Allometry in the syntax of street networks: evolution of Adriatic and Ionian coastal cities 1800–2010. Environ Plan 41(3):450–471. doi:10.1068/b39109
Silva JB, Serdoura F, Pinto P (2006) Urban rivers as factors of urban (dis) integra-tion. In 42nd IsoCaRP Congress, Istanbul, Turkey