R E S E A R C H
Open Access
Landslide hazard map: tool for optimization
of low-cost mitigation
Bhim Kumar Dahal
1*and Ranjan Kumar Dahal
2Abstract
Background:Landslide hazard mapping is a fundamental tool for disaster management activities in fragile mountainous terrains. The main purpose of this study is to carry out landslide hazard assessment by weights-of-evidence modelling and prepare optimized mitigation map in the Higher Himalaya of Nepal. The modelling was performed within a geographical information system (GIS), to derive a landslide hazard map of the North-West marginal hills of the Achham. Thematic maps representing various factors that are related to landslide activity were generated using field data and GIS techniques. Landslide events of the old landslides were used to assess the Bayesian probability of landslides in each cell unit with respect to the causative factors.
Results:The analysis suggests that geomorphological and human-related factors play significant roles in
determining the probability value. The hazard map prepared with five hazard classes viz. Very high, High, Moderate, Low and Very Low was used to determine the location of prime causative factors responsible for instability. Spatial distribution of causative factor was correlated with the mechanism and scale of failure. For the mitigation of such shallow-seated failure, bioengineering techniques (i.e. grass plantation, shrubs plantation, tree plantation along with small scale civil engineering structures) are taken as cost-effective and sustainable measures for the least developed country like Nepal. Based on prime causitive factors and required bioengineering techniques for stabilization of unstable road side slopes, mitigation map is prepared having 14 classes of mitigation measures.
Conclusion:The mitigation map reveled only 6.8% road side slopes require retaining structures however that more than half of the instable slope can be treated with simple vegetative techniques. Therefore, high hazard doensnot demand expensive structures to mitigate it in each every case.
Keywords:Bioengineering, GIS, Hazard, Landslide, Mitigation, Rainfall, Weight-of-evidence modeling
Background
In mountains of Himalayas, landslides are frequent phenomenon as the mountain building process and in interference with human activity they become a prob-lem. Mountain slope failure is mainly provoked by combine effect of intrinsic and extrinsic parameters. The extrinsic events like rainfall and earthquake trig-ger slope. Similarly, intrinsic parameters like bedrock geology, geomorphology, soil depth, soil type, slope gradient, slope aspect, slope curvature, land use, eleva-tion, engineering properties of the slope material, land use pattern, drainage pattern and so on have vital roles in the landslide occurrence.
Varnes (1984) defined landslide hazard as the prob-ability of occurrence of a landslide within a specified period and within a given area. The landslide hazard zonation is the process of classification of land with equal landslide hazard value (Varnes 1984) and it pro-vides information on the susceptibility of the terrain to slope failures. This classified hazard map can be used to prepare mitigation plan for the associated hazard. Mitigation plan according to the hazard level is very useful to optimize linear civil engineering structure like road, which are long and passes through numerous physical conditions (i.e. optimization in construction, operation and maintenance). To reduce the Mitigation technique for shallow seated instability, bioengineering techniques are taken as sustainable and cost effective measures (Deoja et al. 1991; Howell, 1999; Shrestha 2009; Rai 2010).
* Correspondence:[email protected]
1School of Civil Engineering and Mechanics, Huazhong University of Science and Technology, 1037 Luoyu Road, Hongshan District, Wuhan, China Full list of author information is available at the end of the article
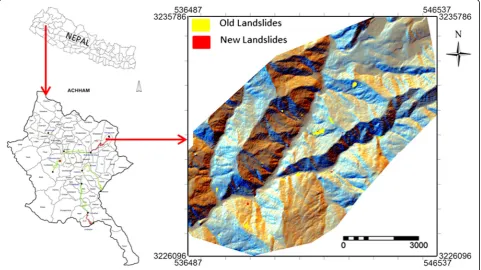
Study area
The study area is located in the northern hills of the Achham, Nepal. The study area is within the Higher Himalaya and belongs to the Kalikot and Slyanigad forma-tion. Kalikot formation has Budhi Ganga gneiss group consisting augen gneisses, granetic gneiss and feldspathic schist and Ghattegad carbonates group consist bluish crystalline limestone, calcareous schist and quartz biotite schists. Similarly Salynigad formation consist aplite granite, gneisses augen, gneisses and biotite gneisses. The study area ranges from 980 to 2924 m from mean sea level.
The total watershed is taken as study area for purpose of hazard mapping which is about of 65.46 km2whereas only strip of 100 m either side of road is taken for preparation of mitigation map. The mean annual precipitation ranges from 1486 to 1739 mm. Most slopes face west, and the slope gradient generally increases with increase in eleva-tion. Colluvium is the main slope material above the bedrock. The area is mainly covered with cultivated land. In 2009, the study area experienced extreme events of monsoon rainfall and faced 84 landslides. There were 91 old landslides traced from field survey and Arial Photo-graph taken at different dates by Department of Survey. Inventory for both old and new landslides are plotted in GIS (Fig. 1). Because of a number of lakes in the study area, currently different governmental and non-governmental agencies have shown interest on the infrastructure devel-opment of the area. Therefore, hazard analysis of the area is necessary for the sustainability of such infrastructure.
Landslide hazard
Hazard is a source of risk that may cause damage to, or loss of, life and property. Hazard can also be defined as the probability of occurrence of a particularly damaging phenomenon, within a specified period of time and within a given area, because of a set of existing or pre-dicted conditions in the given time and space. The damaging phenomenon becomes a matter of concern only when it entails a certain degree of damage or loss to the population or the resources within its influence. In the context of Nepal’s mountain the major hazard is rainfall-induced landslide (Dahal et al. 2008).
To determine landslide hazard of any study area in-trinsic (bedrock geology, geomorphology, soil depth, soil type, slope gradient, slope aspect, slope convexity and concavity, elevation, slope forming material, land use pattern, drainage pattern, sediment transport and wetness index) and extrinsic (rainfall, earthquakes, and volcanoes) variables are used (Siddle et al. 1991; Wu and Sidle 1995; Atkinson and Massari 1998; Dai et al. 2001; Çevik and Topal 2003; Paudyal and Dhital 2005; Dahal et al. 2008). Since the extrinsic factor is difficult to estimate instead of landslide hazard, the landslide susceptibility mapping is done considering only intrinsic variables (Dai et al. 2001). A landslide hazard zonation consists of two different aspects (Van Westen et al. 2003): a) The assessment of the susceptibility of the terrain for a slope failure and b) The determination of the probabil-ity that a triggering event occurs.
A region with terrain condition similar to the region where landslide has occurred is considered to be suscep-tible to landslides (Van Westen and Terlien 1996). Geo-graphic Information Systems (GIS) with capability of handling and integrating multiple intrinsic variables in rela-tion to the spatial distriburela-tion of landslides has gained the success in landslide hazard mapping (Dahal et al. 2008).
Methods
Hazard map
Weights-of-evidence modelling used to prepare landside hazard map (Dahal et al. 2008) is based on Bayesian probability model. This model was first developed and used for mineral potential assessment (Bonham-Carter 2002). This method aided with GIS was very popular in the field of mineral potential mapping (Emmanuel et al. 2000; Tangestani and Moore 2001). Zahiri et al. (2006) used weights-of-evidence modelling for mapping of cliff instabilities associated with mine subsidence. This method has also been applied to landslide susceptibility mapping (Lee et al. 2002; Van Westen et al. 2003, Lee and Choi 2004, Lee et al. 2007; Neuhäuser and Terhorst 2007; Sharma and Kumar 2008). Dahal et al. 2008 used this method for landslide hazard mapping. The method calculates the weight for each landslide causative factor based on the presence or absence of the landslides within the area. The related mathematical relationships are described below.
Wþi (Bonham-Carter 2002) and can be expressed as below:
Wþi ¼ logeP Ff jLg
P F jL ð1Þ
Similarly, negative weights of evidence,W−i, as follows:
W−i ¼ logeP FjL
P F jL ð2Þ
Where, L is the presence of a landslide, F is presence of a causative factor, F is the absence of causative factor and L is absence of landslide.
A positive weight (Wþi ) indicates that the causative factor is present at the landslide location, and the mag-nitude of this weight is an indication of the positive correlation between presence of the causative factor and landslides. A negative weight (W−i ) indicates an absence of the causative factor and shows the level of negative correlation.
Data preparation
The main step for landslide hazard mapping is data col-lection and preparation of a spatial database from which relevant factors can be extracted. The main feature of
this method is comparing the possibility of landslide occurrence with observed landslides.
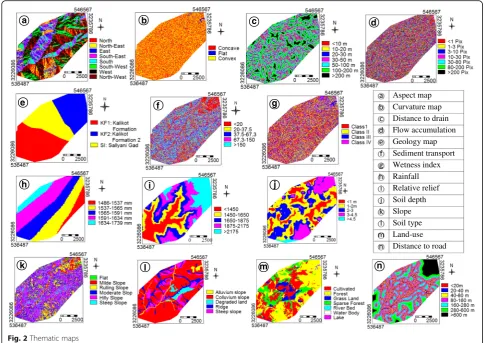
Based on field survey various causative factors were identified, including slope, slope aspect, geology, flow accumulation, relief, landuse, soil type, soil depth, distance to road, curvature, wetness index, sediment transport index and mean annual rainfall (Fig. 2). These thematic map were prepared by using topographic maps and aerial photographs taken by the Department of Survey, Govern-ment of Nepal. Field surveys were carried out to prepare landslide inventory, soil type, soil depth and landuse maps. During survey landslides were plotted to the topographic map of 1:50,000. Positions of landslide in map was deter-mined by GPS. Meanwhile soil type and landuse were also delineated in same topographic map. Whereas depth of soil is estimated by the help of open-cut, terraces and landslides. A landslide distribution map before and after the extreme monsoon rainfall events in 2009 were pre-pared after field survey (Fig. 2). These thematic data layer were prepared using the GIS software ILWIS 3.3.
In this study the thirteen intrinsic variables and one extrinsic variable was used for hazard analysis. All factor maps with cell size of 10 m × 10 m were stored in raster format. Each factor map was crossed with landslide in-ventory map and weight map was prepared with the help of series of commands written in script. Mathematical expression used to calculate positive and negative weight are as follows:
Wþi ¼loge
N1
N1þN2
N3
N3þN4
( )
ð3Þ
W−i ¼Loge
N2
N1þN2
N4
N3þN4
( )
ð4Þ
Where N1, N2, N3and N4are No of cell units
repre-senting the presence of landslides and potential landslide predictive factor, presence of landslides and absent of potential landslide predictive factor, absence of landsides and presence of potential landslide predictive factor and absence of both landslides and potential landslide pre-dictive factor respectively.
Landslide Hazard Index (LHI) map was prepared by numerically adding the resultant weighted factor map obtained by assigning weights of the classes of each thematic layer:
LHI¼WfSlopeþWfAspectþWfDisdrnþWfCurv
þWfDisrdþWfFAþWfGeoþWfSoilt
þWfLanduþWfRelief þWfSoildþWfST I
þWfWetIþWfRain:
Three attribute maps of new, old and all landslides were prepared from LHI values (Fig. 3), which were in the range from −23.1 to 12.77. The ability of LHI to predict landslide occurrences was verified using the success rate curve (Chung and Fabbri 2003), prediction rate, and effect analysis (Van Westen et al. 2003; Lee and Choi 2004; Dahal et al. 2006). The success rate in-dicates what percentage of all landslides occurs in the classes with the highest value of susceptibility. When old landslides are used for LHI calculation and new landslides are used for prediction, the calculated accur-acy rate is called prediction rate (Van Westen et al. 2003; Lee et al. 2007) and is the most suitable parameter for independent validation of LHI.
The success rate curves of all three maps are shown in Fig. 4. These curves are the measures of goodness of fit. In the case of new landslides, the success rate reveals that 10% of the study area where LHI had a higher rank could explain 68.66% of total new landslides. Likewise, 30% of higher LHI value could explain 95.07% of all landslides. Similarly, for the cases of old landslides and all landslides, 30% high LHI value could explain about
87.56 and 92.61% of total landslides respectively. Fig. 4 provides percentage coverage of landslides in various higher rank percentage of LHI.
The prediction rate when LHI map of old landslides crossed with new landslides is similar to the success rates as above. It is independent, and when all maps were combined for the LHI calculation, it gave 78.24% prediction accuracy for the new landslides (Fig. 5). More than 72% of the new landslides were well covered by 30% of the high value of LHI calculated from the old landslides.
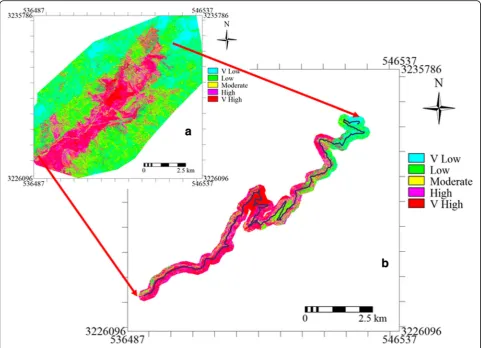
For providing classified hazard maps, reference to prediction rate curves (see Fig. 5) was made and five landslide hazard classes were defined: very low (<25% class of low to high LHI value), low (25–60% class of low to high LHI value), moderate (60–75% class of low to high LHI value), high (75–90% class of low to high LHI value), and very high (>90% class of low to high LHI value, i.e., most higher LHI values) were estab-lished. Hazard map of overall watershed was prepared first and area within road corridor was clipped for miti-gation optimization (Fig. 6).
Results and discussion
From the classified hazard map of the road corridor (Fig. 6), each pixel of high hazard and very high hazard class has been crossed with all intrinsic factors weight map and top three were sorted out. From the study, it was found that among 13 factor maps, landuse has the highest contribution to the LHI value and then distance
to drain, soil depth, soil type, aspect and slope in de-scending order (Table 1).
Jovani (2015) carried out study on national scale land-slide hazard assessment along the road corridors of two Caribbean islands, the study only gave the cost of landslide clearance and repair of damage rather than mitigation. It is clear that damaged caused by rainfall induced disaster in 2010 to the highways is 5% of GDP of the Saint Lucia.
Fig. 4Success rate curves of landslide hazard values calculated from three types of landslide inventory maps
Fig. 5Prediction rate curves of landslide hazard values calculated from the inventory map of the old landslides
Anbalagan et al. (2008) prepared a meso-scale land-slide hazard zonation mapping and suggested that planner should avoid the high hazard area or take precautionary measures during implementation. These researches are basically either for planning or for re-pair and maintenance. Still there is very few literature about the use of hazard map for mitigation aspect. Siddan and Veerappan (2014) prepared hazard zon-ation map for a highway section. They have proposed some general mitigation measures like concrete
ditches, slope flattening, benching, anchoring etc. which are either expensive or not suitable for the area having high relative relief like Himalayas.
This paper is focused on low cost mitigation measures for rural infrastructures. Bioengineering techniques, use of living plants in conjunction with small scale civil engineer-ing structures, are taken as the low cost mitigation tech-niques. These techniques are taken as cost-effective and sustainable measures for the least developed country like Nepal and are very useful for mitigation of shallow-seated Fig. 6Landslide hazard zonation map:aOverall watershed andbTimilsen-Ramaroshan Road corridor
Table 1Effect analysis of the factor map
Factor map/Class % presence in top three w+
Land use; Barren land 24
Distance to drain; 20–50 m, 50–100 m and >200 m 19
Soil depth; Shallow 19
Soil type; Colluvium 17
Aspect; S-W 9
Slope; Steep 8
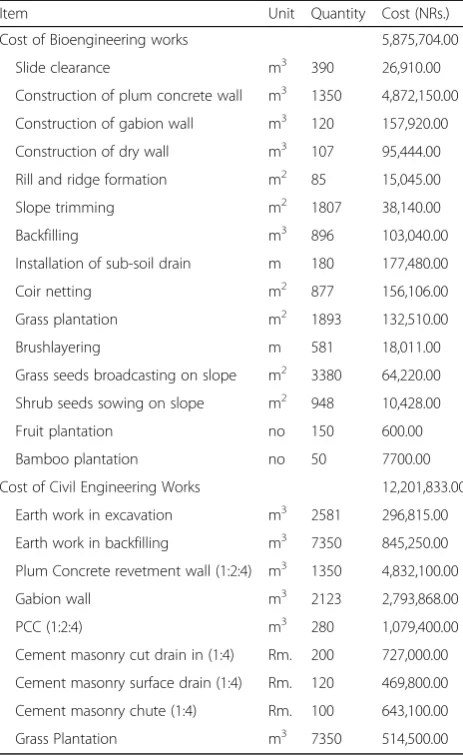
failure. Rai (2010), conducted comparative study and concluded that cost of conventional civil engineering techniques is double to the cost of bioengineering tech-niques for stabilizing same landslide site (Table 2). Besides low construction and maintenance cost it has many socio-economic and environmental benefits.
Bioengineering techniques (i.e. grass plantation, shrubs plantation, tree plantation along with small scale civil engineering structures) for mitigation of shallow seated instability problem depends on the characteristics of ure (Howell 1999; Deoja et al. 1991). Mechanism of fail-ure is depend on presence of different intrinsic factor and its classes. Considering the fact that every class has some distinct characteristics and mechanism of failure, therefore mitigation measure is proposed to overcome the effect of each class on slope stability (Table 3).
Mitigation map
Classified hazard map was statistically analysed to find out the most predominating factors causing landslide. The analysis of each cell unit of hazard map shows that there are altogether twelve classes or combination of dif-ferent classes responsible for instability. These classes in-clude eight predominating classes of different factor maps whereas, three are combination of two classes and a combination of three classes.
The mitigation measures proposed based on different predominating class is overlapped in each and every cell units. As the result, the concise mitigation representa-tion of study area is presented in matrix form (Table 4).
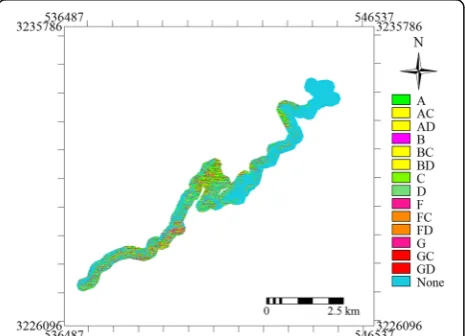
Mitigation map of the study area was prepared after conducting analysis in ILWIS and EXCEL. Low cost miti-gation raster map of Timilsen-Ramaroshan District Road was prepared (Fig. 7) by clipping mitigation map of study area and road corridor map. Mitigation map depicts that overall mitigation structure can be classified in fourteen classes derived from seven basic structure types.
Table 3Mitigation measures per class and combination
Class Problems Mitigation Code
S-W aspect Erosion Vegetation A
Barren land Erosion Vegetation A
Loose colluvium Erosion Retaining wall, vegetation B
Shallow soil depth Slips Vegetation A
Steep slope Slips Retaining wall, benching G
Distance to Drain 20–50 m Scour, Drainage Toe protection, surface and sub-surface drain C
Distance to Drain 50–100 m Drainage Surface and sub-surface drain D
Distance to Drain >200 m Drainage Surface drain E
Combination of 3,4 Erosion Retaining wall, vegetation B
Combination of 3,5 Erosion, flow Retaining wall, benching and vegetation F
Combination of 4,5 Slips Retaining wall, benching G
Combination of 3,4,5 Erosion, flow Retaining wall, benching and vegetation F
Table 2Cost comparison of conventional and bioengineering
mitigation works (Rai 2010)
Item Unit Quantity Cost (NRs.)
Cost of Bioengineering works 5,875,704.00
Slide clearance m3 390 26,910.00
Construction of plum concrete wall m3 1350 4,872,150.00
Construction of gabion wall m3 120 157,920.00
Construction of dry wall m3 107 95,444.00
Rill and ridge formation m2 85 15,045.00
Slope trimming m2 1807 38,140.00
Backfilling m3 896 103,040.00
Installation of sub-soil drain m 180 177,480.00
Coir netting m2 877 156,106.00
Grass plantation m2 1893 132,510.00
Brushlayering m 581 18,011.00
Grass seeds broadcasting on slope m2 3380 64,220.00
Shrub seeds sowing on slope m2 948 10,428.00
Fruit plantation no 150 600.00
Bamboo plantation no 50 7700.00
Cost of Civil Engineering Works 12,201,833.00
Earth work in excavation m3 2581 296,815.00
Earth work in backfilling m3 7350 845,250.00
Plum Concrete revetment wall (1:2:4) m3 1350 4,832,100.00
Gabion wall m3 2123 2,793,868.00
PCC (1:2:4) m3 280 1,079,400.00
Cement masonry cut drain in (1:4) Rm. 200 727,000.00
Cement masonry surface drain (1:4) Rm. 120 469,800.00
Cement masonry chute (1:4) Rm. 100 643,100.00
Grass Plantation m3 7350 514,500.00
The mitigation map of the road corridor clearly depict that 60% of road side slope is naturally stable and doesn’t required mitigation works. The remaining 40% slope is required different mitigation measures (Fig. 8). The area required vegetation for stabilization is found to be 20.4%, similarly 6.8% of the road side slope required retaining wall and 16% of road side slope required drai-ninge facility. Since the terrain is steep with high relative relief and the slope will be steeper after construction, slope flattening and benching necessary for 16% of un-stable roadside slope.
Conclusions
Landslide hazard mapping is essential in delineating landslide prone areas and optimizing low cost mitiga-tion measures in mountainous regions. Amongst vari-ous techniques, this study applied weights-of-evidence modelling for landslide hazard analysis, to the northern mountain in the Higher Himalaya of Achham, Nepal. There are very few literatures available for mitigation mapping by using hazard zonation. Some authors has general recommendation of mitigation measures for the
high hazard zone but not site specific. In this context, this study will fill the existing gap for the use of hazard zonation for site specific mitigation mapping. From the prepared mitigation map, the conclusions are drawn as follows:
The first and the most important conclusion of this research is, mitigation measure for slope stability is more realistic and sustainable only after considering landslide hazard index as well as the causative factors. The mitigation map of the study area revealed that only 6.8% road side slopes required retaining structures. Therefore, high hazard always doesn’t demand expensive structures to stabilize it. More often, they are stabilized by very simple measure as per its mechanism and causing factor of instability.
More than half of (20.4% out of 40% area) the instable area can be stabilized with simple bioengineering techniques like grass and shrubs plantation and remaining half will be stabilized in conjunction with small scale civil engineering structures. Therefore, the mitigation approach is much more cost effective in terms of construction cost (Rai2010) in addition to the social and environmental benefits. These techniques are functionally sound on stabilizing the shallow seated landslides which is the major problem in Himalayan region during construction and operation of roads.
The concept of mitigation matrix prepared in this research is new concept and is very useful to deal with classified mitigation hazard map for Nepalese mountain slopes.
The optimized mitigation measures might reduce the blockade time of road and improve life standard of the people living in remote villages of Achham and Kalikot districts.
Table 4Mitigation matrix
Class S-W Barren Distance to Drain
20–50 50–100 >200 m
None A A C D E
Loose colluvium B B BC BD BE
Shallow soil depth A A AC AD AE
Steep slope GA GA GC GD GE
Combination of 3, 4 B B BC BD BE
Combination of 3, 5 F F FC FD FE
Combination of 4, 5 GA GA GC GD GE
Combination of 3, 4, 5 F F FC FD FE
Fig. 7Mitigation measures for Timilsen-Ramaroshan Road
Abbreviations
GDP:Gross Domestic Product; GIS: Geological Information System; LHI: Landslide Hazard Index
Acknowledgement
Authors would like to acknowledge local people of the study area for providing assistance, help and co-operation during field data collection. We would like to thanks Mr. Chitra Thapa and Mr. Diwakar K C for their valuable help and advice during this research.
Authors’contributions
BKD carried out data collection, conducted analysis and drafted manuscript. RKD has prepared research design, monitored outcome and reviewed manuscript. Both authors read and approved the final manuscript.
Competing interests
The authors declare that they have no competing interests.
Author details
1School of Civil Engineering and Mechanics, Huazhong University of Science and Technology, 1037 Luoyu Road, Hongshan District, Wuhan, China. 2Geodisaster Research Center, Central Department of Geology, Tribhuvan University, Kritipur, Kathmandu, Nepal.
Received: 17 September 2016 Accepted: 28 January 2017
References
Anbalagan, R., D. Chakraborty, and A. Kohli. 2008. Landslide hazard zonation mapping on meso-scale for systematic town planning in mountainous terrain.Journal of Scientific & Industrial Research67: 486–497. Atkinson, P.M., and R. Massari. 1998. Generalized linear modelling of landslide
susceptibility in the Central Apennines, Italy.Computers & Geosciences 24: 373–385.
Bonham-Carter, G.F. 2002. Geographic information systems for geoscientist: Modelling with GIS. InComputer Methods in the Geosciences 13 Pergamon, ed. D.F. Merriam, 302–334. New York: Elsevier.
Çevik, E., and T. Topal. 2003. GIS-based landslide susceptibility mapping for a problematic segment of the natural gas pipeline, Hendek (Turkey). Environmental Geology44: 949–962.
Chung, C.-J.F., and A.G. Fabbri. 2003. Validation of spatial prediction models for landslide hazard mapping.Natural Hazards30: 451–472.
Dahal, R. K., Hasegawa, S., Yamanaka, M., and K. Nishino. 2006. Rainfall triggered flow-like landslides: understanding from southern hills of Kathmandu, Nepal and northern Shikoku, Japan.Proc 10th Int Congr of IAEG, The Geological Society of London, IAEG2006, Paper number(819): 1–14.
Dahal, R.K., S. Hasegawa, A. Nonomura, M. Yamanaka, S. Dhakal, and P. Paudyal. 2008. Predictive modeling of rainfall-induced landslide hazard in the Lesser Himalaya of Nepal based on weights-of-evidence.Geomorphology 102: 496–510. http://iaeg2006.geolsoc.org.uk/cd/PAPERS/IAEG_819.PDF. Dai, F.C., C.F. Lee, J. Li, and Z.W. Xu. 2001. Assessment of landslide susceptibility on the natural terrain of Lantau Island, Hong Kong.Environmental Geology 40: 381–391.
Deoja, B., M. Dhital, B. Thapa, and A. Wagner. 1991.Mountain Risk Engineering-Part I, 188–192. Kathmandu: International Center for Integrated Mountain Development. Emmanuel, J., M. Carranza, and Martin Hale. 2000. Geologically constrained
probabilistic mapping of gold potential, Baguio district, Philippines. Natural Resources Research9: 237–253.
Howell, J. 1999.Roadside Bioengineering Reference Manual, 81–102. Department of Roads, Government of Nepal.
Jovani, Y. 2015.National Scale Landslide hazard assessment along the road corridors of Dominica and Saint Lucia. The Netherlands: University of Twente. Master thesis. Lee, S., and J. Choi. 2004. Landslide susceptibility mapping using GIS and
the weights-of-evidence model.International Journal of Geogrgaphical Information Science18: 789–814.
Lee, S., J. Choi, and K. Min. 2002. Landslide susceptibility analysis and verification using the Bayesian probability model.Environmental Geology43: 120–131. Lee, S., J. Ryu, and I. Kim. 2007. Landslide susceptibility analysis and its verification
using likelihood ratio, logistic regression and artificial neural network models: case study of Youngin, Korea.Landslides4: 327–338.
Neuhäuser, B., and G. Terhorst. 2007. Landslide susceptibility assessment using “weights-ofevidence”applied to a study area at the Jurassic escarpment (SW-Germany).Geomorphology86: 12–24.
Paudyal, P., and M.R. Dhital. 2005. Landslide hazard and risk zonation of Thankot– Chalnakhel area, central Nepal.Journal of Nepal Geological Society31: 43–50. Rai, S. 2010.A case study: conventional engineering & bioengineering approach for slope stabilisation on rural roads. Nepal: District Road Support Programme. Sharma, M., and R. Kumar. 2008. GIS-based landslide hazard zonation: a case
study from the Parwanoo area, Lesser and Outer Himalaya, H P, India. Bulletin of Engineering Geology and the Environment67: 129–137. Shrestha, H.R. 2009.Harmonizing Rural Road Development with Mountain Environment:
Green Roads in Nepal. Nepal: TCDPAP&FIDIC/ASPAC International Conference. Siddan, A., and R. Veerappan. 2014. Landslide hazard zonation mapping in Ghat
road section of Kolli Hills, India.Journal of Mountain Science11(5): 1308–1325. Siddle, H.J., D.B. Jones, and H.R. Payne. 1991. Development of a methodology
for landslip potential mapping in the Rhondda Valley. InSlope Stability Engineering Thomas Telford, London, ed. R.J. Chandler, 137–142. Tangestani, M.H., and F. Moore. 2001. Porphyry copper potential mapping using
the weights-of-evidence model in a GIS, northern Shahr-e-Babak, Iran. Australian Journal of Earth Science48: 695–701.
Van Westen, C.J., and T.J. Terlien. 1996. An approach towards deterministic landslide hazard analysis in GIS. A case study from Manizales (Colombia). Earth Surface Process and Landforms21: 853–868.
Van Westen, C.J., N. Rengers, and R. Soeters. 2003. Use of geomorphological information in indirect landslide susceptibility assessment.Natural Hazards 30: 399–419.
Varnes, D.J. 1984. Landslide hazard zonation: a review of principles and practice. InCommission on landslides of the IAEG, UNESCO, Natural Hazards No 3, 61. Wu, W., and R.C. Sidle. 1995. A distributed slope stability model for steep forested
basins.Water Resource Research31: 2097–2110.
Zahiri, H., D.R. Palamara, P. Flentje, G.M. Brassington, and E. Baafi. 2006. A GIS-based weights-of-evidence model for mapping cliff instabilities associated with mine subsidence.Environmental Geology51: 377–386.
Submit your manuscript to a
journal and benefi t from:
7Convenient online submission 7Rigorous peer review
7Immediate publication on acceptance 7Open access: articles freely available online 7High visibility within the fi eld
7Retaining the copyright to your article