O R I G I N A L R E S E A R C H
Open Access
Noise reduction using a Bayesian
penalized-likelihood reconstruction
algorithm on a time-of-flight PET-CT
scanner
Paulo R. R. V. Caribé
1*, M. Koole
2, Yves D
’
Asseler
3, B. Van Den Broeck
3and S. Vandenberghe
1* Correspondence:paulo.caribe@ ugent.be
1Medical Image and Signal Processing–MEDISIP, Ghent University, Corneel Heymanslaan 10, 9000 Gent, Belgium
Full list of author information is available at the end of the article
Abstract
Purpose:Q.Clear is a block sequential regularized expectation maximization (BSREM) penalized-likelihood reconstruction algorithm for PET. It tries to improve image quality by controlling noise amplification during image reconstruction. In this study, the noise properties of this BSREM were compared to the ordered-subset
expectation maximization (OSEM) algorithm for both phantom and patient data acquired on a state-of-the-art PET/CT.
Methods:The NEMA IQ phantom and a whole-body patient study were acquired on a GE DMI 3-rings system in list mode and different datasets with varying noise levels were generated. Phantom data was evaluated using four different contrast ratios. These were reconstructed using BSREM with differentβ-factors of 300–3000 and with a clinical setting used for OSEM including point spread function (PSF) and time-of-flight (TOF) information. Contrast recovery (CR), background noise levels (coefficient of variation, COV), and contrast-to-noise ratio (CNR) were used to determine the performance in the phantom data. Findings based on the phantom data were compared with clinical data. For the patient study, the SUV ratio, metabolic active tumor volumes (MATVs), and the signal-to-noise ratio (SNR) were evaluated using the liver as the background region.
Results:Based on the phantom data for the same count statistics, BSREM resulted in higher CR and CNR and lower COV than OSEM. The CR of OSEM matches to the CR of BSREM withβ= 750 at high count statistics for 8:1. A similar trend was observed for the ratios 6:1 and 4:1. A dependence on sphere size, counting statistics, and contrast ratio was confirmed by the CNR of the ratio 2:1. BSREM withβ= 750 for 2.5 and 1.0 min acquisition has comparable COV to the 10 and 5.0 min acquisitions using OSEM. This resulted in a noise reduction by a factor of 2–4 when using BSREM instead of OSEM. For the patient data, a similar trend was observed, and SNR was reduced by at least a factor of 2 while preserving contrast.
Conclusion:The BSREM reconstruction algorithm allowed a noise reduction without a loss of contrast by a factor of 2–4 compared to OSEM reconstructions for all data evaluated. This reduction can be used to lower the injected dose or shorten the acquisition time.
Keywords:Penalized-likelihood reconstruction, BSREM, Q.Clear, OSEM, PET
Background
The aim of this study was to evaluate differentβ-factors compared to a clinical post-filter kernel for different datasets with varying noise levels to investigate whether and to what extent noise can be reduced by using BSREM instead of OSEM.
Methods PET/CT system
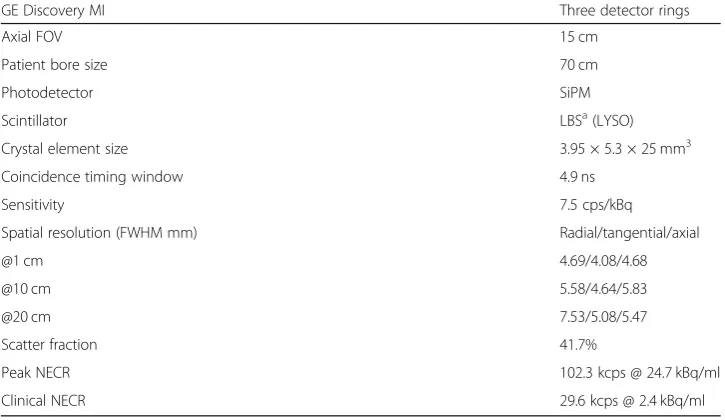
All data were acquired on a digital GE Discovery MI PET/CT (DMI) system, installed in Ghent University Hospital, Belgium. The investigated system consists of three detector rings; each PET ring uses 136 detector blocks containing a 4 × 9 array of lutetium-based scintillator (LBS) crystals coupled to a 3 × 6 array of silicon photomultipliers (SiPMs) with Anger multiplexing for crystal identification [18]. Table1contains a summary of import-ant design and performance parameters [19].
A well-countered cross-calibration scan was performed with18F in a uniform cylindrical phantom before starting the tests as a common quality control and assurance procedure.
Image reconstruction
The phantom and patient data were reconstructed using a matrix size of 256 × 256 with a slice thickness of 2.78 mm and multiple acquisition times for the two algorithms, respectively. BSREM (Q.Clear) reconstruction was done for different penalizationβ-factors 300, 400, 500, 600, 750, 1000, 1500, and 3000. These reconstructions were compared to OSEM reconstruc-tion with three iterareconstruc-tions, 16 subsets and a Gaussian post-filter with FWHM of 5.0 mm, as rec-ommended by the manufacturer to be used in a clinical setting. All reconstructions included attenuation and scatter correction based on CT as well as PSF modeling and TOF information.
Phantom data
The NEMA (National Electricals Manufacturers Associations) IEC image quality phan-tom was used for these experiments. To simulate lesions of different sizes, the phanphan-tom
Table 1Design and performance specifications of the GE Discovery MI commercial system
GE Discovery MI Three detector rings
Axial FOV 15 cm
Patient bore size 70 cm
Photodetector SiPM
Scintillator LBSa(LYSO)
Crystal element size 3.95 × 5.3 × 25 mm3
Coincidence timing window 4.9 ns
Sensitivity 7.5 cps/kBq
Spatial resolution (FWHM mm) Radial/tangential/axial
@1 cm 4.69/4.08/4.68
@10 cm 5.58/4.64/5.83
@20 cm 7.53/5.08/5.47
Scatter fraction 41.7%
Peak NECR 102.3 kcps @ 24.7 kBq/ml
Clinical NECR 29.6 kcps @ 2.4 kBq/ml
a
has six fillable spheres of different diameters (10 mm, 13 mm, 17 mm, 22 mm, 28 mm, and 37 mm). The phantom contains a lung insert, which consists of a cylinder posi-tioned in the center of the phantom with an inner diameter of 44.5 mm and a volume of 194 ml. The lung insert was filled with low-density styrofoam pellets and pure water to simulate human lung tissue. The phantom was prepared according to the NEMA NU 2-2012 protocol [20]. The background volume of the phantom was filled with an activity concentration of 5.3 kBq/ml (52 MBq of 18F for 9800 ml). The sphere-to-background ratios were chosen to be 8:1, 6:1, 4:1, and 2:1 for the six spheres.
The phantom data experiments were obtained during a single bed position scan of 20 min in the full FOV of the TOF PET/CT. The central slice contained the six spheres and the adjacent slices were also used for the background ROIs. Sixty background ROIs of each slice thickness (12 ROIs on each of five slices) were drawn on the slices as close as possible to ± 1 cm and ± 2 cm on either side of the central slice. The CRs were de-termined for each hot spherejby
CRsH;j¼
CH;j=CB;j
−1
aH=aB
ð Þ−1 ; ð Þ1
whereCH, jis the average number of counts in the ROI in the transverse image slice
that contains the center of the sphere j.CB, jrepresents the average number of counts
in the background ROI for sphere j. The terms aH and aB are the actual activity
con-centrations in the hot spheres and background respectively. The background COV was calculated as
BackgroundCOVj ¼
SDj CB;j
2
ð Þ
where SDjis the standard deviation andCB, jis the average of all counts for of the 60
background ROI counts for spherej[20]. Contrast-to-noise ratio was defined as CR di-vided by the background variability (calculated as described in [20]). The SUV values were obtained using a VOI drawn on the OSEM reconstruction of 20 min acquisition and then propagated to the BSREM reconstructions.
The CR data, CNR, and background COV of the phantom data were obtained in a single bed position with full 20 min acquisition. Datasets of 10, 5.0, 2.5, and 1.0 min, representing shorter scans with lower count statistics, were obtained using list-mode selections. Reconstructions of the phantom data were analyzed using the NEMA NU 2–2012 protocol and compared based on different reconstruction parameters.
Clinical data
radioactivity tracer, a blood sample was taken to ensure the blood glucose levels (97 mg/dl). FDG-PET/CT imaging started 60 min after the intravenous injection of FDG. The total acquisition time (nine time lengths per bed-position) was 10 min (1.07 min/ bp). From this dataset, scans of 5.0 min (0.34 min/bp) and 2.5 min (0.17 min/bp) were generated in list mode. The TOF-PSF-OSEM image with post-smoothing with a 5.0-mm filter was chosen as reference lesion volumes (VOIs). The VOIs were delineated using the 41% threshold of the maximum voxel value and then propagated to the BSREM reconstructions. The same reconstruction parameter settings were used as for the phantom data. The noise level was calculated as standard deviation (SD) divided by the SUVmeanof a large spherical reference volume ( , 3.0 cm) placed in the liver
(nor-mal uptake). The lesion SNR was computed as the difference between the SUVmeanof
the lesion VOI and the background SUV of the reference VOI placed in the liver, di-vided by the SD of the value in the reference VOI. Contrast was calculated as lesion SUVmeandivided by SUVmeanof the liver reference VOI. The signal to noise was
evalu-ated for the different lesions by comparing it to the noise level in the liver. The MATVs was evaluated as the lesion SUVmeanmultiplied by the volume of the lesion.
Results Phantom data Contrast recovery
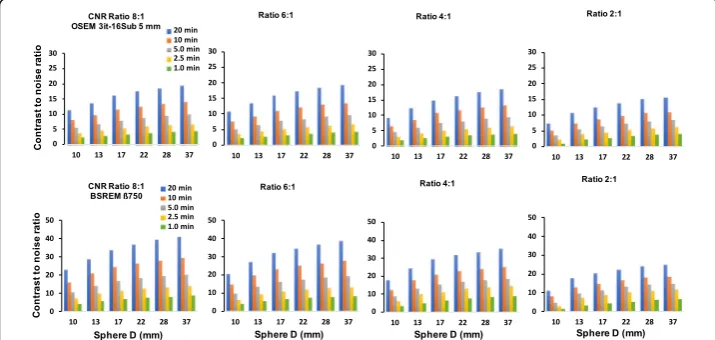
The results for CR versus background COV of the image quality phantom for each sphere size and contrast ratio of 8:1 are shown in Fig.1. All plots show a similar trend: the con-trast increases when reducing theβ-factor and the COV decreases asβincreases in value.
Noise properties
For reduced count statistics of the contrast 8:1 (reducing the acquisition time from 20 to 10, 5.0, 2.5, and 1.0 min), BSREM has in general lower COV than OSEM. Moreover, OSEM was more sensitive to noise compared to BSREM with large differences in COV between the different noise levels for the OSEM setting. When reducing the number of counts by a factor of 2, the COV can be controlled by increasing the β-parameter in the lower count dataset (losing contrast recovery). Similarly, the post-filter can be in-creased in OSEM. By comparing the reconstruction algorithms for different count levels, the following observations are made: The curves of BSREM at 50% of counts are always outperforming the curves of OSEM at the full 100% of counts. For the four lar-gest spheres, the BSREM curves for 25% of the counts are also outperforming OSEM at 100% of counts. For any length of the study, the highest contrast recovery is observed for the smallest regularization parameter (300). The contrast recovery decreases with increasingβ-parameter. In comparison with OSEM, the contrast is higher forβ= 300– 600 and comparable for β= 750 at 20, 10, and 5.0 min but slightly lower for 2.5 and
Fig. 1Contrast recovery of BSREM (β= 300–3000, including TOF and PSF) and TOF-OSEM (3 iterations, 16 subsets, post-filter 5.0 mm and PSF) as a function of the background coefficient of variation for different acquisition times (20, 10, 5.0, 2.5, and 1.0 min) and contrast ratio of 8:1. Different plots are shown with decreasing sphere diameter
1.0 min acquisitions. Furthermore, taking as a reference the full dataset (20 min) recon-structed with OSEM (post-filter 5.0 mm), it is clear from Fig.1that the contrast (for all sphere sizes) with β= 300–600 is still higher for 20, 10, 5.0, and 2.5 min. For the smal-lest sphere, the optimal beta is aroundβ= 300 and 400.
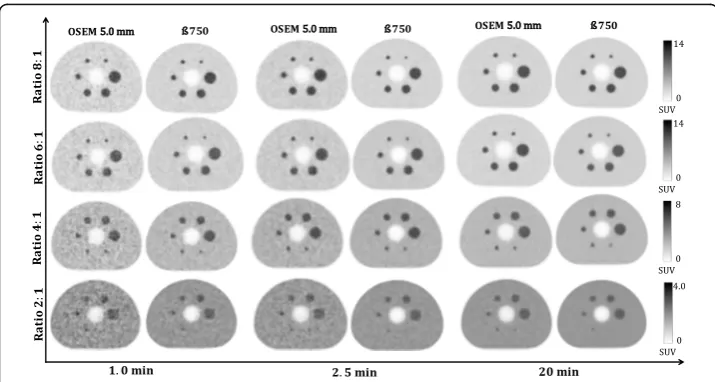
The background COV comparison to OSEM is shown in Table 2. The COV of OSEM (20 min) is worse than the COV of BSREM withβ= 750 for 20, 10 min, and 5 min. The COV of OSEM (10 min) is worse than the COV of BSREM withβ= 750 for 10, 5.0, and 2.5 min. This represents a background COV reduction by a factor of 4. The quantitative noise reduction found in Table 2 is also visually confirmed by the recon-structions in Fig. 5. For all contrast ratios at 1.0, 2.5, and 20 min, BSREM (with β = 750) reconstructions appears to have better background COV compared to OSEM reconstructions. However, β= 750 has excessively smoothed the smallest sphere in the 2:1 ratio. This is also confirmed in Fig. 1, which suggests using a β value around 300
Fig. 3Comparison in terms of contrast recovery as a function of sphere size between (top) TOF-OSEM (3 iterations, 16 subsets, post-filter 5.0 mm and PSF) and (bottom) BSREM withβ= 750 (including TOF and PSF) for different counting statistics and contrast ratios
and 400 for small lesion at high count level. Increasing theβ-factor leads to extra con-trast loss and should only be done when the count level is low, and concon-trast can be traded in for reduced background COV.
Clinical data
For the patient data, the contrast of the datasets with three different count levels (10, 5.0, and 2.5 min, representing each counting level a total of nine time ranges per bed position) was evaluated for six different lesion volumes as a function of noise level on the liver. The representative example of this patient data is presented in Fig. 6. The curves follow a similar trend as in the phantom reconstructions (Fig. 1). BSREM out-performed OSEM reconstructions in terms of noise levels with a lower noise level. Also, the largest difference is seen for bigger lesions where reduced noise is combined with higher contrast. The quantitatively measured values of the reference VOIs are shown in Table3.
As shown in Table 4, the noise level measured in the liver with BSREM is clearly lower than for OSEM with post-filter. As excepted from the phantom data analysis, the Table 2Comparison in terms of background COV between TOF-OSEM (3 iterations, 16 subsets, post-filter 5.0 mm and PSF) and BSREM withβ= 750 for a volume of 26.52 ml at different count statistics. All values correspond to a contrast ratio of 8:1
Background COV (26.52 ml)
Time (min) OSEM β750
1.0 0.186 0.095
2.5 0.119 0.059
5.0 0.084 0.041
10 0.059 0.028
20 0.043 0.021
noise in the liver of OSEM reconstruction (10 min) is worse than the noise of BSREM withβ= 750 for 10 min and 5.0 min and is comparable to 2.5 min. Lower noise can be ob-served for BSREM in all other cases (also when lowering the counts with a factor 4). This leads to a noise reduction in the liver by a factor of 4. The SNR of BSREM withβ= 750 and OSEM reconstruction are also shown in Table4for different count levels. A similar trend to phantom data presented in the Fig.4is observed SNR for BSREM withβ= 750 (averaged for all lesion size) increased by a factor of 2 times for the same counting level. The SNR of both reconstructions decreases with reduction of counting statistics.
Figure 7 shows quantitatively the SUV values of the evaluated whole-body 18F-FDG PET images of a patient with multiple lymphoma. In terms of SUVmean and MATVs
values for all lesion sizes, BSREM (with β= 750) reconstructions of 5.0 and 2.5 min are quantitatively similar to the OSEM reconstruction (10 min). Also, a qualitative visual evaluation has the same trends as the phantom reconstructions in Fig.5.
Based on visual and quantitative differences, we found similar trends to the phantom data analysis (Figs. 1, 3, and 4). It is possible to reduce the count level of a clinical whole-body 18F-FDG PET/CT imaging with at least a factor of 2. Another similarity to consider, especially in terms of noise reduction without loss in contrast analyses, is that BSREM reconstruction increased the CNR and SNR by a factor of 2 (for both, phantom and the clinical data) compared to OSEM at same count level.
Fig. 6Contrast (SUV ratios) of BSREM (β= 300–3000, including TOF and PSF) and TOF-OSEM (3 iterations, 16 subsets, post-filter 5.0 mm and PSF) as a function of noise level of a large VOI ( , 3.0 cm) placed in normal liver for different acquisition times (10, 5.0, and 2.5 min). Different plots are shown with decreasing lesion volume
Table 3Reference values measured in a healthy liver for OSEM and BSREM
Measureb OSEMa BSREM
β300 Β400 β500 Β600 β750 β1000 β1500 β3000
Volume (ml) 14.137
SUVmean 2.212 2.187 2.184 2.192 2.193 2.197 2.193 2.204 2.212
SUVSD 0.480 0.441 0.362 0.301 0.272 0.241 0.206 0.152 0.092
a
TOF PSF OSEM (3 iterations and 16 subsets and 5 mm Gaussian filter)
b
Discussion
This study addressed the noise reduction performance of BSREM (Q.clear) compared to OSEM for both phantom and patient data acquired on the new Discovery MI 3-rings silicon photomultiplier-based TOF-PET/CT with sensitivity of 7.5 cps/kBq and axial FOV of 15 cm. Differences of the performance between OSEM and BSREM are expected due to the nature of the selective filtering of both algorithms, which can lead to a direct result on different anatomical information [16]. The aim was to investigate if the extent of noise can be reduced without a loss in image quality by using BSREM in-stead of OSEM.
The latest developments in detector technology and timing resolution of the digital PET/CT results in an increased sensitivity and count rate statistic compared with con-ventional PET/CT [18, 22]. These improvements combined with emerging develop-ments in reconstruction methods lead to changes in the clinical routine which need to be considered and harmonized in order to obtain the most optimal image quality. This Table 4Noise level of a large VOI ( , 3.0 cm) placed in the liver and the SNR with all lesion sizes averaged are presenting for TOF-OSEM (3 iterations, 16 subsets, post-filter 5.0 mm and PSF) and BSREM withβ= 750 (including TOF and PSF). Reference values measured in a healthy liver
Noise (14.137 ml) SNR (lesion size averaged)
Time (min)a OSEM β750 OSEM β750
2.5 0.443 0.228 20.256 41.710
5.0 0.318 0.156 15.088 29.092
10 0.217 0.109 10.243 19.448
a
Total of nine range of times per bed position
Fig. 7Coronal whole-body18F-FDG PET images of patient with multiple lesions of different sizes of B cell
lymphoma. The arrows indicate the SUVmean(red) and MATVs (black) of the lesions. Images were
should be done in a shortest possible acquisition time, which is preferable in terms of patient care [23,24].
BSREM reconstructions were compared to OSEM with PSF and TOF information using three iterations and 16 subsets with a FWHM of 5 mm, which were recommend by the manufacturer and are expected to be used in a general clinical setting. However, in most of the clinical centers, the reconstruction settings are chosen by the physicians based on the visual assessment of several PET scans.
Furthermore, the optimization of BSREM reconstructions has been previously investi-gated, such as Reynés-Llompart et al. [16] using a range of β50–500 parameters on a BGO PET/CT. Other previous studies [14,17, 24] have used a range of β200–800 to examine the BSREM algorithm. In this work, we extended the range to β300–3000 to assess in first, from a clinical point of view, whichβ-parameter has comparable contrast recovery to OSEM on a new DMI. Afterward, we evaluated qualitatively and quantita-tively what is the impact on the noise under the condition of different contrast ratios and count statistics.
Regarding the contrast recovery and background COV forequal count levels, the phan-tom data analysis showed (Figs.1and2) that for the four largest spheres (17, 22, 28, and 37 mm diameters), BSREM results in increased contrast recovery compared to OSEM.β= 750 (Fig.2) has comparable resolution to OSEM reconstruction, but with a reduction of four times background COV (Table2). Althoughβ= 750 has a CR to OSEM, these results pointed out that the optimal penalization factor depends on the contrast ratio, acquisition time, and sphere size. This suggest that a high value ofβcan lead to a negative impact on the detectability of the small lesions. As presented in Fig.1, the phantom results suggest an optimumβvalue between 300 and 400, which maximizes the CR and the CNR of the smallest sphere. This is also in agreement with the previous studies [14,16,23,24].
BSREM outperforms OSEM with regards to the COV for all sphere sizes. The investi-gated clinical data showed a similar trend from the phantom study. For any length of the phantom data, the highest contrast recovery was found for aβ= 300 (Figs.1and6), but this value also has the highest background COV of any other BSREM reconstruction. These trends were also confirmed by the clinical data analysis (Fig.6and Table4), where the noise level and contrast are higher for β = 300. The use of a lower FWHM value (FWHM < 5 mm) of the smoothing post-filter would have maximized the CR and the CNR of OSEM reconstruction; however, this would have increased the COV. In compari-son with OSEM on the clinical data, BSREM reconstruction (especially for tumor lesions with VOI = 3.92 cm3and VOI = 2.46 cm3) resulted in an increased tumor SUVmean,
SUV-max, and an improved contrast at a matched level of noise. The SNR of the average of all
le-sion sizes increased by a factor of 2 at the same count level (Fig. 4). However, for lesions smaller than 1.0 cm3(Figs.6and7), both reconstructions were equivalent in terms of SUV values. The same behavior was also found in the phantom data analyses (Figs.1and2). A previous study [25] has reported that while PSF modeling commonly leads to visually en-hanced images with higher contrast, it can simultaneously lead to notable edge artifacts af-fecting the quantification of small lesions. Thus, it is important to assess in which conditions is beneficial and warranted to use PSF modeling.
recovery). A similar factor of 2 was observed in the clinical data. BSREM with a β = 750 increased SUV values and MATVs when compared to OSEM for the same acquisi-tion time (Fig.7). However, there was no difference in SUV values between OSEM (10 min) and BSREM (2.5 min), confirming that it is possible to have noise reduction with BSREM while preserving contrast.
Previous studies [23,24,26] have suggestedβ= 400 andβ= 550 as an optimum fac-tor. Another recent study with 45 patients in the initial stage of lung cancer has re-ported β values between 450 and 600 to be ideal for lung cancer [27]. Messerli et al. [28] highlight the importance for careful standardization of a βvalue when following-up non-small cell lung cancer. The optimum factor changes towards higher βvalues in patients who received a dose lower than 2 MBq/kg compared to patients who received doses higher than 2 MBq/kg. The higherβvalues appear to be more appropriate for pa-tients with lower18F-FDG doses.
In our study, the most favorable β-factor for both phantom and clinical data was in the same range withβ= 750 at higher count levels. However, the choice ofβmight de-pend on several primary aspects, such as contrast, SNR, count statistics, radiation dose, or lesion detectability. Thus, the β-parameter should be chosen dependent on the re-quirements and context of the examination. Other aspects to consider are the acquisi-tion duraacquisi-tion and the axial FOV size of the TOF PET/CT used. According to EANM’s procedure, good clinical whole-body 18F-FDG images are usually obtained with an ac-quisition time of 3.0 min/bp [21]. The acquisition time reported evaluating the BSREM algorithm used three different count statistics varying from 3.0 to 1.0 min/bp recon-struction [22] which has somewhat a discrepancy compared to the range used 1.07, 0.34, and 0.17 min/bp in our study. This peculiar time ranges per bed position was chosen to evaluate the BSREM under the condition of reduced count statistics and, consequently, this decreased range would probably lead to an increase of the β-factor. The axial FOV of 20 cm of the PET/CT scanner would lead to improvements in sensi-tivity and count rate statistics compared to an axial FOV of 15 cm used in our study.
There are other limitations that should be considered in this study. All results from the clinical data analysis were taken based on a lymphoma patient with multiple lesions of dif-ferent sizes. It is possible that an analysis of a larger and diversified group of patients would improve the results concerning the SUV lesion volume dependence. Consequently, it was not possible to evaluate the influence of the body mass index of the overweight pa-tients on β-factor [26]. Additionally, there is a restriction concerning the18F-FDG PET imaging tracer. The use of any other higher positron energy radioisotope would have led to a statistical uncertainty due to the random nature of radioactive emissions [29].
Conclusion
Penalized-likelihood BSREM reconstruction improves image quality and allows noise re-duction by a factor of 2–4 while preserving contrast compared to OSEM reconstructions. Lowering of the injected dose or shortening the acquisition time is therefore possible by introducing regularization in the image reconstruction without a loss in image quality.
Abbreviations
bp:Bed position; BSREM: Block sequential regularized expectation maximization; CR: Contrast recovery; CT: Computed tomography; FDG: Fluorodeoxyglucose; FOV: Field of view; GE: General Electric Company; LBS: Lutetium-based scintillator; MLEM: Maximum likelihood expectation maximization; NECR: Noise equivalent count rate; NEMA: National Electrical Manufacturers Association; OSEM: Ordered subset expectation maximization; PET: Positron emission tomography; PSF: Point spread function; ROI: Region of interest; SiPM: Silicon photomultipliers; SUV: Standardized uptake value; TOF: Time of flight; VOI: Volume of interest
Acknowledgements
The authors gratefully acknowledge the assistance of Lois K. Eveve from Ghent University in the acquisition of the images.
Authors’contributions
All authors contributed to the design of the study. PC, YDA, and BVDB performed data collection and analysis. All authors discussed the results and implications and commented on the manuscript. All authors read and approved the final manuscript.
Funding
This present study was conducted with a grant support to the first author from CNPq, the National Council of Technological and Scientific Development–Brazil (process number 235040/2014-2).
Availability of data and materials
The datasets used and/or analyzed during the current study are available from the corresponding author on reasonable request.
Ethics approval and consent to participate
An informed patient consent and a positive advice by the ethics committee are necessary for retrospective studies in our institution. The Belgian registration number for this study is B670201939137.
Consent for publication
The patient gave their written consent to our Healthcare Institute for use data including anonymized pictures.
Competing interests
The authors declare that they have no competing interests.
Author details 1
Medical Image and Signal Processing–MEDISIP, Ghent University, Corneel Heymanslaan 10, 9000 Gent, Belgium. 2Division of Nuclear Medicine and Molecular Imaging, UZ/KU, Herestraat 49, B-3000 Leuven, Belgium.3Department of Nuclear Medicine, Ghent University Hospital, Corneel Heymanslaan 10, 9000 Gent, Belgium.
Received: 14 March 2019 Accepted: 25 November 2019
References
1. Muehllehner G, Karp JS. Positron emission tomography. Phys Med Biol. 2006;51:R117.https://doi.org/10.1088/0031-9155/ 51/13/R08.
2. Vandenberghe S, Mikhaylova E, D’Hoe E, Mollet P, Karp JS. Recent developments in time-of-flight PET. EJNMMI Physics. 2016;3(1):3.https://doi.org/10.1186/s40658-016-0138-3.
3. Alessio AM, Stearns CW, Tong S, et al. Application and evaluation of a measured spatially variant system model for PET image reconstruction. IEEE Trans Med Imaging. 2010;29(3):938–49.
4. Hudson HM, Larkin RS. Accelerated image reconstruction using ordered subsets of projection data. IEEE Transactions on Medical Imaging. 1994;13:601–9.https://doi.org/10.1109/42.363108.
5. Vandenberghe S, D’Asseler Y, van de Walle R, et al. Iterative reconstruction algorithms in nuclear medicine. Comput Med Imaging Graph. 2001;25:105–11.https://doi.org/10.1016/S0895-6111(00)00060-4.
6. Armstrong IS, Kelly MD, Williams HA, Matthews JC. Impact of point spread function modelling and time of flight on FDG uptake measurements in lung lesions using alternative filtering strategies. EJNMMI Phys. 2014 Dec;1:99.https://doi. org/10.1186/s40658-014-0099-3.
7. Prieto E, Domínguez-Prado I, García-Velloso MJ, Peñuelas I, Richter JÁ, Martí-Climent JM. Impact of time-of-flight and point-spread-function in SUV quantification for oncological PET. Clin Nucl Med. 2013 Feb;38(2):103–9.https://doi.org/10. 1097/RLU.0b013e318279b9df.
9. Wang G, Qi J. Penalized likelihood PET image reconstruction using patch-based edge-preserving regularization. IEEE Trans Med Imaging. 2012;31(12):2194–204.
10. Tsoumpas C, Polycarpou I, Thielemans K, Buerger C, King AP, Schaeffter T, Marsden PK. The effect of regularization in motion compensated PET image reconstruction: a realistic numerical 4D simulation study. Phys Med Biol. 2013;58:1759. https://doi.org/10.1088/0031-9155/58/6/1759.
11. Ahn S, Fessler JA. Globally convergent image reconstruction for emission tomography using relaxed ordered subsets algorithms. IEEE Trans Med Imaging. 2003;22:613–26.https://doi.org/10.1109/TMI.2003.812251.
12. Nuyts J, Bequé D, Dupont P, Mortelmans L. A concave prior penalizing relative differences for maximum-a-posteriori reconstruction in emission tomography. IEEE Trans Nucl Sci. 2002;49:56–60.
13. Teoh EJ, McGowan DR, Bradley KM, Belcher E, Black E, Gleeson FV. Novel penalised likelihood reconstruction of PET in the assessment of histologically verified small pulmonary nodules. Eur Radiol. 2016;26:576.https://doi.org/10.1007/ s00330-015-3832-y.
14. Sangtae A, Steven GR, Evren A, Jun M, Xiao J, Lishui C, Scott DW, Ravindra MM. Quantitative comparison of OSEM and penalized likelihood image reconstruction using relative difference penalties for clinical PET. Phys Med Biol. 2015;60:5733 https://doi.org/PMC5944826.
15. Parvizi N, Franklin JM, McGowan DR, Teoh EJ, Bradley KM, Gleeson FV. Does a novel penalized likelihood reconstruction of 18F-FDG PET-CT improve signal-to-background in colo-rectal liver metastases? Eur J Radiology. 2015;84:1873–8. https://doi.org/10.1016/j.ejrad.2015.06.025.
16. Reynés-Llompart G, et al. Phantom, clinical, and texture indices evaluation and optimization of a penalized-likelihood image reconstruction method (Q.Clear) on a BGO PET/CT scanner. Med Phys. 2018 Jul;45(7):3214–22.
17. Lindström E, Sundin A, Trampal C, Lindsjö L, Ilan E, Danfors T, Antoni G, Sörensen J, Lubberink M. Evaluation of penalized-likelihood estimation reconstruction on a digital time-of-flight PET/CT scanner for18F-FDG whole-body examinations. J Nucl Med. 2018;59:1152–8.https://doi.org/10.2967/jnumed.117.200790.
18. Hsu DFC, Ilan E, Peterson WT, Uribe J, Lubberink M, Levin CS. Studies of a next-generation silicon photomultiplier–based time-of-flight PET/CT system. J Nucl Med. 2017;58(9):1511–8.https://doi.org/10.2967/jnumed.117.189514.
19. Caribé P, Koole M, Bertin H, D’Asseler Y, Vandenberghe S. NEMA NU 2012 performance evaluation of silicon-photomultiplier–based and conventional PMT-based time-of-flight systems. EJNMMI Physics. 2018;5(Suppl 1, A29):19. https://doi.org/10.1186/s40658-018-0218-7.
20. National Electrical Manufacturers Association. NEMA Standards Publication NU 2–2007, Performance measurements ofpositron emission tomographs: Rosslyn; 2013. p. 26–33.https://www.nema.org. Accessed 04 Dec 2019. 21. Boellaard R, et al. FDG PET/CT: EANM procedure guidelines for tumour imaging: version 2.0. Eur J Nucl Med Mol
Imaging. 2015;42:328–54.https://doi.org/10.1007/s00259-014-2961-x.
22. van der Vos CS, Koopman D, Rijnsdorp S, et al. Quantification, improvement, and harmonization of small lesion detection with state-of-the-art PET. Eur J Nucl Med Mol Imaging. 2017;44:4–16.https://doi.org/10.1007/s00259-017-3727-z.
23. Nguyen NC, Vercher-Conejero JL, Sattar A, et al. Image quality and diagnostic performance of a digital PET prototype in patients with oncologic diseases: initial experience and comparison with analog PET. J Nucl Med. 2015;56:1378–85. https://doi.org/10.2967/jnumed.114.148338.
24. Teoh EJ, McGowan DR, Macpherson RE, Bradley KM, Gleeson FV. Phantom and clinical evaluation of the bayesian penalized likelihood reconstruction algorithm Q.Clear on an LYSO PET/CT System. J Nucl Med. 2015 Sep;56(9):1447–52. https://doi.org/10.2967/jnumed.115.159301.
25. Rahmim A, Qi J, Sossi V. Resolution modeling in PET imaging: theory, practice, benefits, and pitfalls. Med Phys. 2013 Jun; 40(6):064301.https://doi.org/10.1118/1.4800806.
26. Spasic E, Jehanno N, Bblondeel-Gomes S, Huchet V, Luporsi M, Mounat TC. Phantom and clinical evaluation for new PET/CT reconstruction algorithm: Bayesian penalized likelihood reconstruction algorithm Q.Clear. J Nucl Med Radiat Ther. 2018;9(4):371.https://doi.org/10.4172/2155-9619.1000371.
27. Messerli M, Stolzmann P, Egger-Sigg, et al. Impact of a Bayesian penalized likelihood reconstruction algorithm on image quality in novel digital PET/CT: clinical implications for the assessment of lung tumors. EJNMMI Physics. 2018;5:27. https://doi.org/10.1186/s40658-018-0223-x.
28. Messerli M, Kotasidis F, Burger IA, Ferraro DA, Muehlematter UJ, Weyermann C, et al. Impact of different image reconstructions on PET quantification in non-small cell lung cancer: a comparison of adenocarcinoma and squamous cell carcinoma. Br J Radiol. 2019;92:20180792.https://doi.org/10.1259/bjr.20180792.
29. Caribé PRRV, Koole M, D’Asseler Y, et al. NEMA NU 2–2007 performance characteristics of GE Signa integrated PET/MR for different PET isotopes. EJNMMI Phys. 2019;6:11.https://doi.org/10.1186/s40658-019-0247-x.
Publisher’s Note