RESEARCH
An alternative developmental
table to describe non-model fish species
embryogenesis: application to the description
of the Eurasian perch (
Perca fluviatilis
L.
1758)
development
Maud Alix, Dominique Chardard, Yannick Ledoré, Pascal Fontaine and Berenice Schaerlinger
*Abstract
Background: Fish correspond to the most diversified phylum among vertebrates with a large variety of species.
Even if general features are distinguishable during the embryogenesis, several differences in term of timing, organ implementation or step progression always occur between species. Moreover, the developmental timing of wild non-model fish often presents variability within a species. In that context, it is necessary to define a non-model of developmen-tal table flexible enough to describe fish development by integrating this variability and allow intra- and inter-specific comparisons. The elaboration of a model passes by the definition of new stages that could be easily observable on individuals. The present study aims at proposing such a model and describing accurately the Eurasian perch (Perca fluviatilis) embryogenesis using microscopic techniques among which time lapse video and histological studies. The Eurasian perch belongs to the Percidae family that includes 235 species classified in 11 genera. It is a member of the Perca gender and inhabits the Northern part of Europe and Asia.
Results: At 13 °C, P. fluviatilis development elapses for 15 days from the fertilization to the first oral feeding. The
stag-ing division first took into account the cellular status to define periods, then the acquisition of new abilities by the embryo to further define stages. It allowed distinguishing two main stages during the cell cleavage period depending on the synchronization of the cell divisions, two stages during the gastrulation period depending on the cell speed migration and five stages during the organogenesis according to the acquisition of key abilities as proposed in the saltatory theory. During each stage, organs implementation was carefully followed with a particular attention for the visual and digestive systems. In addition, our study shows that embryos hatch at various developmental stages while they all begin to feed at a fixed date, 15 days after the fertilization whatever the spawn and the hatching date. These data give arguments to propose the first oral feeding as the best definition of the embryonic-to-larval transition.
Conclusions: The present model of developmental table combines flexibility and accuracy allowing detailed
description of non-model fish species and intra- and inter-specific comparisons.
Keywords: Perca fluviatilis, Developmental table, Histology, Embryogenesis description, Digestive system ontogeny,
Visual system ontogeny
© 2015 Alix et al. This article is distributed under the terms of the Creative Commons Attribution 4.0 International License (http:// creativecommons.org/licenses/by/4.0/), which permits unrestricted use, distribution, and reproduction in any medium, provided you give appropriate credit to the original author(s) and the source, provide a link to the Creative Commons license, and indicate if changes were made. The Creative Commons Public Domain Dedication waiver (http://creativecommons.org/publicdomain/ zero/1.0/) applies to the data made available in this article, unless otherwise stated.
Open Access
*Correspondence: [email protected]
Background
Fish species have colonized numerous ecological niches allowing them to evolve and be adapted to various envi-ronments. As a consequence, fish represent the most diversified vertebrates regarding their lifestyle, shape, physiology, reproduction or development to quote only them. In that context, numerous developmental tables of various fish species have been published (e.g., the fol-lowing recent studies 1–5). Besides common features, numerous differences emerge between fish species mak-ing difficult the standardization of embryogenesis stag-ing. Two main description ways of the fish embryonic development co-exist. The first way mainly follows con-tinuous morphological modifications of the embryos as for zebrafish, medaka or goldfish, for example [1, 5, 6]. Each step is accurately identified and some precise mor-phological criteria as the somites differentiation are used as the time scale of the organogenesis period [e.g., 6]. These fish are model species and represent teleosts fish in the developmental biology field. The description of their development needs to follow some accurate standards for comparative biology. However, these fish were mainly chosen as model for practical reasons as their ease of rearing in laboratory conditions, their short developmen-tal period, their size or access to genetic tools compared to other fish species. Furthermore, they are well adapted to their rearing conditions and their development is very regular, allowing an acute repeatability in term of timing in controlled conditions. Nevertheless, the embryogen-esis progress of non-model species is often less repeat-able at a specific temperature [7]. For example, during the cell cleavage of the walleye, authors mentioned from the beginning that they observed individual variations lead-ing to different number of blastomere whatever the time [8]. In addition, the mechanisms regulating somitogen-esis and other organs ontogeny may not be synchronous in all individuals, rendering such model of developmental table quite difficult to apply.
Another way to describe fish development takes into account these variations allowing more flexibility. Balon [9] observed that fish embryogenesis progress by fits and starts. He thus proposed that ontogeny can be divided into two kinds of stages named thresholds and steps [9, 10]. Thresholds allow describing the sudden acquisition of a new ability. Their sequence highlights key stages allowing individuals to reach a new developmental level. During steps, slow and continuous development of sev-eral organs is observed before that sudden acquisition of a new ability and thus a new threshold. This approach permits a better description of the common features observed in various fish species while taking into account potential intra and inter-specific variations. However, in
the studies performed with this model, fish development is often less accurately described.
Instead of opposing these two schools, it would thus be more profitable for scientists to take into account advantages of each model and improve accuracy while facilitating intra and inter-specific comparisons of fish development. To do so, it would be interesting to trace the accurate description of organs ontology performed in the first model on a time scale different from somi-togenesis. In this condition, the definition of steps and thresholds as a new time scale would be more flexible. The present work aims at describing organs ontogeny in order to define precisely steps and thresholds and make an accurate timing of perch early development.
transition implies to make a difference between the development before and after hatching. In these condi-tions, individuals developing outside the protective cho-rion are defined as “free embryos” [9].
The present study aims at describing Eurasian perch (Perca fluviatilis) embryogenesis. It is a temperate fresh-water fish species that inhabits from Northern countries of Europe to the North-East Asia, with some introduced populations in Southern countries of Europe and some countries of the South hemisphere [16, 17]. Its flesh is appreciated and the Eurasian perch belongs among the most promising fish species to promote freshwater fish diversification [18–20]. Perch domestication is still under process and its reproduction has already been investi-gated allowing a good knowledge of its reproduction cycle [18, 20–27], egg quality [28, 29] and larval develop-ment [30]. However, only few studies investigated perch embryonic development [31–33]. In 1854, Lereboul-let performed the first description that was quite pre-cise from the fertilization to the disappearance of the yolk. The author divided perch embryogenesis into four phases: (1) cell cleavage and gastrulation, (2) from the beginning of the organogenesis to the first heart beatings, (3) from heart beatings to hatching and (4) from hatching to the yolk disappearance [31]. He focused his descrip-tion on the circulatory and intestinal systems. Later, in 1925, Chevey [32] mainly focused his attention on the cell cleavage and the gastrulation but poorly described organs differentiations until hatching. In the lab, a preliminary study allowed us to determine large periods of perch development [33]. Eurasian perch belongs to the Percidae family that is divided into 11 genders: Ammocrypta,
Crys-tallaria, Etheostoma, Gymnocephalus, Perca, Percarina,
Percina, Nothonotus, Romanichthys, Sander and
Zin-gel. With the American yellow perch (Perca flavescens) and the Balkhash perch (Perca schrenkii), they compose
the Perca gender. Its reproduction cycle lasts for about
9–10 months and its natural spawning season begins when the water temperature reaches around 12 °C [21] and elapses from mid-March to June depending on the geographical localization. Perches are group-nous fish meaning that their gonadogenesis is synchro-nous and that one female spawns at one time all its eggs [25]. Its gonadogenesis is under the control of the water temperature and the photoperiod. Recent studies aimed at developing a photothermal program allowing obtain-ing spawn in artificial controlled conditions (indoor) and even out-of-season reproduction [34]. However, it appears that the reproduction success is highly variable with important developmental impairments during early embryogenesis (personal observations). To better under-stand the reasons and the consequences of these develop-mental defects, it is essential to better characterize Perca
fluviatilis early development and define a developmental table as a reference.
In order to describe accurately the Eurasian perch embryogenesis, time lapse video and histological tech-niques were used. Data show that while hatching can elapse for 5 days and that individuals hatch at different developmental stages, all embryos first feed 15 days after the fertilization whatever their hatching dates. These data suggest that the first oral feeding rather represents a threshold as defined by Balon [9] and thus is more accu-rate to define the embryonic-to-larval transition. In these conditions, the total duration of P. fluviatilis embryonic development elapses for 15 days at 13 °C, from the ferti-lization to the first oral feeding. The first main division of the development was performed according to the cellular state (cell division, migration or differentiation) to sepa-rate zygote, cell cleavage, gastrulation and organogenesis periods. Those periods were then further cut into steps separated by well-defined thresholds. In addition, we focused a particular attention to the digestive and visual systems ontogeny throughout embryogenesis because they play an important role, later, during larval stages.
Methods
Origin of fish, broodstock
population were kept in indoor tanks and submitted to artificial conditions all along the reproduction cycle and the spawning season. Breeders caught in ponds (Popula-tions 2, 3 and 4) were transferred 1 month before the nat-ural spawning season, in our outdoor facilities consisting of a recirculating system (tanks of 3000 L, Laneuvelotte, Lorraine, France). Breeders from the fifth population were also transferred from indoor tanks into our outdoor facilities before the spawning season. Breeders from the sixth population staid in the fishfarm and eggs ribbons from four females were collected and transferred in our indoor facilities 6 days after the fertilization.
Hatcheries management and water quality
Each incubator consists of a water recirculating system of 1400 L with a flow rate of 18 m3/h. They were under municipal water system and air and water’s thermoregu-lation was maintained with air-conditioning and refrig-erating unit (2200 W). In the first incubator, used for the daily following of the embryonic development, egg ribbons (17,000–84,000 eggs) were transferred in large crates allowing aeration thanks to a continuous horizon-tal water current in each crate. For large spawn several crates were used per spawn. In the second incubator, three samples of ribbons (around 100 eggs/sample) for each spawn were kept in baskets until hatching to deter-mine hatching time and duration. Baskets were aer-ated thanks to the water flow. So, for every spawn, some embryos were incubated in each of the incubators. This division was done to optimize the space in hatcheries and facilitate our organization. No difference of hatching tim-ing and duration was observed between samples of one spawn in the different incubators. The optimal water tem-perature for perch development has been defined as 13 °C [35]. In the present work, the mean temperature was kept at 13.0 ± 0.5 °C in all hatcheries during each season. A constant dark/light photoperiod (8:16) was applied with two neon lamps at a light intensity of 200 lx at the water surface. Water levels of pH (8.19 ± 0.09), dissolved oxy-gen (9.84 ± 0.16 mg/L), nitrite (0.16 ± 0.16 mg/L) and ammonium (0.17 ± 0.17 and 1.08 ± 0.95 mg/L, in 2013 and 2014, respectively), were monitored twice a week in breeders’ tanks (indoor and outdoor) and in the hatch-eries. In order to prevent bacterial or fungal infections, experimenter used footbath, antibacterial solution for hand and the water was sterilized with UV.
Gametes collection and fertilization
Perca fluviatilis has a group-synchronous oogenesis but within a population all females don’t spawn exactly at the same time and thus the spawning period can elapse from 3 to 5 weeks within a broodstock. The beginning of the spawning season was considered as triggered once the
first ribbon was observed in a tank. From that time, each perch was caught daily to check specifically its reproduc-tive status. Once a female was mature (apparition of a blister at the genital orifice), it was stripped to collect ova in dry glass beakers. Their activation was done for 15 s by the addition of water from breeders tanks [20]. Subse-quently, in vitro fertilizations were performed by adding to the ova a mixture of sperm of three different males in order to optimize the fertilization success.
Study of the developmental progress by microscopy and time lapse microscopy
Fish early embryogenesis was followed by time lapse microscopy on embryos originating from 13 spawn (total number of records = 54) from the first cell cleavage (2.5 hpf) to the beginning of the organogenesis (99.5 hpf) when the muscle contractions prevented to perform properly the time lapse experiment. The increase of water temperature under the microscope can modify the devel-opmental speed of the embryos observed in comparison to those from the same spawn staying in incubators. In order to avoid bad recording of the developmental tim-ing, embryos were removed after 1 h of development. Then, new embryos from the hatchery were transferred into a Petri dish filled with fresh water and placed under the microscope. In this condition, the developmental timing recorded, was respecting the one observed in the incubator. The time lapse microscopy was performed using a light upright optical microscope (Nikon Eclipse Ni-U) associated with a DS-Fi2 digital camera and the software NIS BR (Nikon France, Champigny-sur-Marne, France). A picture was taken every 40 s or every minute depending on the process velocity. Pictures were taken at low magnification (2×).
From day three post-fertilization, embryos from 36 spawn have been observed to describe organogenesis. Among these spawn, 13 were submitted to a careful daily following (n > 3 embryos/spawn/day). Embryos were sampled once or twice a day for microscopic observa-tions. The jelly coat was removed using micro-dissecting forceps under a binocular microscope. In order to cre-ate all-in-focus pictures for some samples, we used the “extended depth of focus” (EDF) option of the software. Moreover, large images were taken thanks to “grab a large image” option of the software. Pictures were taken at low magnification (2×). The embryonic total length was measured daily on fixed embryos (3 spawn, 15 embryos/ spawn/day) using the Nikon BR software. Data are pre-sented as a mean value ± standard deviation.
Fixation and histology
and conserved in 70 % alcohol. In order to facilitate their cutting orientation, embryos were first placed in 1.5 % agarose blocks. These blocks were then dehydrated in ascending series of ethanol (70–100 %) before being embedded in paraffin. Four micrometer sections were performed with a Leitz Wetzlar microtome and collected on glass slides. Hematoxylin and Eosin staining were per-formed according to a protocol adapted from Gabe [36] as follows: Eosin Y (Sigma-Aldrich, Saint Quentin Falla-vier, France) was diluted in water at 1 % and used from 30 s to 1 min; Hematoxylin solution modified according to Gill III (Merck, Darmstadt, Germany) was used from 5 to 10 min. Stained sections were examined using a light upright optical microscope (Nikon Eclipse Ni-U) at 10×
and 40× magnifications (Nikon France, Champigny-sur-Marne, France). In total, 45 embryos from 11 spawn have been used for the histological study. Three embryos were transversally cut per day from 4 to 15 dpf. In addition, three embryos were longitudinally cut at 5, 10 and 15 dpf.
Determination of the first oral feeding period
Two independent experiments were used to determine the first oral feeding (one in 2014 and the other one in 2015). In the first one, fifty embryos randomly cho-sen from six spawn were used and in the second one four spawn (n = 4–10 for each condition). The hatching period was checked daily until the first hatching. Each day of hatching all embryos were taken and put in a new crate. Hatching dates elapsed from 8 to 14 dpf depend-ing on the spawn for the first experiment and from 9 to 14 dpf for the second one (e.g., for the second experi-ment, spawn 1 hatched between 11 and 13 dpf; spawn 2 between 9 and 12 dpf; spawn 3 and 4 between 9 and 14 dpf). All spawn were kept and studied in the same conditions within one experiment. Embryos were taken at their date of hatching and kept in 1–2 L beakers in the first experiment or in 50 mL tubes in the second experi-ment. This difference of methodology is due to techni-cal reasons in our hatcheries. In every case, containers were filled with the water of the hatchery and plunged in the hatchery to maintain the water temperature around 13 °C. Each container corresponds to one group of embryos coming from the same spawn and that hatched at the same dates. So for one spawn, there was as much container as hatching dates and each spawn was indepen-dently studied in both experiments. In the beakers, the volume of water was large enough to allow oxygenation for several hours. The 50 mL tubes contained 40 mL of water. No lethality was observed while embryos were in the tubes suggesting that there was no problem of oxy-genation. Rinsed alive Artemia nauplii (Catvis, size: EG) were supplied as food to embryos daily from hatching (20 mL; density = 10–14/mL). After 2 h with Artemia,
the digestive system of alive free embryos was observed using binocular Olympus (SZX7) at low magnification (2×). As embryos are transparent, the presence of Arte-mia was easily detectable in the digestive tract. If the embryos did not eat, the water was changed in the beak-ers to perform another time the experiment in the exper-iment one. In the experexper-iment two, new embryos taken from the same crate were used to continue the experi-ment. Once embryos ate, they were submitted to an overdose of Tricaine methanesulfonate (200–300 mg/L; Sigma-Aldrich) until they die according to the European Ethical guidelines (Directive 2010/63/UE).
Comparison of the developmental process between hatched and unhatched embryos
Ni-U) at 2×, 4×, 10× and 40× magnifications (Nikon France, Champigny-sur-Marne, France). The apparition of each criterion was recorded daily for each embryo until they first feed. The comparison between the newly hatched embryos and their not yet hatched counterparts was done to determine whether there were differences of developmental rate once the embryo leave its envelope.
Statistical analyses
The water quality parameter data are presented as mean ± SD. The normality and homogeneity of variances were tested using a Levene test. A one-way analysis of variances (ANOVA) was performed with one factor (year of experiment). The minimum level of significance was set at p < 0.05. When data did not respect the assump-tions of normality, a Kruskal–Wallis test followed by a non-parametric Mann–Whitney test were performed.
For the morphometric measurement performed to determine the size difference between free and embed-ded embryos, data are presented as mean ± SD. The nor-mality and homogeneity of variances were tested using a Levene test. A two-way analysis of variances (ANOVA) was performed with two independent factors (factor 1 = groups NHE, UE, FE and factor 2 = time) followed by Bonferroni’s post hoc tests to determine significant differences. The minimum level of significance was set at p < 0.05. When data did not respect the assumptions of normality, a Kruskal–Wallis test followed by a non-para-metric Mann–Whitney test were performed. All the sta-tistical analyses were performed using STATISTICA 12.0 program (Statsoft Inc., Tulsa, OK, US).
Results
Fish embryogenesis begins when the ova is activated, allowing the fertilization and ends at the first oral feed-ing. It lasts for 15 days at a constant temperature of 13. ± 0.5 °C (195°d). The mean embryonic total length increases from 0.98 (zygote diameter) to 6.23 mm at the time of the first exogenous feeding (Fig. 1). The embry-onic growth is fast during the first steps of the organo-genesis period and slows down before the hatching period until the end of the study. In the present work, the starting time corresponds to the fertilization.
The zygote period (0–2.5 hpf)
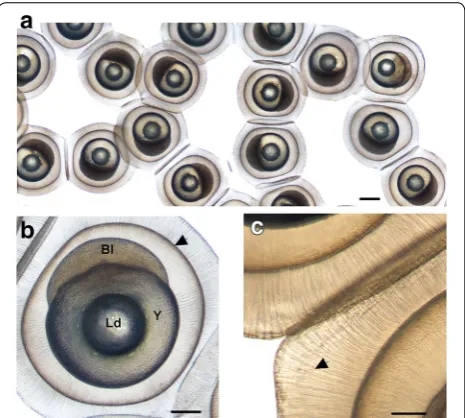
The zygote is surrounded by a thin chorion (Fig. 2b, arrow-head) and a large gelatinous envelope (or jelly coat) organ-ized with tubular structures (Fig. 2c) called zona radiata
externa as previously described by Formicki et al. [14]. It
allows maintaining the eggs together and forming a ribbon (Fig. 2a). After the fertilization, the mean zygote diameter is 0.98 ± 0.065 mm, without the jelly coat. A lipid droplet is present on the vitelline reserve (Fig. 2b) that is most of
the time unique but can sometimes be divided into several smaller droplets. At the animal pole, the cytoplasm sepa-rates from the yolk to form the blastodisc.
The cell cleavage period (2.5–24 hpf)
The first cleavage (2.5–4 hpf) follows the animal to veg-etative poles axis and results in two large cells of equiv-alent size (Fig. 3a). Between 4 and 5 hpf, the second cleavage occurs perpendicularly to the first division but still in the animal to vegetative poles axis generating four blastomeres. The eight-cell stage occurs between 5 and 6 hpf by cutting the blastoderm perpendicularly from the animal to the vegetative pole in order to obtain two rows of four cells (Fig. 3b). The next cleavages cut the embryo either along the animal to vegetative axis or perpendicu-lar to it (Fig. 3d–f). Surprisingly, divisions are accompa-nied by waving movements coming from the yolk to the animal pole that is strong during the first cell divisions (Additional file 1) but become less important later in the process (Additional file 2). This loss of yolk contrac-tions is accompanied by an asynchrony of cell divisions appearing between 64 and 128 cells stage and later a slowing down of the cell division from the stage 512 cells (Table 1). These differences allow us to separate the cell cleavage period into two steps “cell cleavage 1” (CC1) and “cell cleavage 2” (CC2) for the synchronous and asyn-chronous steps, respectively. However, the cell division does not have the same rate for every embryo and within a spawn this period is not synchronous between neigh-bor embryos or between spawn, rendering difficult an accurate timing of this period. In spite of this heterogene-ity, the end of the cleavage period is always at 24 hpf.
The gastrulation period (24–50 hpf)
The gastrulation is defined as the period during which cellular movements (involution, convergence and exten-sion) of the blastoderm tend to form the embryonic axis and the organization of the germ cell layers: the epiblast that will give rise to a part of the ectoderm, the hypoblast that corresponds to the future mesoderm and endoderm [6]. First, epiboly movements begin at 24 hpf and the cel-lular front reaches 30 % of epiboly at 25.75 hpf (Fig. 3g; Table 2) and 50 % of yolk surface at 29.50 hpf (Fig. 3h; Table 2). At that stage, asymmetric thickening of opposite extremities of the embryos corresponding to the embry-onic shield stage is observed, allowing the first visualiza-tion of the antero-posterior axis (Addivisualiza-tional file 3). Until 70 % of epiboly, the cell progression along the yolk is regular and fast. It corresponds to the step gastrulation 1 (G1). During the second step (G2), from 70 % epiboly stage, the cellular front progresses more slowly. The germ ring compresses the yolk (31.25 hpf) and the poste-rior end of the embryo can be distinguished (Additional file 3). Later both extremities of the embryo continue to thicken even if the posterior part always remains thicker until the 90 %-epiboly stage (Fig. 3i, 40.25 hpf). The yolk syncytial layer (YSL) corresponding to a multinucleated cell layer between the yolk and the blastomeres is visible (Fig. 3n). This structure is observed later during embry-ogenesis. In contrast to the walleye [8], except for some
rare cases, no embryonic rotation has been observed during perch gastrulation.
The organogenesis period (50 hpf–15 dpf)
During this period, cells begin to differentiate in order to achieve organs implementation. Only key steps of the development of several organs from 3 to 15 dpf are described: organogenesis has thus been divided into five steps separated by well-defined thresholds. Then, the description of the digestive and visual systems develop-ments is presented.
Organogenesis subdivision
Organogenesis 1 (O1) stage from the first cell differentiation to the first heart beatings (2–4 dpf)
One recurrent cell differentiation stage is the somi-togenesis that occurs sequentially from the trunk to the most posterior side of the embryo. At the beginning of this stage, embryos measure 1.92 mm ± 0.06 (Fig. 1). The optic capsule (Fig. 3j, arrowhead) appears at 50 hpf, before the tail bud closure (51.75 hpf) suggesting that the cell differentiation begins before the end of the gastrula-tion movements. The three first somites can be observed at 58.25 hpf on living embryos. At 64 hpf, 4 or 5 pairs of somites are visible (Fig. 3m, arrowhead; Table 2). Twelve pairs of somites are developed at 76.75 hpf. Between 77.25 and 81 hpf, depending on the spawn, 15 pairs of somites can be seen (Fig. 3k). Other organs progressively appear as the Kupffer’s vesicle that is observable from 52.75 hpf (Fig. 3l, arrowhead) to 84 hpf. As for the wall-eye [8] a translocation movement allowing decreasing the distance between embryo’s head and the lipid drop-let occurs the third day of development. The notochord is first visible at 55.75 hpf on living embryos and begins to be vacuolated from the 4th dpf. At this stage, embryo’s length attains 2.80 ± 0.20 mm (Fig. 1) and the auditory vesicles begin to develop. The epithelium of the embryo appears and is composed by various cell types such as the mucous and the club cells and later in the organogenesis, by the keratinocytes. During the same day, at 99.5 hpf, the first heart beating and spontaneous muscle contrac-tions were recorded. The heart is already composed of two separate cavities corresponding to the future ventri-cle and atrium. The tail begins to separate from the yolk.
Organogenesis 2 (O2) stage from the first heart beatings to the differentiation of the organs associated to the digestive system (4–7 dpf)
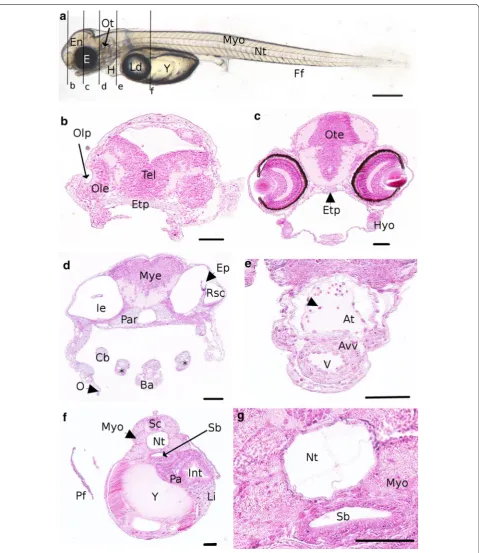
At day 5 post-fertilization the brain is subdivided into three parts: (1) the forebrain (future telencephalon and diencephalon), (2) the midbrain (future mesencephalon and metencephalon) and (3) the hindbrain (future mye-lencephalon) (Figs. 4a, 5a). In addition, the olfactory bulb Fig. 2 Morphological characterization of P. fluviatilis spawn and
zygote. a Perch embryos embedded in the jelly coat allowing form-ing a ribbon of eggs. The scale bar represents 500 µm. b Face view of zygote stage. Bl blastoderm, Y yolk, Ld lipid droplet. The chorion (arrowhead) surrounds the zygote. The scale bar represents 250 µm.
c Detail of jelly coat presenting tubular structures (arrowhead). The
Fig. 3 Cell cleavage and gastrulation periods. a–j Face view of a two-cell stage (3.25 hpf ) at the animal pole of the embryo (AP animal pole, VP veg-etative pole). b Height-cell stage (5.5 hpf ), c 32 cells stage (8 hpf ), d 128 cells stage (9.5 hpf ), e 512 cells stage (11.5 hpf ), f high blastula (14.25 hpf ),
located in the most anterior part of brain (Fig. 5b) and the medulla oblongata in the myelencephalon are observed.
The medulla oblongata forms a continuum with the
spi-nal chord that follows dorsally the notochord all along the embryo. At 5 dpf, a pair of otoliths is clearly visible in the otic vesicles (Figs. 4a, 5a) and the first small patches of melanophores appear on the yolk. Pectoral fin buds are present behind the heart cavity, just above the vitelline mass. The cardiac cavity’s enlarging is observed at 6 dpf, in the same time than the onset of circulation on the ventral-posterior side of the yolk, behind the lipid droplet in the subintestinal vitelline vein [8, 38]. However, the first circu-lating cells are detected the 7th dpf. The ventricle and the atrium are separated by thicker walls and the atrio-ventric-ular valve localized between them (Fig. 5d). In the mean-time, pectoral buds have evolved into pectoral fins and are clearly visible on living embryo (Fig. 5a, e, g). The tegu-ment of the fins contains club and mucous cells. Moreo-ver, the renal system is composed of pronephric ducts and
urinary bladder after the end of intestine. The pronephric ducts are localized at each side of the myotomes (Fig. 5e) and organized in one layer of cuboidal cells forming a tube. The myotome and the chord are already well differentiated (Fig. 5f). From 7 dpf, first organs associated with the diges-tive system begin to differentiate as described below. In the same manner the eyes begin to be well formed (Fig. 5c). Few embryos begin to hatch from 6 dpf in the crates of the hatchery. No hatching gland and thus hatching enzyme releasing was observed in this study.
Organogenesis 3 (O3) stage from the differentiation of the organs associated to the digestive system to the mouth opening (7–10 dpf)
Concerning the circulation system, large arteries are vis-ible from the 8th dpf. They are located on each side of the somites, above the pharynx and more prominent at
Table 1 Durations of cell cleavages from two cells to the high blastula stage
From 128 cells stage, the cell cleavage becomes asynchronous (italic)
Stage Mean duration (h)
2 cells 1.5
4 cells 1
8 cells 1
16 cells 1.5
32 cells 1
64 cells 1.25
128 cells 1
256 cells 1.5
512 cells 3
1024 cells 2
Table 2 Timing of the gastrulation and the somitogenesis
Numbers correspond to the time by which the developmental process occurs
Stage Apparition
30 % epiboly 25.75 hpf
50 % epiboly 29.50 hpf
70 % epiboly 31.25 hpf
80 % epiboly 36.25 hpf
90 % epiboly 40.25 hpf
Tailbud 51.75 hpf
Three somites 58.25 hpf
4–5 somites 64 hpf
12 somites 76.75 hpf
15 somites 77.25–81 hpf
17 somites 83.25 hpf
35–40 somites 8–15 dpf
Fig. 4 Comparison of the embryonic morphology during P. fluviatilis
organogenesis. a 5 dpf living embryo representative of the O2 period. Several organs are already visible as the encephalon En, eyes E, lipid droplet Ld, yolk Y, myotome Myo, notochord Nt and the otic capsule
Oc. b 7 dpf representative to the beginning of the O3 period. c 9 dpf representative to the end of O3 period. d 11 dpf, representative of the O4 period. e 15 dpf representative of the O5 period. Scale bars
9 dpf (Fig. 6d). The heart is composed of three well-devel-oped chambers among which the bulbus arteriosus that appears at that time. The blood circulation makes sinuses in the yolk (Additional file 4) and leaves it toward the ven-tral part of the embryos. The heart beating is slow with a mean of 78 ± 0 beats per minute recorded (n = 3). The pigmentation appears in the ventral side of the embryos and spreads along the antero-posterior axis. In addition, at 9 dpf, one of the important events is the apparition of the cartilages (Fig. 6c). The first one to differentiate is the chondrocranium (cranial skeletal element) composed of the ethmoïd plate (Fig. 6b) and the parachordal which is paired on each side of the notochord. The second part of the cartilages structure is the pharyngeal cartilages which are divided into several elements: basihyal, basi-branchial, hyosymplectic and palatoquadrate cartilages (Fig. 6c, black stars). Chondrocytes are also observed into pectoral fins (Fig. 6e). In the same time, in the inner ear, epithelial projections are visible (Fig. 6c). On histological sections, under the caudal vein, at the end of the rectum, the urinary bladder is apparent (Fig. 6g). The finfold sur-rounding living embryos (Fig. 6a) is also present above the spinal chord in a transverse section (Fig. 6g). The last stage of cartilage development is carried out the 10th dpf, with the formation of ceratobranchial arch and Meckel’s cartilage. The circulation system is developing with a vis-ible cell circulation between the somites and toward gill arches on living embryos. At the end of the stage, the first peristaltic undulations occur. At the same time the mouth of the embryo opens. The main hatching period begins from 9.5 dpf but most of this period lasts over O4 and O5 stages. As a whole, we observed that hatching does not correspond to a specific stage because it lasts for 5 days on average (from the first embryo’s hatching to the last one within one spawn). Moreover, the onset of this phase is different between spawns (6–14.5 dpf) with high rates of hatching between 9 and 14.5 dpf. Interest-ingly, the developmental timing is the same if the embryo is still in the chorion or in the free form (Fig. 10a, b).
Organogenesis 4 (O4) stage from the mouth opening to the first coordinated movements (10–11 dpf)
During this period, the peak of hatching begins and free embryos cannot swim continuously but move toward the surface with short times of uncontrolled movements of fins and times of passive sinking. Except for the gills differentiation, no evident morphological modifications occur during that period.
Organogenesis 5 (O5) stage from the first coordinated movements to the first food intake (11–15 dpf)
After the 11th dpf, the movements of the pectoral fins are more coordinated, allowing embryos to go toward the
water surface. At the same moment, the gills anlage can be noted on living embryos. Below the hyosymplectic car-tilage, opercula are developed and clearly observable. In the inner ear, epithelial projection forms the rostral semi-circular canal of the vestibular system (Fig. 7d). At 11 dpf, embryos possess differentiated chambers that compose the heart (Fig. 7e), separated by the atrio-ventricular valve. The wall of the ventricle appears thicker than in the atrium. Blood cells (Fig. 7e, arrowhead) could be seen in the atrium. The heart beating is between 136 and 142 beats per minute (at 12 and 14 dpf, respectively). Melanophores line the ven-tral part of the embryos and a sporadic pigmentation is pre-sent toward the somites (Fig. 7a). On living embryos, first movements of the jaw are observed during the 12th dpf.
First oral feeding (15 dpf)
Two independent experiments were conducted to deter-mine the time of the first oral feeding. For each spawn (total number of spawn = 10), embryos were isolated from their hatching dates and alive Artemia nauplii were proposed as food daily. In every case, the moment of the first oral feeding appeared at 15th dpf in free embryo, independently of their hatching date. As this phenom-enon always appears at a very specific moment, it corre-sponds to an important threshold for the embryo. Larvae still have a small yolk and a lipid droplet (Fig. 4e) indicat-ing that they mainly entered a mixed feedindicat-ing period.
The anatomy of the young larva shows that cartilages are composed of chondrocytes and appear clearly dif-ferentiated from the other tissues and colored in blue on histological sections (Fig. 8b, c). These cartilages are divided in two main parts: the chondrocranium com-prising the cranial skeletal elements, and the pharyngeal cartilages (Fig. 8c, e). It forms the musculoskeletal sys-tem with the myotomes (mainly future striated muscles), the notochord (supporting axis of the embryo) and the pectoral fins (Fig. 8a). A part of the circulation system is illustrated in the Fig. 8g with the heart composed by
the bulbus arteriosus, the ventricle, the atrio-ventricular
valve and the atrium. The blood flow will pass through the atrium, the ventricle pumping it into the bulbus arte-riosus. On living embryos, melanophores line in the ven-tral side of the embryo, along the myotomes and on the yolk (Fig. 9a, d). The pigmentation is also present over the swim bladder (Fig. 9c) and on the rectum (Fig. 9e). The finfold starts to differentiate, forming lobes at the locali-zation of the future caudal fin.
Comparison of the developmental process between hatched embryos and their unhatched counterparts
Fig. 5 Detailed description of an embryo 7 dpf representative to the beginning of the O3 period. a Whole embryo. Black lines represent the loca-tion of transverse secloca-tions shown in b, e. b, c, e Transverse sections and d, f, g coronal sections. b Section of the head. c Detail of an eye. The arrow-head shows pigmented cells. d Detail of the heart. The arrowhead shows the atrioventricular valve. e Section of the trunk. f Vacuolated notochord surrounded by myotomes. g Coronal section of the head and the trunk. At atrium, Dien diencephalon, E eyes, En encephalon, Ff finfold, Gc ganglion cells, H heart, Inl inner nuclear layer, Int intestine, Ip inner plexiform, L lens, Ld lipid droplet, Mye myelencephalon, Myo myotome, Nt notochord, Ob
Fig. 6 Detailed description of an embryo at 9 dpf representative of the end of the O3 period. a Whole embryo. Black lines represent the location of transverse sections shown in the following images. b–g Transverse sections. b, c Sections of the head. d–f Section of the trunk. g Section of the tail.
Art artery, C and stars in c cartilage, Cm choroïdal melanocytes, Cv caudal vein, Dien diencephalon, E eyes, En encephalon, Ep epithelial projection,
Etp ethmoïd plate, Ff finfold, H heart, Ie inner ear, Int intestine, Ld lipid droplet, Li liver, Mes mesencephalon, Mobmedulla oblongata, Mye myelen-cephalon, Myo myotome, Nt notochord, Opc optic nerve chiasma, Ot otoliths, Pa pancreas, Pf pectoral fins, Ph pharynx, Prd pronephric duct, Sb
Fig. 7 Detailed description of an embryo at 11 dpf representative of the O4 period. a Whole embryo. Black lines represent the location of transverse sections shown in b–f. b–g Transverse sections. b–d Sections of the head. e Section of the heart the arrowhead shows an erythrocyte. f Section of the trunk. g Detail of the section f showing the vacuolated notochord and the difference of epithelium thickness between the ventral and the dorsal sides of the swim bladder. At atrium, Avv atrioventricular valve, Babulbus arteriosus, Cb and stars ceratobranchial arch, E eyes, En Encephalon,
Ep epithelial projection, Etp ethmoïd plate, Ff finfold, H heart, Hyo hyosymplectic, Ie inner ear, Int intestine, Ld lipid droplet, Li liver, Myo myotome, Nt
notochord, Ole olfactory epithelium, O operculum, Olp olfactory pit, Ot otoliths, Ote optic tectum, Pa pancreas, Par parachordal, Pf pectoral fins, Rsc
Fig. 8 Detailed description of an embryo at 15 dpf at the end of the O5 period. a Whole embryo. Black lines represent the location of transverse sections shown in c, e, f. b Sagittal sections of the head. c Section of the head. d Sagittal section of the eye. The arrowhead shows the visual cells. e
Section of basis of the head. f Section of the trunk. g Sagittal section of heart. Ac macrine cells, At atrium, Avv atrioventricular valve, Babulbus arte-riosus, Bas basihyal, Cband stars ceratobranchial arch, Bc bipolar cells, C cartilages, Cm choroïdal melanocytes, E eyes, En Encephalon, Es esophagus,
Etp ethmoïd plate, Ff finfold, For forebrain, Gm gray matter, H heart, Hin hindbrain, Hyo hyosymplectic, Ie inner ear, Int intestine, Ip inner plexiform, L
lens, Ld lipid droplet, Mes mesencephalon, Mid midbrain, Myo myotome, Nt notochord, Onl outer nuclear layer, Op outer plexiform, Ot otoliths, Pal
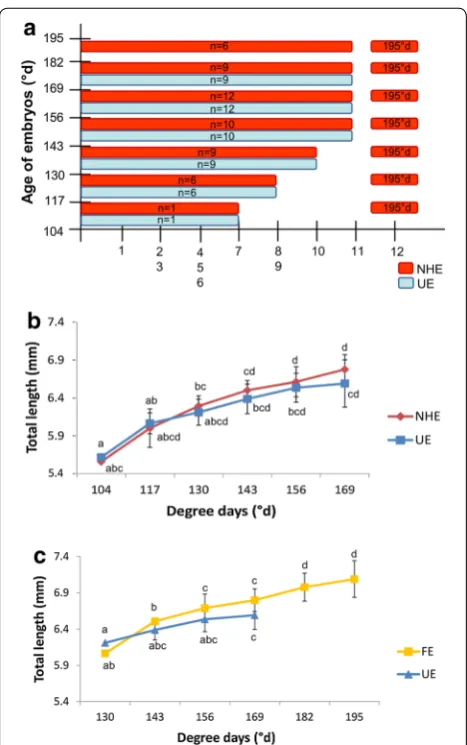
took place at one particular moment (15 dpf) in every spawn. In order to determine whether there was a differ-ence of development between newly hatched embryos and their not yet hatched counterparts we performed a comparison on four independent spawn. The hatch-ing period lasts for 5 days (65°d) for each spawn. Each day of hatching, embryos that newly hatched (NHE) were sampled and observed to determine their stage of development. This stage was compared to the unhatched embryos (UE) of the same spawn (Fig. 10a). It appeared that embryos that hatched naturally didn’t present any difference in term of progression in the embryogenesis compared to their unhatched counterparts at the same age. Moreover, their mean size was not significantly dif-ferent from unhatched embryos (Fig. 10b). Interestingly, this experiment shows that at the spawn level, the hatch-ing period can last for several days and that embryos can hatch with various abilities. These data strongly sup-port that embryos can reach various stages before their moment of hatching. In addition, in this experiment again, all embryos begun to eat at 15 dpf (195°d), what-ever their hatching date. In these conditions, the first oral feeding may rather represents the embryonic-to-larval transition because they always occur at the same devel-opmental stage.
To go further, we measured the size of each naturally free embryo (FE) from their hatching to the first oral feeding. We compared these sizes to those of embryos of the same age and the same spawn that were removed from gangue with forceps (UE) (Fig. 10c). Data show no significant differences between FE and UE embryos at a particular date. The only significant difference was obtained between sizes of embryos at various ages, showing a similar growth whatever if they hatched or remained in the gangue. These data suggest that there is no difference in the growth rate depending on living environment (still in the egg or free in the water).
Description of the eyes development
The eyes are the first visible sign of cellular differentia-tion and develop from O1 to O3 stages. First, the optic capsules develop symmetrically on the embryo’s head (Fig. 3j) and soon after, the crystalline lenses appear from the 4th dpf (Fig. 4a) in the same time than the marginal zone. From 5 dpf, the outer nuclear layer appears in the optic capsule. Five different cell layers are observed from day six post-fertilization as illustrated on histological section of 7 dpf embryos (Fig. 5c). From this stage, the ganglion cells layer is the most inner layer of the eyes and the inner plexiform contains several rounded cells sibling amacrine and ganglion cells. The two cell types of the inner nuclear layer, amacrine and bipolar cells, are not yet differentiated while the visual cell layer is a light staining
and composed of photoreceptor precursors. The outer nuclear layer consists of a row of dark-staining columnar cells (Fig. 5c). The 7th dpf, the eye’s pigmentation begins with a thin layer of black cells on the outer of optic cups (Fig. 5c, arrowhead). This pigmentation is not clearly vis-ible on all histological sections or in living embryos. The optic nerves are developed at the same stage (Fig. 5c) and form a chiasm between the optic cups, under the hypo-thalamic, part of the diencephalon and more visible at 9 dpf (Fig. 6b).
From 8 dpf, the eyes diameter measures around 312 ± 16 µm (n = 16) and a new external layer of cells appears definitively in the eyes: the retinal pigmented epithelium with choroïdal melanocytes that lend a black pigmentation to the eyes (Fig. 6b). This dark pigmenta-tion is visible on living embryos macroscopically (Fig. 4c) and marks the beginning of the eyed stage. Moreover, the outer plexiform layer forms a thin cover between the outer nuclear layer and the bipolar cells. At high magni-fication, on 11 dpf histological sections, cones and outer segment of cones are observed in visual cell layer of eyes. From 15 dpf, the structure of the retina is clearly discern-ible (Fig. 8d). In addition, a layer of chondrocytes forms a ring around each eye (Fig. 8d).
Description of the digestive system ontogeny
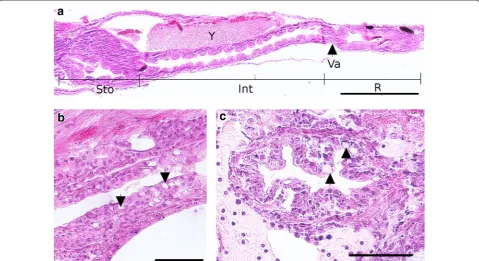
The digestive tube is first visible from 4 dpf. It takes place dorsally to the yolk with a simple digestive tube composed of an undifferentiated epithelium. This intestine anlage already exhibits a lumen. From the 7th dpf, several organs associated with the digestive system begin to appear as the liver and the pancreas, which are close to the intestine (Fig. 5g). This differ-entiation marks the O2 to O3 transition. In the mean-time, the esophagus also differentiates. The digestive tract is now a long tube localized in the left side of embryo. Its epithelium is composed of a monolayer of tall and aligned thin enterocytes with brush border at the apex (Fig. 9e). The pharynx and the gall bladder appear at the 8th dpf even if the gall bladder becomes more obvious at the end of embryonic period, between the lipid droplet and the pancreas, with a very thin wall (Fig. 9d). In the meantime, a yellow substance begins to be secreted and leaks in the posterior intes-tine until 11 dpf.
First peristaltic movements are visible at 10 dpf in the posterior part of the intestine whereas the same phenom-enon is observed in the anterior part of the intestine at 14 dpf. In the same time, the mouth opens (Fig. 4d). It marks the transition from O3 to O4 stages. At 11 dpf, the liver is composed of hepatocytes with large central nuclei and the intestine mucosa appears folded, in order to increase its surface area (Fig. 7f). All the organs involved in the digestive function take place on the left side of embryo. For the first time in the embryogenesis, a new organization appears in esophagus with many epithelial folds and the differentiation of goblet cells (Fig. 11b). The swim bladder presents various cells types: on the dorsal side, small cells forming the wall of the oval structure and on the ventral side, tall cells that confer a large aspect of the wall (Fig. 7g). It is surrounded by mesenchymal cells forming a fibrous lining (also described by Chevey [32]). At that stage, the anus opens.
A dark pigmentation begins to develop on the dorsal part of the swim bladder at 12 dpf, and is easily observ-able at 15th dpf on living embryos (Fig. 9a) and histologi-cal sections (Fig. 9c, d). The esophagus is situated above the heart and contains many folds in the mucosa and the goblet cells (Figs. 8f, 10b, c). The digestive tract is divided into three main parts: (i) the future stomach separated from the intestine by a sphincter, (ii) the anterior intestine and (iii) the posterior intestine also called rectum. This subdivision is observable on coronal or sagittal sections as in the Fig. 11a. The anterior and posterior segments of the intestine have different lengths (the first part is longer than the second one, 596.1 ± 20.2 and 244.7 ± 14.2 µm, respectively) and are separated by a constriction called ileorectal valve (Fig. 9b). Anterior and posterior intestines have different morphological organizations which could be explained by folds in the wall (Fig. 11a). Indeed, in sev-eral teleost species, the anterior region of gastrointesti-nal tract possesses primary and secondary folds (Fig. 9c) whereas the rectum presents a change on mucosal folding pattern. The epithelial layer of the gut is composed of thin and elongated enterocytes with an absorptive function, surrounded by a muscular layer and, in the center of the tract, the lumen (Fig. 9e). The brush border of the entero-cytes increases again the intestinal absorption surface. At 15 dpf, the digestive glands are fully differentiated. The pancreas (Fig. 9d) includes two distinct glandular systems
(endocrine and exocrine), and the liver is positioned ventrally to the pancreas and closely linked to the yolk. Between these two glands, the gall bladder is observed (Fig. 9d).
Discussion
Establishment of the developmental table of the Eurasian perch
The present work first aims at describing accurately the Eurasian perch development. Data show that its timing can present variations preventing to follow a strict devel-opmental table as those proposed for fish model spe-cies [1, 5, 6]. Moreover, the hatching period elapsed for several days and individuals did not hatch at the same developmental stage while the first oral feeding occurred at the same time for every embryo. In that context, we choose to determine an alternative method to describe perch development that is flexible enough to take into account this variability while being rather precise to describe accurately the development. Descriptions of steps and thresholds as defined by Balon [9] allow high flexibility but lack sometimes accuracy, especially during the early stages. We, thus, decided to use this model to describe perch development while defining more accu-rate stages in the beginning of the embryogenesis. First periods have been defined according to the cellular sta-tus (division, migration or differentiation). In a second time, thresholds were established thanks to the acquisi-tion of new abilities, defining in the mean time steps that were carefully described. Some thresholds were estab-lished according to previous work on other percids [8, 39–46], while others were defined to improve the devel-opmental table and thus add accuracy to the description. Such developmental table not only allows an easier com-parison between individuals within a species, but also, between fish species by translating the time scale into a degree day scale. The main description of perch embry-ogenesis with the definition of steps and an accurate description of the first observation of each organ is sum-marized in the Fig. 12. As a whole, the total embryogen-esis duration elapses for 15 days at 13 °C (195°d) from the fertilization to the first oral feeding. It is comparable to the yellow perch (185.6°d [48]). Other percids exhibit shorter or longer development from activation to the first oral feeding (Table 3).
(See figure on previous page.)
Fig. 9 Detailed description of an embryo at 15 dpf at the end of the O5 period. a Whole embryo. Black lines represent the location of transverse sections shown in c and f. b Sagittal section of the anterior part of the embryo. C Section of the trunk. d Glands belonging to the digestive system.
e Sagittal section of rectum. f Transverse section of the tail. Bb brush border, E eyes, En encephalon, Enp endocrine part of the pancreas, Exp exocrine part of the pancreas, Ff finfold, For forebrain, Gb gall bladder, Gm gray matter, H heart, Hin hindbrain, Int intestine, Ld lipid droplet, Li liver, Lu lumen,
M mouth, Mel melanophores, Mid midbrain, Ml muscle layer, Myo myotome, Nt notochord, Ot otoliths, Pa pancreas, R rectum, Sb swim bladder, Ub
The zygote period
The zygote step corresponds to the egg hardening and the formation of the perivitelline space and the blas-todisc. The lipid reserves are separated into two inde-pendent parts, the yolk and the lipid droplet also called oil globule as described for all percid species and some other non percid fish. But the presence of this droplet is not general for every fish species. It has been shown in the walleye that both compartments are composed of different lipids. Indeed the yolk is mainly composed of lipoproteins and polar lipids (e.g., phosphatidylcholine and phosphatidylethanolamine), the oil globule is com-posed by neutral lipids, mainly triacylglycerols (TAG) [49]. Moreover, Wiegand et al. [50] noticed that the yolk is used predominantly during early embryogenesis while the lipid reserves in the droplet are used later during the embryogenesis.
The cell cleavage period
After 2.5 h (1.4°d), the cell cleavage period begins. This step never occurs when ova were not incubated with sperm and thus not fertilized (data not shown) on the contrary to other species as the herring or the stickleback for which unfertilized eggs can undergo cell cleavage [51]. The total duration of both zygote and cell cleavage peri-ods are comparable to the rainbow darter and the wall-eye [8, 46] (Table 3) and last for about 24 h (13°d) for the perch. The control of the cell cleavage doesn’t seem to be only dependent upon the water temperature as the Zingel streber cell cleavage lasts for 12 h at a mean temperature of 15 °C (7.7°d) [44] which is in the same range of temper-ature than the one of the Eurasian perch. In every case, the cleavage is meroblastic due to a large yolk quantity, which remains uncleaved [52] and begins with a bilateral arrangement of the blastomeres with a regular cleavage pattern, as in other fish species [1–3, 6]. Nevertheless, after several divisions irregularities always occur in the division planes but the onset of this phenomenon was dif-ferent for every species. In the present study, we noticed it at the 32 cells stage as for the sea bass and the medaka [1, 3]. In contrast, Chevey [32] reported it from 16 cells stage in P. fluviatilis as it is the case for the walleye [8] and it was even earlier for the logperch (eight cells) [45]. These irregularities could precede defects in the synchro-nization of the cell divisions as reported in zebrafish, for which both process appears from 128 cells stage [6]. The transition between synchronous and asynchronous cell divisions could correspond to the mid-blastula transition (MBT) which is characterized by the loss of synchronous cell division, cell motility, lengthening of cell cycles and the onset of zygotic transcription [53, 54]. In the present study, the cell division asynchrony also begins from 128 blastomere stage. We propose to subdivide the cleavage Fig. 10 Comparison of the developmental process between free and
embedded embryos. a Comparison of the developmental progress of newly hatched embryos (NHE) and unhatched embryos that still remain in the envelope (UE) at the same age. Twelve criteria were evaluated at the date of hatching. Observations have been done on embryos from four spawn, n correspond to the total number of embryos that hatched at a particular date and were used for this study. One embryo from one spawn begun to hatch at 8 dpf, while the others begun at 9 or at 11 dpf. Numbers correspond to the criteria as follows: 1 circulation in the yolk,
2 embryo straightening, 3 urinary bladder, 4 eye pigmentation, 5 ventral circulation, 6 bile, 7 melanophores on the body, 8 peristaltic undulations,
9 mouth open, 10 coordinated pectoral fins movement, 11 jaw move-ments and 12 first oral feeding. b The total length of newly hatched embryos (NHE) were measured and compared to the ones of embryos of the same age that remained in the envelope (UE) (n= 3 group UE or NHE/date of hatching/spawn, three spawn were used). Data correspond to the mean value of the three different spawns ± SD. Significant differences were observed according to the hatching date (different letters) but not the status hatched or unhatched embryos p < 0.05. c
cell period into two steps, (CC1 synchronous cell division and CC2 asynchronous cell divisions). This subdivision could not be properly established in other percids devel-opmental tables because the description of cell cleavage was not accurate enough (Table 3).
The gastrulation period
The gastrulation period starts the second day post-fer-tilization with the first cell movements along the yolk, and lasts for about 26 h at 13 ± 0.5 °C unlike to Chevey
[32] who described the gastrulation duration of 55–60 h. This huge difference is surprising and we do not have any plausible explanation. Nevertheless, our data were reproducible in every spawn whatever the spawning sea-son and the origin of breeders and are related to those obtained with other percids (Table 3) suggesting that we may probably be closer to the reality. After the cell cleavage, several cell layers could be seen among which the yolk syncytial layer (YSL) situated between the yolk and blastomeres and characterized by a multinucleate layer, continuous with the yolk cytoplasmic layer. We observed it until 15 dpf indicating that it may have a role in the nutrient absorption all along the embryonic devel-opment. In addition, the YSL plays an active role during gastrulation as it gives most of the contractile force dur-ing the epiboly [52]. The embryonic shield is visible from
50 % epiboly as described in medaka and zebrafish [1, 6]. In Etheostoma species belonging to the percids, the germ ring and the embryonic shield formation occurs early at 25 % of epiboly [55]. Moreover, this timing seems to be crucial because premature or delayed involution may lead to embryonic lethality [55]. Kimmel et al. [6] noticed a pause during the zebrafish development. In our study, this arrest is not observed but a change in the velocity of the cellular front advancement can be observed from 70 % epiboly with deceleration of the blastoderm margin progression. This delay could be linked to the oil drop-let covering by the embryo. Mc Elmann and Balon [8] have described in the walleye a progressive rotation of the embryos while the cellular layer was covering the oil droplet. This phenomenon occurs potentially because of a variation of the cell velocity between the ventral and the dorsal part of the embryo as observed in the zebrafish [6]. This rotation was described not only for the walleye but also in the northern logperch [45] but not in darters [46, 55] or in the Gymnocephalus species [43]. In the pre-sent study, in most cases we didn’t observe such rotation (only once among the embryos we observed). We rather observed a very fast covering of the oil droplet as if ten-sions were accumulated before this covering and released quickly (Additional file 3). This tension may be due to the deceleration previously described. We propose to Fig. 11 Detailed description of the digestive system at 15 dpf. a Coronal section of the trunk presenting all the gut. Sto stomach, Int intestine, R
Table
3
C
omparison of the de
velopmen
tal of the E
ur
asian p
er
ch with other p
er
cid fish
Each fish species r
epr
esen
t each family of per
cid
. T
hey w
er
e chosen because the descr
iption of their dev
elopmen
t is cur
ren
tly the most ac
cur
at
e among their family
. I
nt
er
vals onsets or dur
ations ar
e g
iv
en in deg
ree da
ys
(number of da
ys × temper atur e) Scien tific name Co m ‑
mon name
A
dult size (cm)
Spa
wn
‑
ing substr
a‑
tum
Incuba
‑
tion temper
‑ atur e (°C ) Repr o‑ duc tiv e season Egg siz e (mm)
Total embr
y‑
onic dur
a‑
tion
CC1 onset CC2 onset G1 onset G2 onset O1 onset O2 onset O3 onset O4 onset O5 onset
Siz e a t ha tching (mm) H atc h‑
ing dur
a‑ tion Lar val siz e
(first feeding) (mm)
Ref er ‑ enc es Etheostoma Etheos
-toma caer
-uleum Rainbo w dar ter 5.3 Bur
ried in the sub- strat
20 Spr ing 1.9–2.2 243.9 1.4 nd 17.4 nd 25.1 43.4 85 120 180 8 20 9.6 [ 46 ] G ymnoc ephalus G ymno
-cephalus cernuus
Ruff e 12 D emer -sal 16–23 Ear
ly sum
-mer 1 154.1 3.4 nd nd nd 18.7 35.7 80.9 134.6 nd 3.5–3.8 42.7 4.4–4.9 [ 41 , 47 ] Pe rc a Per ca flu -viatilis
Eurasian per
ch
25
Fix
ed on plants or stones
13
Ear
ly spring
1.75 195 1.4 3.9 13 16.9 27.1 52 91 130 143 5 65 6 This w or k Per cina Per
cina capr
odes
Lo
g- perch
12.5
Bur
ried in the sub- strat
20
Lat
e spring
1.23 164.4 1.3 nd nd nd 19.9 41.5 51.5 156 nd 6.2 10.6 6.2 [ 39 , 45 ] Sander Stiz oste
-dion vitr
eum W alle ye 54 D emer -sal 15 Ear
ly spring
1.85 236.3 1.6 nd 16.4 nd 28.9 52 nd 153.6 nd 6.8–7.3 67.5 9–9.7 [ 8 , 47 ]
Zingel Zingel str
eber
Danube str
eber
12
Bur
ried in the sub- strat
12–17
Ear
ly spring
subdivide the gastrulation thanks to cell velocity (G1 as the rapid cell movements and G2 from the deceleration).
The organogenesis period
The boundaries between the gastrulation and the organo-genesis are not always clear because organoorgano-genesis can be triggered before the tailbud closure as it is the case for
Perca fluviatilis (Fig. 12) or other percid fish species as E.
caeruleum [46]. In addition, it is clear that organogenesis
will continue at least until the juvenile stage. We never-theless choose to name the next period organogenesis in order to make the occasion to describe the beginning of the cell differentiation. The definition of thresholds took into account the acquisition of abilities for several functions/systems as the locomotion system (including fins, muscles and skeleton), the nervous system (central and peripheral including sensory organs), the circulation system (heart and vessels), the feeding/excreting system (including all organs associated to the digestive function and the kidneys), the respiratory system (mainly gills). Naturally, other systems as for example, the reproduc-tive or the immune systems are important for the indi-viduals but either their development will occur later (reproduction) or we did not identify any specific organs (e.g., spleen) with the techniques used in this work. As a whole, the organogenesis begins with the optic vesicle apparition 2 dpf (27.1°d). During this phase, the embry-onic size varies from 5.32 mm ± 0.23 to 6.28 mm ± 0.22 as previously observed in Perca fluviatilis and Perca
fla-vescens [32, 48].
One of the first organs to be visible is the transient Kupffer’s vesicle. It was described in 1868, and appears as a conserved structure among teleost fishes. This spheri-cal and ciliated organ is lospheri-calized in the posterior part of the embryo ventrally to the notochord. It plays a role in left–right development of the brain, heart and gut in Zebrafish embryo [56]. In addition, Kimmel et al. [6] sug-gest that cells lining the Kupffer’s vesicle may be respon-sible of formation of tail mesodermal derivatives as the notochord and muscles. Other tissues as somites, the central nervous system or the notochord then progres-sively appear (Fig. 12). During the process, it has been reported in the walleye, [8], that the embryonic body rotate around the yolk to move the head closer to the oil droplet. They called this movement the translocation. In the present study, we also observed a translocation of the embryo. Up to now it corresponds to the second obser-vation among percids. At 4 dpf, the heart is visible and begins to beat. However, no liquid was already circulat-ing. Burggren [57] suggested that the heart begins to beat to improve its morphogenesis, for convective blood flow and angiogenesis whereas nutrients and respiratory gases could be delivered by passive diffusion during the early
life of the embryos. In addition, these first beatings are concomitant with the first spontaneous skeletal muscle contractions. It suggests that the smooth muscle cells of the heart and striated muscle cells of the somites undergo parallel development even if the heart differentiation is not distinguishable before. We propose that this step cor-responds to a threshold according the saltatory theory. We then call this first step from the eye differentiation and first muscle contraction (body and heart) O1 for organogenesis 1.
A new step that we called O2 then begins until 7 dpf when organs associated to the digestive system appear. During that stage, the eyes are almost fully developed and several layers are distinguishable. A cartilage and an epithelium form the cornea and give a mechanical pro-tection to the eyes. Just behind this cell layer the visual cells composed by photoreceptors take place. These cells are involved in the light perception and transmission. It exists two categories of photoreceptors, the cones ena-bling the fish to improve their perception of the preys and the rods, appearing later, and rather involved in light sensitivity of the fish (e.g., perception of a shadow com-ing from the surface) [58]. The full development of these cells usually allows the embryo to obtain their full visual acuity [58]. They form synapses with interneurons in the outer plexiform and their nuclei compose the outer nuclear layer. However, in the perch the outer plexiform layer is not yet visible suggesting that the neuronal con-nections are not yet possible and that the embryo is still blind. Interneurons are bipolar cells that make the link between photoreceptors and the ganglion cells. There nuclei take place in the inner nuclear layer and they form synapses with the ganglion cells in the inner plexiform [59]. Amacrine cells appear in the same layers and par-ticipate to the signal processing of the visual stimuli at the level of the bipolar/ganglion cells synapses. The gan-glion cells allow the connection between retina and optic tectum belonging to the mesencephalon [59]. The retina corresponds to the whole cell layers from the melano-cytes to the ganglion cells. From 7 dpf, the optic nerve forms a chiasm between the optic cups and continue into the opposite brain hemisphere [59]. Other organs further develop during the O2 step as the circulation system with the liquid circulation that begins in the vessels 2 days later (6 dpf). Several sinuses progressively appear on the yolk (Additional file 4), suggesting that this liquid mainly transport nutrients in the embryonic body.