R E S E A R C H
Open Access
Metabolic requirements for cancer cell
proliferation
Mark A. Keibler
1, Thomas M. Wasylenko
1,3, Joanne K. Kelleher
1, Othon Iliopoulos
4,5,
Matthew G. Vander Heiden
2and Gregory Stephanopoulos
1*Abstract
Background:The study of cancer metabolism has been largely dedicated to exploring the hypothesis that oncogenic transformation rewires cellular metabolism to sustain elevated rates of growth and division. Intense examination of tumors and cancer cell lines has confirmed that many cancer-associated metabolic phenotypes allow robust growth and survival; however, little attention has been given to explicitly identifying the biochemical requirements for cell proliferation in a rigorous manner in the context of cancer metabolism.
Results:Using a well-studied hybridoma line as a model, we comprehensively and quantitatively enumerate the metabolic requirements for generating new biomass in mammalian cells; this indicated a large biosynthetic requirement for ATP, NADPH, NAD+, acetyl-CoA, and amino acids. Extension of this approach to serine/glycine and glutamine metabolic pathways suggested lower limits on serine and glycine catabolism to supply one-carbon unit synthesis and significant availability of glutamine-derived carbon for biosynthesis resulting from nitrogen demands alone, respectively. We integrated our biomass composition results into a flux balance analysis model, placing upper bounds on mitochondrial NADH oxidation to simulate metformin treatment; these simulations reproduced several empirically observed metabolic phenotypes, including increased reductive isocitrate dehydrogenase flux.
Conclusions:Our analysis clarifies the differential needs for central carbon metabolism precursors, glutamine-derived nitrogen, and cofactors such as ATP, NADPH, and NAD+, while also providing justification for various extracellular nutrient uptake behaviors observed in tumors. Collectively, these results demonstrate how stoichiometric
considerations alone can successfully predict empirically observed phenotypes and provide insight into biochemical dynamics that underlie responses to metabolic perturbations.
Keywords:Cancer metabolism, Proliferation, Biosynthesis, Anabolism, Stoichiometric analysis, Metabolic modeling
Background
Many parallels exist between the metabolic profiles of cancer cells and normal proliferating cells, including the use of aerobic glycolysis, selective expression of metabolic enzymes with distinct regulatory features, and elevation of amino acid consumption and biosynthesis [1–6]. Growing tumors, like any actively dividing tissue, must continu-ously generate the precursors for macromolecule synthe-sis, and if the biomass composition is known, it is possible to determine the minimum rates at which corresponding anabolic substrates must be provided to maintain a speci-fied growth rate. However, unlike many microorganisms,
which are capable of synthesizing the entirety of their bio-mass from a single carbon source and a limited number of salts [7], mammalian cells depend on a complex medium comprised of numerous essential carbon and nitrogen sources [8, 9]. Furthermore, many cancer cells, at least when grown in culture, require a number of nominally nonessential substrates to proliferate (e.g., glutamine and serine), making them conditionally essential for growth [10–13]. Therefore, in culture and also likely in vivo, can-cer cells use a variety of nutrients to generate the mono-mer components of macromolecules, which significantly complicates analysis of their metabolic pathways.
A central aim of the field of cancer metabolism is to identify metabolic pathways selectively activated in tumor cells, which likely include crucial biosynthetic pathways, to reveal therapeutic targets [14, 15]. To accomplish this * Correspondence:gregstep@mit.edu
1Department of Chemical Engineering, Massachusetts Institute of Technology, Cambridge, MA 02139, USA
Full list of author information is available at the end of the article
task, it is necessary to quantify differences in metabolic flux between transformed cells and their differentiated tis-sues of origin. This can be achieved by direct examination of individual metabolite measurements (e.g., assessing changes in extracellular metabolite concentrations in cul-ture media to calculate consumption and production fluxes; evaluating metabolite pool sizes and enrichments from isotope tracers to indirectly estimate intracellular fluxes [16–18]) or with sophisticated computational ap-proaches in which experimental measurements are incor-porated into a data-fitting model to compute a global representation of metabolic behavior (e.g., incorporating extracellular flux and intracellular metabolite isotope la-beling data to perform metabolic flux analysis; simulating fluxes in a genome-scale metabolic model constrained by transcriptomic and proteomic data) [19, 20]. However, all of these techniques rely heavily on challenging experimen-tal measurements to infer metabolic trends.
In this investigation, we use fundamental stoichiometric and mass-balance principles to gain insight into the meta-bolic behavior of cancer cells using only minimal information about their proliferative needs. Previous in-vestigations have similarly used minimal stoichiometric models to explore the effects of using a variety of objective functions on metabolic phenotype, the sensitivity of growth rate and other fluxes to perturbations, and the consistency between these in silico predictions and empir-ical measurements in a mammalian cell line [21, 22]. Our approach, however, is modeled on more elementary ana-lyses of microbial systems, in which biomass measure-ments are used to enumerate the corresponding costs in terms of precursors and cofactors [7]. Starting with the well-characterized biochemical composition of hybridoma cells as a model [23], we first give a comprehensive de-scription of all major anabolic requirements for prolifera-tion. Next, using these tabulated requirements as a basis, we perform stoichiometric analyses to identify consequent implications for one-carbon metabolism and glutamine uptake. Finally, we demonstrate how a limited flux balance analysis network can recapitulate observed metabolic be-havior with a model for metformin treatment, enabling prediction of cell phenotypes in conditions relevant to cancer through solely stoichiometric principles.
Methods
Biomass requirements
Weight analysis of biomass composition
Mammalian cell biomass composition was taken from a study that compiled multiple sources of hybridoma bio-mass composition measurements in the literature [23]. Biomass macromolecules accounted for 962 mg per g dry cell weight (DCW), and this macromolecule fraction was decomposed into its elementary components on a mass basis (Table 1; see Additional file 1: Tables S1–S3
for component masses of each biomass element).“ Essen-tial” substrates required for direct extracellular uptake were identified; their weight contributions were consoli-dated, and their sum was excluded from additional ana-lysis. The remaining “nonessential” components were then decomposed into the anabolic precursors from which they are derived. Eight intermediates in central carbon metabolism where major catabolic pathways di-verge into anabolism were designated as carbon sources: glucose 6-phosphate (G6P), ribose 5-phosphate (R5P), di-hydroxyacetone phosphate (DHAP), 3-phosphoglycerate (3PG), pyruvate (Pyr), acetyl-coenzyme A (AcCoA), α -ketoglutarate (αKG), and oxaloacetate (Oaa) (Fig. 1) [7, 24]. Nitrogen, phosphorus, and sulfur sources were denoted as NH3, PO4, and SH, respectively, and the“additional” cat-egory represents the contributions of additional inorganic substrates (e.g., water, O2, CO2) and hydride groups from reduced cofactors. The total mass contribution of each precursor to every macromolecular component was deter-mined (Additional file 1: Tables S1–S3), and these contri-butions were then scaled by the molar quantities in the given biomass composition to give masses of each per g DCW (Table 1). The “accounted DCW” calculation nor-malizes DCW percentage values by 962 mg to represent the fractional contribution of each precursor to all compo-nents of biomass accounted for by macromolecules. Like-wise, the “nonessential component DCW” calculation normalized DCW percentage values by 534 mg, the weight of macromolecular biomass that can be synthe-sized de novo.
Table 1Composition of 1 g DCW on a precursor mass basis, calculated from hybridoma biomass measurements
Component Weight per gDCW(mg)
DCW (%) Accounted DCW (%)
Nonessential component DCW (%)
Essential 428 42.8 44.6 –
G6P 47 4.7 4.9 8.8
R5P 26 2.6 2.7 4.9
DHAP 10 1.0 1.1 1.9
3PG 67 6.7 7.0 12.6
Pyr 33 3.3 3.4 6.1
AcCoA 66 6.6 6.9 12.4
Oaa 64 6.4 6.6 12.0
aKG 99 9.9 10.3 18.6
NH3 73 7.3 7.6 13.8
SH 5 0.5 0.5 0.9
PO3 28 2.8 2.9 5.3
Additional 14 1.4 1.5 2.6
Total 962 96.2 100 100
Precursor and cofactor demands
Using the composition of hybridoma cells retrieved from the literature as a basis [23] and scaling by the stoichio-metric coefficients in anabolic reactions (Additional file 1: Tables S4–S7 and Supplementary Notes) [8, 25, 26], the molar demands for de novo biomass synthesis were also calculated in units of mmol/gDCW(Table 2). Precursor de-mands include the eight previously outlined central car-bon metabolism intermediates, one-carcar-bon units, and amine groups. Cofactor demands include ATP, NAD+, and NADPH. Additionally, molecular oxygen (O2) was in-cluded. The demands for complete biosynthesis of all non-essential components (i.e., only non-essential substrates are consumed from the extracellular environment) are listed under the“Synthesis”header. Additionally, these demands were modified to consider the scenario in which nones-sential amino acids (NEAAs) and fatty acids (FAs) are consumed from the surrounding medium, with the results listed under the “Uptake” header. (Essential fatty acids such as linoleic and linolenic acids were not explicitly dis-tinguished in the source literature [23] and are therefore not considered separately here.)
We did not incorporate the burden of free ATP when calculating precursor and cofactor demands. Assuming an intracellular concentration of ATP of 4.7 mM [27], a cell volume of 1500 fL [28], and a per-cell dry weight of 360 pg [29] leads to an estimate of 0.0019 mmol free ATP/gDCWthat must be synthesized. The corresponding
Fig. 1Simplified schematic of central carbon metabolism.Rectangular boxescontain branchpoint metabolite intermediates, androunded rectangular boxescontain amino acid and fatty acid products that can be incorporated into biomass macromolecules.Arrowsindicate carbon flux. Additional metabolic intermediates are not shown; instead, they are implicitly lumped into pools with displayed metabolites (e.g., fructose 6-phosphate with G6P)
Table 2Molar precursor and cofactor demands for producing nonessential biomass components
Precursor/ cofactor
Cellular biosynthesis requirements
Synthesis of nonessential components
Uptake of nonessential components
mmol/gDCW fmol/cell a
mmol/gDCW fmol/cell a
G6P 0.289 104 0.289 104
R5P 0.233 83.8 0.233 83.8
DHAP 0.119 42.8 0.119 42.8
3PG 1.24 448 0 0
Pyr 0.600 216 0 0
AcCoA 2.46 893 0.324 117
Oaa 0.760 274 0 0
aKG 1.02 368 0 0
1C 0.255 91.8 0.255 91.8
Nitrogen 4.89 1.76 × 10³ 0.891 321
O2 0.387 139 0.198 71.3
NAD+ 1.19 428 0.0654 23.5
NADPH 5.21 1.88 × 10³ 0.607 219
ATP 36.0 1.30 × 10⁴ 32.1 1.16 × 10⁴
Demands are shown for two separate cases: (1) where all nonessential amino acids and fatty acids are synthesized de novo and (2) where all nonessential amino acids and fatty acids are taken up from the medium. Entries that are identical between the cases indicate that cells cannot substitute nutrient consumption for biosynthesis. Entries that are smaller in“Uptake”than“Synthesis”
indicate that cells can substitute nutrient uptake for biosynthesis (by a quantity equal to the difference)
a
contribution amounts to an addition of roughly 1.5 % to the least abundant quantity (1C) and less than 1 % for other associated components (e.g., R5P, 3PG, nitrogen) in the “Synthesis” regime (Table 2), and we considered these values to be sufficiently small to neglect.
Serine, glycine, and one-carbon units
The total serine, glycine, and one-carbon (1C) unit de-mands per gram DCW were determined by combining the demands for all biomass components for which they serve as substrates (Table 3). 1C units were assumed to be synthesized either from serine catabolism through serine hydroxymethyltransferase (SHMT) or glycine ca-tabolism through the glycine cleavage system (GCS); each pathway was considered separately as the sole source for 1C units, and production through SHMT (GCS) was added to the total demand for serine (glycine). The de-mands for serine-, glycine-, and 1C-associated biomass (Table 3) were subsequently normalized by total(serine/ glycine + 1C) serine or glycine demand to give the frac-tional fate of each amino acid when it serves as the sole source for 1C units (Table 4). Glutathione, which is present at millimolar quantities inside the cell [27], also requires glycine for its synthesis [8]; however, we assumed that, since the original measurements that served as the basis for the tabulated hybridoma composition relied on quantification of total protein levels per cell and protein hydrolysis to give the distribution of amino acids [23, 30], glutathione, as a peptide, has been implicitly considered as proteinogenic glycine.
Carbon, nitrogen, and glutamine demands
The total cellular carbon and nitrogen molar demands were determined by taking the cumulative sum of all biomass components (mmol/gDCW) scaled by their cor-responding numbers of carbon and nitrogen atoms, re-spectively (Table 5 and Additional file 1: Table S8) [23]. Essential demands were determined by taking the cumu-lative sum of all components that cannot be synthesized
de novo (essential amino acids, choline, and ethanol-amine). Nonessential carbon and nitrogen demands were determined by subtracting the essential demands from the total demands.
Our analysis assumes that glutamine must be taken up from the media. Glutamine is expected to serve as the primary nitrogen source for macromolecules synthesized de novo [8, 31, 32], and three different regimes of obtaining nitrogenous biomass were considered: (1) a maximumuptake profile, where glutamine was assumed to serve as the sole source of nitrogen for synthesizing nonessential molecules; (2) a minimum uptake profile, where glutamine was assumed to be consumed only for reactions in which other nitrogen-containing com-pounds cannot serve as substrates (i.e., proteinogenic glutamine and reactions that consume the amide-amine group); and (3) apredicteduptake profile, where glutam-ine consumption is determglutam-ined from a simulated stoi-chiometric network of cells cultured in Dulbecco’s modified Eagle medium (DMEM) (Table 5). For each uptake profile, carbon and nitrogen contributions were calculated by scaling the glutamine consumed by its cor-responding number of carbon and nitrogen atoms (five and two, respectively; Additional file 1: Table S8). For each regime, the carbon (nitrogen) contribution from glutamine was divided by the total and nonessential cel-lular carbon (nitrogen) demands calculated previously to give the fractions of total and nonessential carbon (nitro-gen) in biomass predicted to be derived from glutamine (Table 5).
Flux balance analysis Problem formulation
Flux balance analysis (FBA) [33, 34] was used to gener-ate optimal metabolic flux distributions that maximize growth yield and satisfy stoichiometric constraints on growth. A metabolic model, consisting of 168 metabo-lites comprising a set ℳ= {1,…, 168} and 152 reactions comprising a set N ¼f1;…;152g; was used to generate a 168 × 152 stoichiometric matrix. The reactions cover major catabolic and anabolic pathways including glycoly-sis, the pentose phosphate pathway (PPP), the TCA cycle, the electron transport chain (ETC), one-carbon Table 3Molar requirements of serine, glycine, and one-carbon
units for biomass production
Substrate Fate mmol/gDCW
Serine Protein 0.43
Lipid 0.011
Total 0.441
Glycine Protein 0.538
Nucleotide 0.1201
Total 0.6581
One carbon Nucleotide 0.255
Cholesterol Byproduct −0.018
Total 0.237
Table 4Fates of serine and glycine
Biomass fate Biosynthetic pathway
SHMT GCS
Serine 0.65 –
Glycine – 0.74
One carbon 0.35 0.26
metabolism, and de novo synthesis of all major macromol-ecular constituents heretofore considered (Additional file 1: Tables S9, S10). The model is further compart-mentalized into mitochondrial and cytosolic pools for me-tabolites known to engage in distinctly different behavior in each (e.g., cofactors, TCA cycle intermediates), and re-actions constituting the malate-aspartate shuttle were in-cluded to enable intercompartmental transport of redox species.
This network was incorporated into the following lin-ear programming (LP) problem:
min
v Z
where
Z¼X
N
n¼1
cnvn
subject to:
S⋅v⇀¼ b ⇀
bm¼0; ∀m∈ℳintr
bm∈ℝ; ∀m∈ℳextr
vn≥0; ∀n∈Nirrev
vn∈ℝ; ∀n∈Nrev
whereN= 152 is the total number of reactions,ℳintris the set of all intracellular metabolites,ℳextris the set of all extracellular metabolites, Nirrev is the set of all irre-versible metabolic reactions, andNrev is the set of all re-versible metabolic reactions.
The first constraint is a mass balance;S represents the
stoichiometric matrix,*v represents the flux vector, and*b represents the time-derivative vector of metabolite con-centrations. The next constraints specify that at steady state,bmis zero if metabolitemis intracellular andbmis equal to the specific consumption (or production) flux of metabolite m if metabolite m is extracellular. The final constraints state that irreversible reactions can only take nonnegative values, while reversible reactions can be assigned any real value. Reactions were primarily
designated to be irreversible if they were recognized as such by literature and database sources [8, 25, 26]; excep-tions were made if a theoretically reversible reaction was known to preferentially operate in a certain direction in cell culture or in vivo (e.g., net secretion of lactate).Zis a specified linear combination of metabolic fluxes, which serves as the objective function for the LP problem.
For our metformin treatment simulation (see below), we have chosen to maximize the yield of biomass on carbon. To achieve this, we fixed the specific growth rate as a basis and chose the coefficients cn such that Z is equal to the total net carbon consumption rate:
and cn¼
carbons
substrate; ∀n∈N
cons subs
cn¼0; ∀n∉Nconssubs
whereNconssubs is the set of all net consumption reactions for glucose, glutamine, all nonessential amino acids, and car-bon dioxide. The set of substrates available for uptake was based on the composition of DMEM; therefore, of all non-essential amino acids, only those present in DMEM (cysteine, glycine, and serine) are permitted to have extra-cellular fluxes in the direction of net consumption.
Biomass composition values were taken from the lit-erature [23] as described above, and specific growth rate was fixed at 0.0289 h−1 (i.e., a doubling time of 24 h) [35]. Since growth rate was fixed, substrate consumption rates were left variable and included in the objective functions in the LP problems to find flux distribution so-lutions that maximized biomass yield on carbon, as de-scribed above. For maintenance of ATP cost, we used a literature estimate of 1.55 mmol gDCW−1 h−1[23]. A DCW of 360 pg/cell was assumed to normalize biomass con-tent on a per-cell basis [29]. Because optimization of growth yield alone cannot capture the Warburg effect [36, 37], a lower limit of lactate production (418 fmol cell−1 h−1, representative of the highly glycolytic A549 lung carcinoma cell line [16]) was introduced to ensure that the resulting flux distributions reasonably reproduced those empirically observed. (As was the case in previous reports [36, 37], minimization of total carbon alone did not result in lactate production.) To represent the Table 5Glutamine-derived nitrogen and carbon available for biomass contribution
Glutamine uptake profile Contributed mmol/gDCW Glutamine contribution to total biomass (%)
Glutamine contribution to total nonessential biomass (%)
Nitrogen Carbon Nitrogen Carbon Nitrogen Carbon
Maximum 4.89 12.2 47.1 29.0 100 57.1
Minimum 1.10 2.75 10.6 6.6 22.5 12.8
Predicted 4.33 10.8 41.6 25.7 88.4 50.5
detoxification of reactive oxygen species (ROS), we as-sumed that 1 % of total oxygen conas-sumed contributes to the formation of ROS, which must be neutralized by one equivalent of mitochondrial NADPH [38].
The minimal carbon uptake rate (i.e., the objective function valueZ*, which maximizes biomass yields at the specified growth rate) was determined using the “ lin-prog” LP solver function in MATLAB (Version 2009b, Mathworks). However, for a given problem formulation, there are generally multiple flux distributions that have this minimal carbon uptake rate. To avoid the possibility of multiple solutions, we implemented a second opti-mization program that, in addition to all previously spe-cified constraints, specifies the carbon uptake rate to be equal to the minimal rate Z* (determined from the first problem) and minimizes the two-norm of the flux vector v. The complete problem is therefore a bilevel opti-mization [39] that can be represented by the following formulation:
min
v
ffiffiffiffiffiffiffiffiffiffiffi XN
i¼1
v2
i v u u t
subject to
min
v Z
subject to:
S⋅v⇀¼
b
⇀
bm¼0; ∀m∈ℳintr
bm∈ℝ; ∀m∈ℳextr
vn≥0; ∀n∈Nirrev
vn∈ℝ; ∀n∈Nrev
Metformin treatment simulations
To simulate treatment by metformin, an inhibitor of re-spiratory complex I, the upper bound of the“ETCNADH” reaction, which corresponds to the production of 2.5 equivalents of ATP in exchange for the respiration-linked oxidation of one equivalent of mitochondrial NADH, was successively decreased. Initially, an uncon-strained simulation, which used the settings described in the “Problem formulation” section, was performed to give a baseline flux distribution reflecting untreated con-ditions (0 % nhibition of NADH oxidation by ETC). For all cases that simulated metformin treatment, an upper bound on the ETCNADHflux was introduced. This upper bound was set to 80, 60, 40, 20, and 0 % of the baseline flux value; these conditions were designated 20, 40, 60, 80, and 100 % inhibition of NADH oxidation by ETC,
respectively. All output flux distributions are given in Additional file 2: Table S14.
Results and discussion Precursors
We obtained a profile of hybridoma composition from Sheikh et al. 2005, which used hydrolyzed biomass data to give an accounting of 96.2 % measured DCW (Table 1). The additional 3.8 %, which presumably con-sists of small ions, vitamins, and other free metabolites and cofactors, is consistent with other estimates for the DCW fraction comprising free compounds [9, 30, 40]. Of this macromolecular fraction of DCW, essential com-pounds (i.e., those that must be taken up directly from the surrounding media or serum, such as choline and es-sential amino acids) constitute close to half—44.6 %. The metabolites in the remaining nonessential fraction can be synthesized de novo from a small set of core cen-tral carbon intermediates and other major elemental compounds (i.e., amino, thiol, and phosphate groups), with glucose, glutamine, and other catabolized amino acids as the primary carbon sources. The total demand for each core central carbon metabolite and elemental compound for synthesis of 1 g dry biomass was com-puted from the hybridoma biomass composition. Not surprisingly, almost all of the largest contributors (i.e., those which contributed at least 10 % of nonessential DCW) were associated with protein (e.g., 3PG, Oaa,
αKG, and NH3) (Fig. 2), which itself constitutes nearly 75 % of the total DCW. (The exception, AcCoA, is the major precursor of lipids.) No one single precursor con-tributes more than 10 % of the overall DCW.
However, this profile assumes complete biosynthesis of all nonessential compounds starting from glucose, whereas in practice, many cells will derive significant contributions to TCA cycle-associated compounds from glutamine and obtain nonessential amino acids and fatty acids directly from surrounding media [32, 41–43]. The effect of such uptake on the biosynthetic burden is shown in Table 2, with considerable reductions in the needs for 3PG, Pyr, Oaa, αKG, and AcCoA, as well as nitrogen (which is largely contributed from glutamine and other nonessential amino acids [32]). Because the majority of ATP equivalents are used for polymerization, which is not influenced by substrate uptake, there is not a substantial
reduction in ATP demand. (Although the molar amount of ATP that must be consumed for growth is greater than for all other substrates and cofactors, this quantity is still expected to be less than the ATP maintenance cost for all but the fastest growing cells. Even assuming extracellular uptake of all nonessential biosynthetic substrates, the 1.55 mmol ATP gDCW−1 h−1expended for cell maintenance estimated for the hybridoma model [23] exceeds growth-associated ATP consumption for doubling times longer than 14.4 h; this doubling time corresponds to faster growth than exhibited by all NCI-60 panel cell lines [35].)
Serine, glycine, and one-carbon units
A number of recent reports have implicated serine, gly-cine, and one-carbon metabolism as being important for tumors. The gene for phosphoglycerate dehydrogenase (PHGDH), which encodes the enzyme that catalyzes the first committed step in serine biosynthesis from 3PG, has been found to be amplified in breast cancer and melanoma [11, 12]; glycine consumption and catabolism have been reported to be important for fast proliferation [44, 45]; and oxidation of tetrahydrofolate (THF) compounds has been shown to be used for redox control in cancer cells [18, 46]. In addition, 1C units possess well-established roles in nu-cleotide synthesis, with methylene-THF required for thy-midylate production and its oxidized form, formyl-THF, for purine synthesis.
Nucleotide synthesis is essential for cancer cells, as well as any proliferating cells, to divide. Unlike amino acids (and potentially lipids), which can be derived from serum or culture medium to bypass de novo production [41, 47, 48], nucleotides are not thought to be scavenged from the extracellular environment in sufficient quan-tities to contribute to growth. Consequently, many clas-sic chemotherapeutic drugs directly inhibit various steps in nucleotide generation, and their administration also induces a range of side effects resulting from impaired proliferation of healthy tissue [14, 49]. Nucleotides are the only major class of macromolecules that require one-carbon THF compounds; accordingly, there is strong mo-tivation to understand the production of one-carbon units in the context of tumor metabolism.
Two major routes exist for methylene-THF generation: SHMT, which couples one-carbon production to serine catabolism to glycine, and the GCS, which oxidizes and deaminates glycine to form methylene-THF, carbon diox-ide (CO2), and ammonium (NH4+) (Fig. 3). SHMT has both cytosolic and mitochondrial isoforms—SHMT1 and SHMT2, respectively—while the GCS is exclusively mito-chondrial, although intercompartmental transporters exist for serine, glycine, and possibly folates [50, 51].
The demand for 1C units for nucleotide (and potentially NADPH) production places constraints on the fluxes through the serine-glycine pathway. We investigated these
Fig. 2Fates of major biomass precursors and cofactor equivalents consumed in synthesis of macromolecules. Fates of biomass precursors (3-phosphoglycerate and oxaloacetate), nitrogen/amine groups, and cofactors (NAD+, NADPH, and ATP) are classified by their requirements
constraints by analyzing the biomass requirements of serine, glycine, and tetrahydrofolate compounds. The number of millimoles of each substrate required per gram DCW are given in Table 3; as indicated, the demands for biosynthetic serine and glycine each surpass those of one-carbon units, primarily due to the high requirements for protein synthesis. (Note that each equivalent of cholesterol generated also produces, as a side product, an equivalent of formate which can be directly converted to formyl-THF. The formyl-THF expected to be derived from chol-esterol synthesis is subtracted from nucleotide one-carbon requirements.) We considered each extreme case in which 1C substrates are generated exclusively by either serine ca-tabolism via SHMT or glycine caca-tabolism via the GCS, re-spectively. In the case of SHMT, approximately 1 mol of serine must be metabolized through SHMT to produce 1 mol of 1C for every 2 mol of serine incorporated into biomass (Table 4). In the case of the GCS, it is roughly 1 mol glycine catabolized for every 3 mol glycine incorpo-rated into biomass (Table 4). As noted above, recent stud-ies have suggested that significant 1C production is required for redox control, with SHMT2 being most com-monly implicated [18, 45, 46]. If one-carbon units are used for NADPH production for control of oxidative stress in addition to nucleotide synthesis, the 1C demand will in-crease and the 1:2 and 1:3 ratios of flux through SHMT or GCS to direct biomass incorporation become lower bounds for serine and glycine use; for one-carbon metab-olism to contribute significantly to NADPH generation, even larger fractions of the total serine or glycine pool would need to be catabolized through SHMT or the GCS, respectively.
These results give insight into some recent findings about the importance of serine and glycine in the metab-olism of cancer cells. Previous results have shown an im-pairment in proliferation in breast cancer cells with amplified PHGDH copy number when the gene is
knocked down, but this knockdown does not result in a change in intracellular serine levels and cannot be res-cued by exogenous serine [11]. As in the case where SHMT is used to generate one-carbon units through conversion of serine to glycine, this represents a situ-ation in which metabolic flux rather than metabolite levels themselves is important. Although the link be-tween PHGDH and SHMT is less well understood, regu-lation of biosynthetic pathways at the committed step is a common motif in metabolism, so it is plausible that knockdown of PHGDH may affect the activities of other enzymes in the pathway, including SHMT. Thus, it may be that even when exogenous serine is added to the medium to bypass the PHGDH reaction, thefluxthrough the serine-glycine pathway, and therefore production of one-carbon units, is still impaired, this could explain why exogenous serine cannot rescue the PHGDH knockdown.
Glutamine and nitrogen metabolism
Although glutamine is nominally a nonessential amino acid (it can be synthesized through the ATP-dependent condensation of glutamate and free ammonia), it has been extensively reported that glutamine serves as a major biosynthetic substrate for cancer cells [13, 32, 52]. In effectively all cases that have been examined, cancer cells are not able to proliferate in tissue culture if glu-tamine is absent, and in particular, expression of the Myc oncogene has been indicated to cause “glutamine addiction,”with glutamine starvation inducing cell death [10, 13, 53, 54]. While glutamine has a unique role in contributing nitrogen to protein and nucleic acid synthe-sis, its function in maintaining cell viability and division appear to extend beyond this, as its deaminated catabolic productαKG appears at least partially able to rescue sur-vival and/or proliferation under glutamine starvation [55]. Using a stoichiometric analysis, we explored the down-stream metabolic consequences of glutamine consump-tion to satisfy cellular nitrogen demand.
Each molecule of glutamine consumed contains two nitrogen atoms that can contribute to biomass gener-ation: an“amide”nitrogen that is lost when glutamine is converted to glutamate and a“transamination” nitrogen that is lost when glutamine-derived glutamate is con-verted to αKG. Although these two amine groups are used by distinct biosynthesis reactions, the amide nitro-gen, for which there is a considerably smaller biomass demand, can be converted to a transamination nitrogen if it is first liberated by glutaminase to become free ammonia and then added to a molecule ofαKG by tamate dehydrogenase to become the amine group in glu-tamate (Fig. 4). (This model assumes that GDH operates reversibly, which, while thought to be unlikely unless am-monium concentrations are in the range of toxicity, pro-vides a lower bound estimate of potential glutamine
contribution to biomass [56].) As a consequence, our ana-lysis does not differentiate between the two amine groups. In addition to its two nitrogen atoms, each glutamine molecule contains five carbon atoms that may be incorpo-rated into biomass precursors, such as AcCoA, αKG, or Oaa. Although assuming that all five carbon atoms may contribute to biomass likely represents an overestimata-tion due to the presence of several intermediate decarb-oxylation reactions, which each evolve one carbon as CO2, the calculation nonetheless provides a suitable approxima-tion (in addiapproxima-tion to the fact that alternate downstream pathways, such as reductive carboxylation ofαKG to isoci-trate [16, 57, 58], may result in net CO2fixation).
We considered three cases: maximum, minimum, and predicted glutamine contribution to nitrogen supply. The maximum contribution case assumes that glutamine is the only nitrogen source available for incorporation into other nonessential amino acids; the minimum contribution case assumes that glutamine is used only for direct incorpor-ation into protein and donincorpor-ation of its amide group for nu-cleotide synthesis, with all other nonessential amino acids being taken up directly from the medium; and the pre-dicted contribution case uses the glutamine consumption value obtained from a simulation maximizing biomass yield on total carbon in DMEM nutrient conditions.
The amounts of carbon and nitrogen made available by glutamine uptake under these three scenarios were compared to both the total and nonessential carbon and nitrogen demands for producing new biomass (where
“nonessential” designates requirements that can be syn-thesized de novo) (Additional file 1: Table S8). Consump-tion of glutamine to meet nitrogen demand can have a profound influence on the supply of biosynthetic carbon: while glutamine contribution under the minimum uptake profile corresponds to a supply of 22.5 % of nonessential nitrogen and 12.8 % of nonessential carbon, its maximum uptake profile corresponds to 100 % of nonessential
nitrogen and 57.1 % nonessential carbon (Table 5). The
“predicted”uptake profile, in which glutamine supplies all nonessential nitrogen except that needed for cysteine and approximately two thirds of glycine, corresponds very closely to maximal contribution, with 88.4 % of nonessen-tial nitrogen coming from glutamine. In this case, the car-bon in the glutamine consumed to meet nitrogen demand is equivalent to roughly half of the total nonessential bio-synthetic carbon demand.
These results indicate that proliferating cells may in-corporate significant glutamine-derived carbon into the precursors for macromolecular synthesis simply as a consequence of meeting their nitrogen demand. Previous studies indicate that glutamine-consuming cells excrete considerable ammonia and, to a lesser extent, glutamate, which supports the notion of an important role for glu-tamine beyond nitrogen supply [32, 40, 59, 60]. Whether these findings reflect an involvement in signaling, kin-etic/thermodynamic limitations in “efficient” use of ni-trogen for anabolism or other metabolic factors remains an open question for the importance of glutamine as a biosynthetic substrate.
Metformin treatment simulations
Metformin is a safe and widely used biguanide drug that has long been used to treat type II diabetes. Diabetics taking metformin have a reduced incidence of cancer compared to diabetics that control blood sugar by other means, and a surge of investigations has followed to bet-ter understand its potential as a cancer therapeutic and its mechanism of action [61–66]. The compound is a direct inhibitor of complex I of the respiratory chain, and although it is believed to trigger numerous down-stream phenotypic effects, it also induces substantial short-term, transcription-independent changes in metab-olism [67, 68]. These changes reflect the robustness of cell metabolism, and it is important to be able to
Fig. 4Schematic of the major routes of glutamine contribution to carbon and nitrogen biomass. Deamidation of glutamine to glutamate occurs either via glutaminase (GLS) or various enzymes in nucleotide biosynthesis pathways. Glutamate subsequently can donate its remainingαcarbon amine group (NH4+α-C) toα-keto acids via aminotransferases (ATs) to form amino acids, resulting in conversion of the glutamate carbon skeleton
toαKG. GLS also produces free ammonium (NH4+amide), which can subsequently be incorporated intoαKG to regenerate glutamate by glutamate
anticipate these compensatory effects to identify poten-tial routes of adaptation [69, 70]. As with other meta-bolic inhibitors that may be putatively used as cancer therapeutics, stoichiometric analysis enables the predic-tion of immediate changes in metabolic fluxes following metformin treatment.
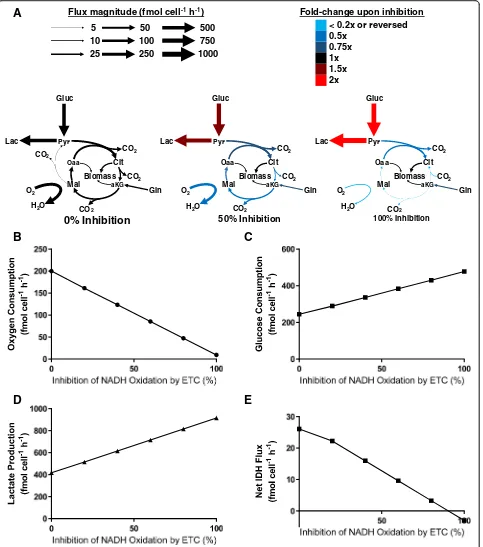
To model the effects of metformin treatment, we ap-plied an FBA approach to a stoichiometric model of cen-tral carbon metabolism and major anabolic pathways. After first obtaining a baseline profile of steady-state me-tabolism of cells, we successively decreased the upper bound on ETC-mediated NADH oxidation to simulate increasing doses of metformin treatment. The flux alter-ations revealed by these simulalter-ations closely mirrored many of the behavioral trends observed experimentally in cancer cells treated with metformin (Fig. 5a; Additional file 1: Tables S11, Additional file 2: Table S14). As would be expected for a respiratory inhibitor, decreasing the upper bound for ETC NADH oxidation reduces the oxy-gen consumption rate (Fig. 5b); in parallel, glucose con-sumption and lactate production increase (Fig. 5c, d), presumably to maintain the ATP production rate under effectively anaerobic conditions. Interestingly, increasing levels of inhibition also induce the net direction of the iso-citrate dehydrogenase (IDH) reactions to move in the re-ductive direction, as has been observed in cells treated with metformin and other complex I/III inhibitors (Fig. 5e) [57, 69, 71]. (It should be noted that the net flux consid-ered is the sum of all—mitochondrial and cytosolic—IDH isoform reactions and that net reductive flux is only pre-dicted in the extreme, complete-inhibition case.) While this does not contradict previous findings that reductive IDH flux correlates with a decrease in the citrate-to-αKG ratio [54, 71], it is encouraging that this behavior can be predicted as well in a purely stoichiometric model, which lacks the kinetic and thermodynamic driving forces associ-ated with metabolite concentration changes. To our knowledge, this represents the first instance in which an in silico model has predicted reductive IDH flux following inhibition of mitochondrial NADH oxidation, and it sug-gests that the phenomenon can be justified in a purely stoichiometric manner.
As previously suggested [69, 71–73], a relative de-crease in the mitochondrial NAD+regeneration rate ap-pears to be a factor in the decrease in oxidative TCA cycle flux. ETC NADH oxidation is overwhelmingly the major NAD+-producing step in the mitochondria, and constraining this flux correlates closely with decreases in the fluxes through pyruvate dehydrogenase (PDH), oxo-glutarate dehydrogenase (OGDH), and mitochondrial malate dehydrogenase (MDHm), all of which catalyze NAD+-consuming mitochondrial reactions (Additional file 1: Table S12, Additional file 3: Figure S2B–D). While the inhibition of respiration-linked NADH oxidation
results in a roughly threefold decrease in total mitochon-drial redox activity (i.e., NAD+ consumption and produc-tion), this is compensated by an approximately twofold increase in total cytosolic redox activity (Additional file 1: Table S13). Primarily, this elevation is accomplished by roughly proportional increases in the major NAD+ -con-suming and NAD+-producing reactions in the cytosol, glyceraldehyde 3-phosphate dehydrogenase (GAPDH), and lactate dehydrogenase (LDH), respectively, resulting in an increased fraction of glucose being converted to lactate. In addition, as indicated by lower cytosolic malate dehydrogenase activity upon simulated metformin treat-ment, malate-aspartate shuttle activity decreased in coord-ination with lower oxidative TCA cycle flux; this is because NADH generated in glycolysis is oxidized in the cytosol rather than being shuttled into the mitochondria for OXPHOS. In total, these results reflect the tight regu-lation between redox-associated steps across major meta-bolic pathways—complex I activity within the ETC, NADH oxidation in the TCA cycle, and GAPDH during and LDH following glycolysis—which, solely by satisfying stoichiometric mass-balance constraints on redox cofac-tors, enables robust maintenance of cellular growth and homeostasis.
as ETC inhibition increased, with MDHmoperating in the negative direction upon high levels of inhibition. Under all conditions, total NADH oxidation was lower than in the
original model (Additional file 3: Figure S1F). Inclusion of the NNT reaction in the GDH-irreversible network gave a substantial “rescue” of the metabolic phenotype; NAD+ -1000
750 500
250 10
25
50 100 5
Flux magnitude (fmol cell-1h-1)
0.75x 1x 1.5x 2x 0.5x
< 0.2x or reversed Fold-change upon inhibition
Gluc
Gln
Lac Pyr
Mal aKG
Cit
Oaa
CO2
CO2
CO2
O2
H2O
Biomass
50% Inhibition
Gluc
Gln
Lac Pyr
Mal aKG
Cit Oaa
CO2
CO2
CO2
O2
H2O
Biomass
100% Inhibition Gluc
Gln
Lac Pyr
Mal aKG
Cit
Oaa
CO2
CO2
CO2
CO2
O2
H2O
Biomass
0% Inhibition
A
B
C
D
E
consuming fluxes and total NADH oxidation increased to values much closer to those in the original network (Additional file 3: Figure S1A,C–F, Additional file 2: Table S14). These results support the notion that NNT conversion of NADH to NADPH can substantially con-tribute to the metabolic phenotype, particularly under conditions of inhibited NADH oxidation by the ETC.
As a final step in the analysis of our metformin simu-lations, we considered how glutamine usage changed with increasing inhibition of mitochondrial NADH oxi-dation. Despite dramatic alterations in downstream TCA cycle metabolism [57, 69], glutamine consumption has been reported to either increase slightly or remain un-changed following biguanide treatment [75]. Our simula-tions provided similar results, predicting a small initial decrease upon constraining ETC NADH oxidation 20 % but no change upon further inhibition (Additional file 3: Figure S2A, Additional file 2: Table S14). However, as previously mentioned, oxidative TCA cycle reactions re-sponsible for catabolizing glutamine-derivedα-ketoglutarate decrease (Additional file 3: Figure S2B–D), which is also consistent with previously reported experimental results [57, 71]). These decreases in flux are compensated by in-creases in reductive carboxylation flux, as noted (Fig. 5e).
To assess the general importance of oxidative glutam-ine metabolism, we modified our objective function so that glutamine uptake, rather than total carbon uptake, was minimized. As a consequence, glutamine uptake dropped to 11.5 fmol cell−1h−1(reflecting only direct in-corporation into protein and contribution of its amide group to asparagine and nucleotide synthesis), and gluta-minase flux became zero for all cases (Additional file 2: Table S14), suggesting that oxidative glutaminolysis is not necessary for proliferation. The 7.5 fmol cell−1 h−1 decrease in glutamine consumption experienced by ETC-inhibited simulations was almost completely offset by a 7.1 fmol cell−1h−1increase in pyruvate carboxylase flux, consistent with reports suggesting that pyruvate carboxylase is required for growth in cells when gluta-minase activity is insufficient for anaplerosis [76–78].
Many caveats remain in using this relatively simple FBA model to understand the behavior of cells treated by metformin or, through limiting other fluxes, other metabolic inhibitors. This model assumes that, in re-sponse to a particular perturbation, cells are freely able to adjust their metabolic fluxes as necessary to maintain a previously specified growth rate. Cells, of course, are limited in their short-term response to stress by the ex-pression of appropriate enzymes, which involves tran-scription, translation, and post-translational modifications, with each process responsive on its own distinct time scale. The total cell volume and expression of essential
“housekeeping” proteins bound the profile of metabolic enzymes and, hence, fluxes [79]. (Constraining enzyme
expression by the total solvent capacity or proteome size is, unlike our approach, able to predict aerobic glycolysis without setting a lower bound on lactate production [36, 37].) Further, signaling cascades (such as the AMPK pathway, which is activated in cells following metformin treatment unless it has been lost [80–82]) are typically triggered by such stresses, and the profile of available fluxes changes following expression of their downstream products. Finally, many of these fluxes, putatively allowed even on the basis of enzyme expression, may be infeasible due to kinetic and thermodynamic constraints, which, aside from the simplified categorization of reactions on the basis of their reversibility, are not captured in this ap-proach. Including additional constraints on fluxes derived from transcriptomic, proteomic, or physicochemical infor-mation can overcome some of these limitations and pro-vide more powerful predictive capabilities, but requires a larger, more sophisticated model where such data have been incorporated [19, 36, 37]. While we recognize that it may not be sufficient for some contexts, our approach demonstrates that a relatively small (roughly 150 reaction) stoichiometric network consisting of little more than mass balances, optimized biomass yield, and a lower bound on lactate production is nonetheless capable of predicting metabolic phenotypes in contexts relevant to cancer cells. A comparably simple approach similar to what we pur-sued here may be more accessible for biologists who do not normally perform computational modeling but are nonetheless interested in simulating metabolic networks to explore their questions.
Additional discussion
producing energy (Additional file 1: Table S11). Indeed, this is consistent with the notion that the distribution of major metabolic fluxes in cancer cells should be insensi-tive to their specific biomass composition, as has been reported in other studies involving FBA simulations [19]. However, the relatively small magnitudes of these ana-bolic fluxes do not mean that they are “insignificant” or that they may not serve as promising therapeutic targets for inhibition. Rather, they suggest that additional factors beyond stoichiometry strongly influence the cancer cell metabolic phenotype. Allosteric activation, inhibition, and post-translational modification of enzymes by me-tabolites or metabolism-mediated epigenetic changes all contribute strongly to metabolic regulation in a complex, bidirectional manner that is difficult to capture using current models [83–86].
Second, the diverse pathways available to cells for co-factor production impart them with enhanced adaptabil-ity and robustness in their abiladaptabil-ity to survive inhospitable microenvironments and potential chemical inhibitors. For the case of ATP, the baseline, uninhibited FBA pre-dicts a roughly 50 % contribution by glycolysis, which is near the upper limit of glycolytic contribution to energy production observed in cancer cells [87] (and largely a result of the assigned lower bound for lactate production). However, the simulated metformin treatment demon-strates how, even approaching complete inhibition of oxi-dative metabolism, only a roughly twofold increase in fermentation can maintain ATP production without any change in growth. Additionally, numerous pathways exist to allow considerable flexibility for cells to satisfy their demands for NADPH. The FBA model predicts most NADPH to be generated from malic enzyme, glutamate dehydrogenase, nicotinamide nucleotide transhydrogen-ase, and methylenetetrahydrofolate dehydrogentranshydrogen-ase, and presumably minimizes flux through the oxidative PPP as a consequence of the objective function (maximized bio-mass yield on carbon) and lower bound on lactate produc-tion. However, given that the oxidative PPP has been demonstrated to possess considerable activity, particularly in response to increased ROS, it too appears to serve a prominent role in generating reducing equivalents in tumor cells [18, 51, 88]. This notion of metabolic flexibility underscores a challenge in targeting cancer cell metabol-ism, which suggests that combination treatments that minimize the likelihood of adaptation to selective pressure may be promising strategies.
Finally, the high rate of glucose consumption, while enabling the generation of biomass precursors and co-factors beyond necessary requirements, comes at no ap-parent cost to the cell under these conditions (i.e., the specified growth rate and lactate production rate, each based on tissue culture measurements). Under most in vitro cell culture conditions, glucose concentrations are
highly relative to physiological levels (e.g., 25 mM vs. 5– 10 mM), and when tumor cells are sufficiently close to blood vessels, they are afforded access to roughly con-stant glucose levels. In effect, glucose is “free” for these cells, and there is no cost to consuming it when it is available. Although ATP and amino acids are required to generate the enzymes and transporters needed for high rates of fermentation, this burden is presumably consid-ered in the “Protein” biosynthesis demands (Additional file 1: Table S7), and these do not appear prohibitive to growth. Additionally, despite the low yield of ATP per mole glucose consumed, previous analyses using prote-omic data have suggested that the overflow metabolism that characterizes the Warburg effect is indeed max-imally efficient when considering additional constraints on enzyme levels, such as cellular volume or total protein cost [37, 89, 90]. Furthermore, continuous supply of high glycolytic flux may provide a buffering system such that, in responses to various stresses that may be experienced in the tumor microenvironment (e.g., oxidative stress, en-ergy depletion, drug treatment), flux can be easily shunted to produce substrates (e.g., NADPH, glutathione, ATP) necessary to maintain growth and evade apoptosis.
Conclusions
changes observed in cells following metformin treatment and also enabled greater understanding of the interac-tions within the reaction network that contributed to these changes.
Additional files
Additional file 1: Table S1.Composition of protein biomass components in terms of precursors by weight.Table S2.Composition of nucleotide biomass components in terms of precursors by weight.Table S3.
Composition of polysaccharide and lipid biomass components in terms of precursors by weight.Table S4.Stoichiometric precursor and cofactor requirements for nonessential amino acid biosynthesis.Table S5.
Stoichiometric precursor and cofactor requirements for nucleotide biosynthesis.Table S6.Stoichiometric precursor and cofactor requirements for polysaccharide and lipid biosynthesis.Table S7.Cumulative
stoichiometric precursor and cofactor requirements for major macromolecule groups.Table S8.Component breakdown of carbon and nitrogen distribution in biomass.Table S9.Metabolites included in the stoichiometric matrix.Table S10.Reactions included in the stoichiometric matrix.Table S11.
Complete flux distributions from metformin treatment simulations.Table S12.
Mitochondrial NAD+-consuming and NAD+-producing fluxes computed in
metformin treatment simulations.Table S13.Cytosolic NAD+-consuming
and NAD+-producing fluxes computed in metformin treatment simulations. (DOCX 121 kb)
Additional file 2: Table S14.Flux distributions generated from metformin treatment simulations. Baseline (total carbon uptake minimized, NNT present, GDH reversible); NNT absent, GDH reversible; NNT absent, GDH irreversible; NNT present, GDH irreversible; and total glutamine uptake minimized cases all provided. (XLSX 50 kb)
Additional file 3: Figure S1.Mitochondrial NADH consumption and production flux predictions as functions of ETC inhibition for different nicotinamide nucleotide transhydrogenase (NNT) and glutamate dehydrogenase (GDH) conditions.Figure S2.Additional metabolic flux alterations predicted to occur in response to ETC inhibition in simulations of metformin treatment. (PDF 194 kb)
Abbreviations
1C, one-carbon unit; 3PG, 3-phosphoglycerate;αKG,α-ketoglutarate; AcCoA, acetyl-coenzyme A; CS, citrate synthase; DCW, dry cell weight; DHAP, dihydroxyacetone phosphate; DMEM, Dulbecco’s modified Eagle medium; ETC, electron transport chain; FA, fatty acid; FBA, flux balance analysis; FH, fumarate hydratase; G6P, glucose 6-phosphate; GAPDH, glyceraldehyde 3-phosphate dehydrogenase; GCS, glycine cleavage system; GDH, glutamate dehydrogenase; IDH, isocitrate dehydrogenase; LDH, lactate dehydrogenase; LP, linear programming; MDH, malate dehydrogenase; NEAA, nonessential amino acid; NNT, nicotinamide nucleotide transhydrogenase; Oaa, oxaloacetate; OGDH, oxoglutarate dehydrogenase; PHGDH, phosphoglycerate dehydrogenase; PDH, pyruvate dehydrogenase; PPP, pentose phosphate pathway; R5P, ribose 5-phosphate; ROS, reactive oxygen species; SDH, succinate dehydrogenase; SHMT, serine hydroxymethyltransferase; SUCL, succinate-CoA ligase; THF,
tetrahydrofolate
Acknowledgements
We thank M. Ahsanul Islam for critically reviewing the manuscript and providing helpful feedback.
Funding
This work was funded by NIH grants 1R01DK075850-01 and 1R01CA160458-01A1 to OI and GS. MAK is supported by David H. Koch Graduate Fellowship Fund and the Ludwig Fund for Cancer Research. These funding bodies had no role in the design of the study; collection, analysis, and interpretation of the data; or in writing the manuscript.
Availability of data and materials
The flux distributions generated from all metformin simulations are provided in Additional file 2: Table S14.
Authors’contributions
MAK wrote the article, and all other authors contributed to revisions. MAK performed the metabolic analysis and modeling, and TMW provided technical and conceptual input. JKK, OI, MGVH, and GS provided conceptual input and support. All authors read and approved the final manuscript.
Competing interests
The authors declare that they have no competing interests.
Consent for publication
Not applicable.
Ethics approval and consent to participate
Not applicable.
Author details
1Department of Chemical Engineering, Massachusetts Institute of Technology, Cambridge, MA 02139, USA.2Koch Institute for Integrative Cancer Research and Department of Biology, Massachusetts Institute of Technology, Cambridge, MA 02139, USA.3Current Address: Late Stage Process Development, Sanofi Genzyme, 31 New York Ave, Framingham, Massachusetts 01701, USA.4Center for Cancer Research, Massachusetts General Hospital Cancer Center, Charlestown, MA 02129, USA.5Division of Hematology/Oncology, Department of Medicine, Massachusetts General Hospital, Boston, MA 02114, USA.
Received: 19 May 2016 Accepted: 14 July 2016
References
1. Lunt SY, Vander Heiden MG. Aerobic glycolysis: meeting the metabolic requirements of cell proliferation. Annu Rev Cell Dev Biol. 2011;27:441–64. 2. Vander Heiden MG, Cantley LC, Thompson CB. Understanding the Warburg
effect: the metabolic requirements of cell proliferation. Science. 2009;324:1029–33.
3. Pearce EL, Poffenberger MC, Chang C-H, Jones RG. Fueling immunity: insights into metabolism and lymphocyte function. Science. 2013;342:1242454. 4. Hitosugi T, Kang S, Vander Heiden MG, Chung T-W, Elf S, Lythgoe K, Dong
S, Lonial S, Wang X, Chen GZ, Xie J, Gu T-L, Polakiewicz RD, Roesel JL, Boggon TJ, Khuri FR, Gilliland DG, Cantley LC, Kaufman J, Chen J. Tyrosine phosphorylation inhibits PKM2 to promote the Warburg effect and tumor growth. Sci Signal. 2009;2:ra73.
5. Vander Heiden MG, Lunt SY, Dayton TL, Fiske BP, Israelsen WJ, Mattaini KR, Vokes NI, Stephanopoulos G, Cantley LC, Metallo CM, Locasale JW: Metabolic pathway alterations that support cell proliferation. Cold Spring Harb Symp Quant Biol. 2012;76:325-34.
6. Macintyre AN, Rathmell JC. Activated lymphocytes as a metabolic model for carcinogenesis. Cancer Metab. 2013;1:5.
7. Neidhardt FC, Ingraham JL, Schaechter M. Physiology of the bacterial cell: a molecular approach. Sunderland: Sinauer Associates; 1990.
8. Nelson DL, Lehninger AL, Cox MM. Lehninger principles of biochemistry. New York: W. H. Freeman; 2008.
9. Alberts B, Johnson A, Lewis J, Raff M, Roberts K, Walter P. Molecular biology of the cell, 5th Edition. New York: Garland Science; 2008.
10. Wise DR, DeBerardinis RJ, Mancuso A, Sayed N, Zhang X-Y, Pfeiffer HK, Nissim I, Daikhin E, Yudkoff M, McMahon SB, Thompson CB. Myc regulates a transcriptional program that stimulates mitochondrial glutaminolysis and leads to glutamine addiction. Proc Natl Acad Sci U S A. 2008;105:18782–7. 11. Possemato R, Marks KM, Shaul YD, Pacold ME, Kim D, Birsoy K,
Sethumadhavan S, Woo H-K, Jang HG, Jha AK, Chen WW, Barrett FG, Stransky N, Tsun Z, Cowley GS, Barretina J, Kalaany NY, Hsu PP, Ottina K, Chan AM, Yuan B, Garraway L a, Root DE, Mino-Kenudson M, Brachtel EF, Driggers EM, Sabatini DM. Functional genomics reveal that the serine synthesis pathway is essential in breast cancer. Nature. 2011;476:346–50. 12. Locasale JW, Grassian AR, Melman T, Lyssiotis CA, Mattaini KR, Bass AJ,
13. Wise DR, Thompson CB. Glutamine addiction: a new therapeutic target in cancer. Trends Biochem Sci. 2010;35:427–33.
14. Vander Heiden MG. Targeting cancer metabolism: a therapeutic window opens. Nat Rev Drug Discov. 2011;10:671–84.
15. Galluzzi L, Kepp O, Vander Heiden MG, Kroemer G. Metabolic targets for cancer therapy. Nat Rev Drug Discov. 2013;12:829–46.
16. Metallo CM, Gameiro P a, Bell EL, Mattaini KR, Yang J, Hiller K, Jewell CM, Johnson ZR, Irvine DJ, Guarente L, Kelleher JK, Vander Heiden MG, Iliopoulos O, Stephanopoulos G. Reductive glutamine metabolism by IDH1 mediates lipogenesis under hypoxia. Nature. 2012;481:380–4.
17. Yang C, Ko B, Hensley CT, Jiang L, Wasti AT, Kim J, Sudderth J, Calvaruso MA, Lumata L, Mitsche M, Rutter J, Merritt ME, DeBerardinis RJ. Glutamine oxidation maintains the TCA cycle and cell survival during impaired mitochondrial pyruvate transport. Mol Cell. 2014;56:414–24. 18. Fan J, Ye J, Kamphorst JJ, Shlomi T, Thompson CB, Rabinowitz JD.
Quantitative flux analysis reveals folate-dependent NADPH production. Nature. 2014;510(7504):298–302.
19. Folger O, Jerby L, Frezza C, Gottlieb E, Ruppin E, Shlomi T. Predicting selective drug targets in cancer through metabolic networks. Mol Syst Biol. 2011;7:501. 20. Frezza C, Zheng L, Folger O, Rajagopalan KN, MacKenzie ED, Jerby L,
Micaroni M, Chaneton B, Adam J, Hedley A, Kalna G, Tomlinson IPM, Pollard PJ, Watson DG, Deberardinis RJ, Shlomi T, Ruppin E, Gottlieb E. Haem oxygenase is synthetically lethal with the tumour suppressor fumarate hydratase. Nature. 2011;477:225–8.
21. Savinell JM, Palsson BO. Network analysis of intermediary metabolism using linear optimization. I. Development of mathematical formalism. J Theor Biol. 1992;154:421–54.
22. Savinell JM, Palsson BO. Network analysis of intermediary metabolism using linear optimization. II. Interpretation of hybridoma cell metabolism. J Theor Biol. 1992;154:455–73.
23. Sheikh K, Förster J, Nielsen LK. Modeling hybridoma cell metabolism using a generic genome-scale metabolic model of Mus musculus. Biotechnol Prog. 2005;21:112–21.
24. Noor E, Eden E, Milo R, Alon U. Central carbon metabolism as a minimal biochemical walk between precursors for biomass and energy. Mol Cell. 2010;39:809–20.
25. Caspi R, Altman T, Dreher K, Fulcher C a, Subhraveti P, Keseler IM, Kothari A, Krummenacker M, Latendresse M, Mueller L a, Ong Q, Paley S, Pujar A, Shearer AG, Travers M, Weerasinghe D, Zhang P, Karp PD. The MetaCyc database of metabolic pathways and enzymes and the BioCyc collection of pathway/ genome databases. Nucleic Acids Res. 2012;40(Database issue):D742–53. 26. Kanehisa M, Goto S. KEGG: Kyoto Encyclopedia of Genes and Genomes.
Nucleic Acids Res. 2000;28:27–30.
27. Park JO, Rubin SA, Xu Y-F, Amador-Noguez D, Fan J, Shlomi T, Rabinowitz JD: Metabolite concentrations, fluxes and free energies imply efficient enzyme usage. Nat Chem Biol. 2016;12:482–489.
28. Frame KK, Hu WS. Cell volume measurement as an estimation of mammalian cell biomass. Biotechnol Bioeng. 1990;36:191–7.
29. Feijó Delgado F, Cermak N, Hecht VC, Son S, Li Y, Knudsen SM, Olcum S, Higgins JM, Chen J, Grover WH, Manalis SR. Intracellular water exchange for measuring the dry mass, water mass and changes in chemical composition of living cells. PLoS One. 2013;8:e67590.
30. Bonarius HP, Hatzimanikatis V, Meesters KP, de Gooijer CD, Schmid G, Tramper J. Metabolic flux analysis of hybridoma cells in different culture media using mass balances. Biotechnol Bioeng. 1996;50:299–318. 31. Eagle H. Amino acid metabolism in mammalian cell cultures. Science.
1959;130:432–7.
32. Hosios AM, Hecht VC, Danai LV, Johnson MO, Rathmell JC, Steinhauser ML, Manalis SR, Vander Heiden MG. Amino acids rather than glucose account for the majority of cell mass in proliferating mammalian cells. Dev Cell. 2016;36:540–9.
33. Varma A, Palsson BO. Metabolic flux balancing: basic concepts, scientific and practical use. Nat Biotechnol. 1994;12:994–8.
34. Orth JD, Thiele I, Palsson BØ. What is flux balance analysis? Nat Biotechnol. 2010;28:245–8.
35. Connor PMO, Jackman J, Bae I, Connor MO, Myers G, Scudiero DA, Monks A, Sausville EA, Weinstein JN, Friend S, Fornace AJ, Kohn KW.
Characterization of the p53 tumor suppressor pathway in cell lines of the National Cancer Institute anticancer drug screen and correlations with the growth-inhibitory potency of 123 anticancer agents. Cancer Res. 1997;57: 4285–300.
36. Vazquez A, Liu J, Zhou Y, Oltvai ZN. Catabolic efficiency of aerobic glycolysis: the Warburg effect revisited. BMC Syst Biol. 2010;4:58. 37. Shlomi T, Benyamini T, Gottlieb E, Sharan R, Ruppin E. Genome-scale
metabolic modeling elucidates the role of proliferative adaptation in causing the Warburg effect. PLoS Comput Biol. 2011;7:e1002018. 38. Murphy MP. How mitochondria produce reactive oxygen species. Biochem
J. 2009;417:1–13.
39. Burgard AP, Pharkya P, Maranas CD. Optknock: a bilevel programming framework for identifying gene knockout strategies for microbial strain optimization. Biotechnol Bioeng. 2003;84:647–57.
40. Xie L, Wang DI. Applications of improved stoichiometric model in medium design and fed-batch cultivation of animal cells in bioreactor.
Cytotechnology. 1994;15:17–29.
41. Kamphorst JJ, Cross JR, Fan J, de Stanchina E, Mathew R, White EP, Thompson CB, Rabinowitz JD. Hypoxic and Ras-transformed cells support growth by scavenging unsaturated fatty acids from lysophospholipids. Proc Natl Acad Sci U S A. 2013;110(22):8882–7.
42. Maddocks ODK, Berkers CR, Mason SM, Zheng L, Blyth K, Gottlieb E, Vousden KH. Serine starvation induces stress and p53-dependent metabolic remodelling in cancer cells. Nature. 2013;493:542–6.
43. Labuschagne CF, van den Broek NJF, Mackay GM, Vousden KH, Maddocks ODK. Serine, but not glycine, supports one-carbon metabolism and proliferation of cancer cells. Cell Rep. 2014;7:1248–58.
44. Zhang WC, Shyh-chang N, Yang H, Rai A, Umashankar S, Ma S, Soh BS, Sun LL, Tai BC, Nga ME, Bhakoo KK, Jayapal SR, Nichane M, Yu Q, Ahmed DA, Tan C, Sing WP, Tam J, Thirugananam A, Noghabi MS, Pang YH, Ang HS, Robson P, Kaldis P, Soo RA, Swarup S. Glycine decarboxylase activity drives non-small cell lung cancer tumor-initiating cells and tumorigenesis. Cell. 2012;148:259–72.
45. Kim D, Fiske BP, Birsoy K, Freinkman E, Kami K, Possemato RL, Chudnovsky Y, Pacold ME, Chen WW, Cantor JR, Shelton LM, Gui DY, Kwon M, Ramkissoon SH, Ligon KL, Kang SW, Snuderl M, Vander Heiden MG, Sabatini DM. SHMT2 drives glioma cell survival in ischaemia but imposes a dependence on glycine clearance. Nature. 2015;250:363–7.
46. Ye J, Fan J, Venneti S, Wan Y, Pawel BR, Zhang J, Finley LWS, Lu C, Lindsten T, Cross JR, Qing G, Liu Z, Simon MC, Rabinowitz JD, Thompson CB. Serine catabolism regulates mitochondrial redox control during hypoxia. Cancer Discov. 2014;4:1406–17.
47. Commisso C, Davidson SM, Soydaner-Azeloglu RG, Parker SJ, Kamphorst JJ, Hackett S, Grabocka E, Nofal M, Drebin J a, Thompson CB, Rabinowitz JD, Metallo CM, Vander Heiden MG, Bar-Sagi D. Macropinocytosis of protein is an amino acid supply route in Ras-transformed cells. Nature. 2013;497:633–7.
48. Kamphorst JJ, Nofal M, Commisso C, Hackett SR, Lu W, Grabocka E, Vander Heiden MG, Miller G, Drebin JA, Bar-sagi D, Thompson CB, Rabinowitz JD. Human pancreatic cancer tumors are nutrient poor and tumor cells actively scavenge extracellular protein. Cancer Res. 2015;75:544–54.
49. Chabner BA, Roberts TGJ. Chemotherapy and the war on cancer. Nat Rev Cancer. 2005;5:65–72.
50. Tibbetts AS, Appling DR. Compartmentalization of mammalian folate-mediated one-carbon metabolism. Annu Rev Nutr. 2010;30:57–81. 51. Lewis CA, Parker SJ, Fiske BP, McCloskey D, Gui DY, Green CR, Vokes NI, Feist
AM, Vander Heiden MG, Metallo CM. Tracing compartmentalized NADPH metabolism in the cytosol and mitochondria of mammalian cells. Mol Cell. 2014;55:253–63.
52. DeBerardinis RJ, Mancuso A, Daikhin E, Nissim I, Yudkoff M, Wehrli S, Thompson CB. Beyond aerobic glycolysis: transformed cells can engage in glutamine metabolism that exceeds the requirement for protein and nucleotide synthesis. Proc Natl Acad Sci U S A. 2007;104:19345–50. 53. Qing G, Li B, Vu A, Skuli N, Walton ZE, Liu X, Mayes P a, Wise DR, Thompson
CB, Maris JM, Hogarty MD, Simon MC. ATF4 regulates MYC-mediated neuroblastoma cell death upon glutamine deprivation. Cancer Cell. 2012;22:631–44.
54. Gameiro PA, Yang J, Metelo AM, Pérez-Carro R, Baker R, Wang Z, Arreola A, Rathmell WK, Olumi A, López-Larrubia P, Stephanopoulos G, Iliopoulos O. In vivo HIF-mediated reductive carboxylation is regulated by citrate levels and sensitizes VHL-deficient cells to glutamine deprivation. Cell Metab. 2013;17: 372–85.


![1,2,4,5,6,7,8,9 Octachlorotricyclo[5 2 1 02,6]deca 4,8 diene 3,10 diol](data:image/gif;base64,R0lGODlhAQABAIAAAP///wAAACH5BAEAAAAALAAAAAABAAEAAAICRAEAOw==)