Open Access
Research article
Exploring hepatic hormone actions using a compilation of gene
expression profiles
Nina Ståhlberg
1, Roxana Merino
1, Luis Henríquez Hernández
2,
Leandro Fernández-Pérez
2, Albin Sandelin
3, Pär Engström
3, Petra
Tollet-Egnell
1, Boris Lenhard
3and Amilcar Flores-Morales*
1Address: 1Department of Molecular Medicine, Karolinska Institute, 17176 Stockholm, Sweden, 2Health Sciences Center, Pharmacology Section, Las Palmas de GC University – Instituto Canario de Investigación del Cancer – RTICCC, 35080 – Las Palmas de GC, Spain and 3Center for Genomics and Bioinformatics, Karolinska Institute, 17176 Stockholm, Sweden
Email: Nina Ståhlberg - [email protected]; Roxana Merino - [email protected]; Luis Henríquez Hernández - [email protected]; Leandro Fernández-Pérez - [email protected];
Albin Sandelin - [email protected]; Pär Engström - [email protected]; Petra Tollet-Egnell - [email protected]; Boris Lenhard - [email protected]; Amilcar Flores-Morales* - [email protected]
* Corresponding author
Abstract
Background: Microarray analysis is attractive within the field of endocrine research because regulation of gene expression is a key mechanism whereby hormones exert their actions. Knowledge discovery and testing of hypothesis based on information-rich expression profiles promise to accelerate discovery of physiologically relevant hormonal mechanisms of action. However, most studies so-far concentrate on the analysis of actions of single hormones and few examples exist that attempt to use compilation of different hormone-regulated expression profiles to gain insight into how hormone act to regulate tissue physiology. This report illustrates how a meta-analysis of multiple transcript profiles obtained from a single tissue, the liver, can be used to evaluate relevant hypothesis and discover novel mechanisms of hormonal action. We have evaluated the differential effects of Growth Hormone (GH) and estrogen in the regulation of hepatic gender differentiated gene expression as well as the involvement of sterol regulatory element-binding proteins (SREBPs) in the hepatic actions of GH and thyroid hormone.
Results: Little similarity exists between liver transcript profiles regulated by 17-α-ethinylestradiol and those induced by the continuos infusion of bGH. On the other hand, strong correlations were found between both profiles and the female enriched transcript profile. Therefore, estrogens have feminizing effects in male rat liver which are different from those induced by GH. The similarity between bGH and T3 were limited to a small group of genes, most of which are involved in lipogenesis. An in silico promoter analysis of genes rapidly regulated by thyroid hormone predicted the activation of SREBPs by short-term treatment in vivo. It was further demonstrated that proteolytic processing of SREBP1 in the endoplasmic reticulum might contribute to the rapid actions of T3 on these genes.
Conclusion: This report illustrates how a meta-analysis of multiple transcript profiles can be used to link knowledge concerning endocrine physiology to hormonally induced changes in gene expression. We conclude that both GH and estrogen are important determinants of gender-related differences in hepatic gene expression. Rapid hepatic thyroid hormone effects affect genes involved in lipogenesis possibly through the induction of SREBP1 proteolytic processing. Published: 13 June 2005
BMC Physiology 2005, 5:8 doi:10.1186/1472-6793-5-8
Received: 22 October 2004 Accepted: 13 June 2005
This article is available from: http://www.biomedcentral.com/1472-6793/5/8
© 2005 Ståhlberg et al; licensee BioMed Central Ltd.
Background
The completion of human and rodent genome sequences [1-3] has brought the post-genomic era to the field of endocrine research. Detailed genetic maps of the main endocrine models can now be used to study the molecular basis of endocrine disease and the molecular mechanisms of hormone actions. The possibility to explore expression data of thousands of genes across multiple experimental paradigms promise to rapidly increase our understanding of biological systems [4,5]. The acquisition of experimen-tal data at a genomic scale requires high throughput tech-nologies such as DNA microarray analysis. Microarrays enable the simultaneous assessment of expression levels of tens of thousands of gene products in an ease to per-form assay. Microarrays are especially attractive to the field of endocrine research because regulation of gene expression is an important mechanism whereby hor-mones exert their physiological actions. This is obvious in the case of steroid and thyroid hormones, which use intra-cellular receptors belonging to the nuclear receptor family of transcription factors [6]. Peptide hormones also regu-late gene expression after activating complex cascades of intracellular signaling events upon binding to transmem-brane receptors [7]. If the relation between hormones and the expression of different genes could be annotated, the abundant knowledge concerning endocrine physiology might be used to clarify the biological function of those genes. On the other hand, because expression profiles are rich in information, they are suitable to study the complex and pleitropic actions of hormones.
Here we analyzed a compilation of rat liver expression profiles from experiments designed to study gender and hormone actions in order to provide novel insight into the mechanisms of action of specific hormones. The data-set used in this study comprises the actions of thyroid hor-mone (T3), 17-α-ethinylestradiol and GH in liver. The data is freely available from the Endocrinology Gene Expression Database – http://www.cmm.ki.se/EndoGED and have also been deposited in Gene Expression Omni-bus http://www.ncbi.nlm.nih.gov/geo/. Using this collec-tion of microarray data, we analyzed the differential contribution of estrogens and GH to the regulation of gen-der differentiated liver gene expression. We also compared the actions of GH and T3 in liver and found a small over-lap comprising genes involved in lipogenesis suggesting the common regulation of SREBP transcription factors. The regulation of SREBP1 by GH and thyroid hormone was analyzed.
Results
Exploring hormonal regulation of gene expression in liver Several expression profiles where compiled and used to obtain insight into the hormonal regulation of liver phys-iology. The following six experiments were analyzed
together (Table 1): 17-α-ethinylestradiol treatment of male rats, infusion of bGH in young (3 month) male rats [8], infusion of hGH in old (2 years) male rats [9], bGH treatment of primary hepatocytes isolated from young male rats, comparison of female and male rats [8], and the rapid effects of T3 treatment of hypothyroid mice [10]. The following questions were formulated: Can expression profiling be used to clarify the physiological actions of hormones in the liver? Can promoter analysis of hormo-nally regulated genes provide novel insight into the mech-anism of hormone actions? It should be noted that our intentions were not to exhaustively explore the data set but rather to illustrate the utility of microarray data min-ing in endocrine research. The experiments included in this analysis were not specifically designed to answer the questions formulated in the present study although they are sufficient to test our hypotheses. This mimics the situ-ation when the experimental biologist try to derive knowl-edge from a set of disparate experiments performed in different laboratories, using different experimental designs and microarray technologies. Importantly, we have taken all possible measures to minimize systematic experimental errors. All the arrays used for analysis have been fabricated in house from a unique set of PCR prod-ucts and these have been validated in numerous studies [7-15]. The protocols for labeling and data analysis were also similar along all the experiments. Within each of the experiments included in this analysis, we have accounted for biological variability by independent replication of the measurements using RNA from individual animals.
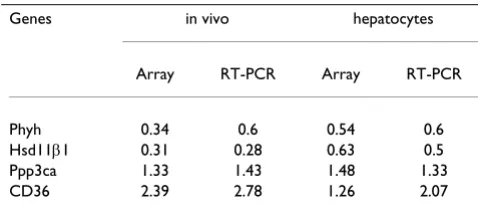
effects on gene expression after in vivo or in vitro GH treat-ment were confirmed for some genes using quantitative real-time PCR (Tables 2 and 3).
As shown in figure 1b, the correlation between GH treat-ment and thyroid hormone or estrogen treattreat-ment in young males was rather low. This is not surprising since both hormones have distinct liver functions not always overlapping those of GH. Differences in expression can also arise from the choice of treatment duration, dose and mode of hormone treatment and this could result in the underestimation of commonly regulated genes. This ambiguity can only be resolved by measuring more expression profiles in experiments specifically designed to study hormonal interactions.
GH and estrogen contribute to gender differences in hepatic gene expression
When we compared the gender-related expression differ-ences to the rest of the experiments (Figure 1c, Table 4), it was evident that as many as 48% of the female-enriched transcripts were also up-regulated by continuous GH
infu-Table 1: Experiments included in the study.
species age sex tissue Control sample Tester sample (hormone, time, dose)
rat 3 months M liver c.i. of vehicle c.i. of bGH, 1 week, 5 µg/h
rat 2 years M liver c.i. of vehicle c.i. of hGH, 3 weeks, 0.34 µg/g body weight/day
rat 2 months M hepatocytes medium bGH added to medium, 24 hours, 100 ng/ml
rat 3 months M/F liver male female
rat 3 months M liver vehicle 17-α-ethinylestradiol, 1 day, 5 mg/kg body weight
mouse 3 months M liver hypothyroid injection of T3 & TT4, 2 hours, 5 µg T3 + 5 µg T4
Expression profiles from six independent studies regarding gender differences and hormonal regulation of hepatic gene expression were included in the study. bGH = bovine growth hormone, hGH = human growth hormone, T3 = triiodothyronine, T4 = thyroxine, c.i. = continuous infusion, hepatocytes = primary rat hepatocytes. All rat experiments used Sprague Dawley rat strain. The mice strain used to study thyroid hormone actions was a hybrid of 129/Sv X C57Bl76J.
Table 2: The primers, amplicon sizes and annealing temperatures used for gene expression measurements by real-time PCR.
gene left primer right primer size temp
FAT/CD36 GCAACAACAAGGCCAGGTAT TGTGGCTGAGCAGAAAGAGA 200 54
Ppp3ca GCAGGCTGGAAGAAAGTGTC AAGGCCCACAAATACAGCAC 200 54
Hsd11b1 TTTTGCAGAGCGATTTGTTG TGCTCAGGACCACATAGCTG 200 54
Phyh TACGTGGAGTGCTTCACTGG CCATTGTTCCTGTCGATGTG 200 54
Srebp1a GCGCCATGGACGAGCTG TTGGCACCTGGGCTGCT 200 57
Srebp1c GGAGCCATGGATTGCACATT GCTTCCAGAGAGGAGGCCAG 200 54
Srebp2 CCCTTGACTTCCTTGCTGCA GCGTGAGTGTGGGCGAATC 200 54
The expression of phytanoyl-CoA hydroxylase (Phyh), hydroxysteroid 11-beta dehydrogenase 1 (Hsd11b1), the catalytic subunit of protein phosphatase 3, alpha isoform (Ppp3ca), fatty acid translocase/cd36 antigen (FAT/CD36) and sterol regulatory element-binding proteins (SREBPs) 1a, 1c and 2 were measured using the primers shown in the Table. To allow comparison between samples, the expression data for each of the genes was normalized to the expression of glyceraldehyde-3-phosphate dehydrogenase (GAPDH), which was always run in parallel.
Table 3: Comparisons of GH response in liver and in primary hepatocytes
Genes in vivo hepatocytes
Array RT-PCR Array RT-PCR
Phyh 0.34 0.6 0.54 0.6
Hsd11β1 0.31 0.28 0.63 0.5
Ppp3ca 1.33 1.43 1.48 1.33
CD36 2.39 2.78 1.26 2.07
Microarray and RT-PCR expression measurements for phytanoyl-CoA hydroxylase (Phyh), hydroxysteroid 11-beta dehydrogenase 1
(Hsd11β1), the catalytic subunit of protein phosphatase 3, alpha
isoform (Ppp3cα) and fatty acid translocase/CD36 antigen (FAT/
CD36). The real-time PCR results were normalized to GAPDH. The
ratios between treated and untreated samples in vivo (young male rats
A comparison of all experiments included in the study
Figure 1
A comparison of all experiments included in the study. a) Hierarchical clustering of hepatic gene expression profiles using average linkage analysis and the Euclidean distance metric clusters together the in vivo experiments concerning GH. The included experiments were: E_male_5d: 17-α-ethinylestradiol treatment of male rats for 1 day, young_GH_7d: infusion of bovine growth hormone (bGH) in young (3 months) male rats for 7 days, old_GH_21d: infusion of human growth hormone (hGH) in old (2 years) male rats for 3 weeks, hep_GH_24h: bGH treatment of primary hepatocytes from young (2 months) male rats for 24 hours, F/M_rat: comparison of untreated female and malerat livers, and T3_2h: thyroid hormone treatment of hypothyroid mice for 2 hours. b) Correlation coefficients of the different expression profiles to the profile of young GH-treated male rats. The strongest correlation is found between GH-GH-treated young and old male rats, and also between young males treated with GH and female rats. The in vitro GH-treatment of isolated primary rat hepatocytes is also similar to the in vivo situation. c) Correlation coefficients of the different expression profiles to the female/male comparison. The strongest cor-relation is found between the female profile and GH-treated young and old male rats. Estrogen treatment of male rats shows lower correlation to gender.
T3 2 hours
Hepatocytes GH 24 hours
Young male GH 7 days
Old male GH 21 days
Female/male
Estrogen male 1 day T3 2 hours
Hepatocytes GH 24 hours
Young male GH 7 days
Old male GH 21 days
Female/male
Estrogen male 1 day
0 0.2 0.4 0.6 0.8 1
hep_24h_GHyoung_G H_7d T3_2h
old_G H_21d F/
M
E_m ale_1d
A
C
hep_24h_G H
young_G H_7d T3_2h
old_G H_21d F/
M
E_m ale_1
d
B
0 0.2 0.4 0.6 0.8 1
Correlation Coef
ficient
Correlation Coef
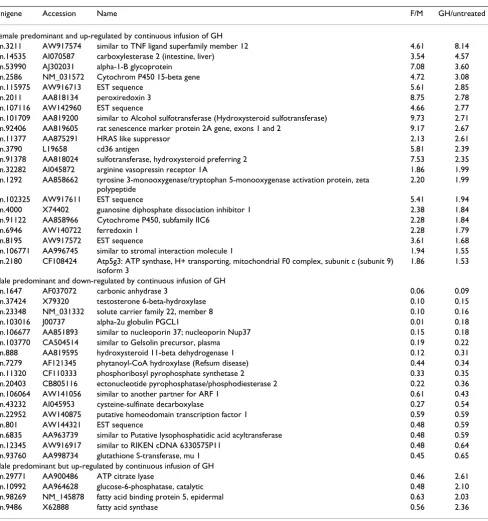
sion in 3 month old males. Similarly, around 34% of the male-enriched transcripts were down-regulated in males by the same treatment. Few genes (less than 4% of the male-enriched and none of the female-enriched) were
affected in the opposite direction by continuous treat-ment with GH. On the other hand, estrogen treattreat-ment in 3 month old male rats induced the expression of 27% of the female-enriched genes, and repressed the expression
Table 4: Genes with a gender-differentiated expression pattern that were also affected in male rats continuously infused with GH.
Unigene Accession Name F/M GH/untreated
Female predominant and up-regulated by continuous infusion of GH
Rn.3211 AW917574 similar to TNF ligand superfamily member 12 4.61 8.14
Rn.14535 AI070587 carboxylesterase 2 (intestine, liver) 3.54 4.57
Rn.53990 AJ302031 alpha-1-B glycoprotein 7.08 3.60
Rn.2586 NM_031572 Cytochrom P450 15-beta gene 4.72 3.08
Rn.115975 AW916713 EST sequence 5.61 2.85
Rn.2011 AA818134 peroxiredoxin 3 8.75 2.78
Rn.107116 AW142960 EST sequence 4.66 2.77
Rn.101709 AA819200 similar to Alcohol sulfotransferase (Hydroxysteroid sulfotransferase) 9.73 2.71
Rn.92406 AA819605 rat senescence marker protein 2A gene, exons 1 and 2 9.17 2.67
Rn.11377 AA875291 HRAS like suppressor 2.13 2.61
Rn.3790 L19658 cd36 antigen 5.81 2.39
Rn.91378 AA818024 sulfotransferase, hydroxysteroid preferring 2 7.53 2.35
Rn.32282 AI045872 arginine vasopressin receptor 1A 1.86 1.99
Rn.1292 AA858662 tyrosine 3-monooxygenase/tryptophan 5-monooxygenase activation protein, zeta
polypeptide
2.20 1.99
Rn.102325 AW917611 EST sequence 5.41 1.94
Rn.4000 X74402 guanosine diphosphate dissociation inhibitor 1 2.38 1.84
Rn.91122 AA858966 Cytochrome P450, subfamily IIC6 2.28 1.84
Rn.6946 AW140722 ferredoxin 1 2.28 1.79
Rn.8195 AW917572 EST sequence 3.61 1.68
Rn.106771 AA996745 similar to stromal interaction molecule 1 1.94 1.55
Rn.2180 CF108424 Atp5g3: ATP synthase, H+ transporting, mitochondrial F0 complex, subunit c (subunit 9)
isoform 3
1.86 1.53
Male predominant and down-regulated by continuous infusion of GH
Rn.1647 AF037072 carbonic anhydrase 3 0.06 0.09
Rn.37424 X79320 testosterone 6-beta-hydroxylase 0.10 0.15
Rn.23348 NM_031332 solute carrier family 22, member 8 0.10 0.16
Rn.103016 J00737 alpha-2u globulin PGCL1 0.01 0.18
Rn.106677 AA851893 similar to nucleoporin 37; nucleoporin Nup37 0.15 0.18
Rn.103770 CA504514 similar to Gelsolin precursor, plasma 0.19 0.22
Rn.888 AA819595 hydroxysteroid 11-beta dehydrogenase 1 0.12 0.31
Rn.7279 AF121345 phytanoyl-CoA hydroxylase (Refsum disease) 0.44 0.34
Rn.11320 CF110333 phosphoribosyl pyrophosphate synthetase 2 0.33 0.35
Rn.20403 CB805116 ectonucleotide pyrophosphatase/phosphodiesterase 2 0.22 0.36
Rn.106064 AW141056 similar to another partner for ARF 1 0.61 0.43
Rn.43232 AI045953 cysteine-sulfinate decarboxylase 0.27 0.54
Rn.22952 AW140875 putative homeodomain transcription factor 1 0.59 0.59
Rn.801 AW144321 EST sequence 0.48 0.59
Rn.6835 AA963739 similar to Putative lysophosphatidic acid acyltransferase 0.48 0.59
Rn.12345 AW916917 similar to RIKEN cDNA 6330575P11 0.48 0.64
Rn.93760 AA998734 glutathione S-transferase, mu 1 0.45 0.65
Male predominant but up-regulated by continuous infusion of GH
Rn.29771 AA900486 ATP citrate lyase 0.46 2.61
Rn.10992 AA964628 glucose-6-phosphatase, catalytic 0.48 2.10
Rn.98269 NM_145878 fatty acid binding protein 5, epidermal 0.63 2.03
Rn.9486 X62888 fatty acid synthase 0.56 2.36
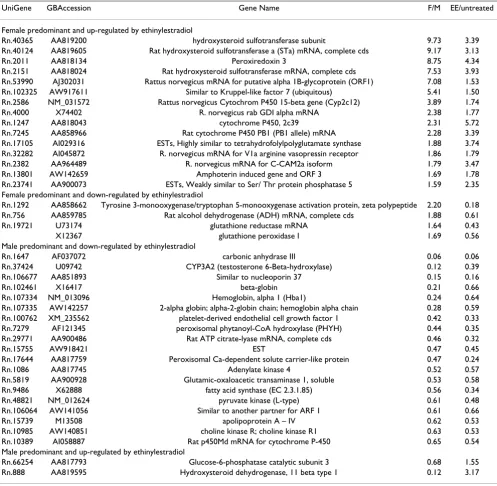
of 27% of the male-enriched ones (Table 5). Again, few genes (less than 7% of the gender differentiated) were affected in the opposite direction by treatment with estro-gen. This data strongly suggest that both estrogen and GH significantly contribute to the gender differences in adult rat liver. Although, as illustrated in Figure 1c, one week of continuous infusion with GH is more efficient than an
injection with 17-alpha-ethynilestradiol to feminize the adult male rat liver expression profile.
T3 and GH regulate lipogenic genes in liver
Both GH and T3 are required for longitudinal growth. Therefore, we expected these hormones to have some overlapping effects on liver gene expression. Nevertheless,
Table 5: Genes with a gender differentiated expression pattern that were also affected in male rats treated with 17-α ethinyl-estradiol (EE).
UniGene GBAccession Gene Name F/M EE/untreated
Female predominant and up-regulated by ethinylestradiol
Rn.40365 AA819200 hydroxysteroid sulfotransferase subunit 9.73 3.39
Rn.40124 AA819605 Rat hydroxysteroid sulfotransferase a (STa) mRNA, complete cds 9.17 3.13
Rn.2011 AA818134 Peroxiredoxin 3 8.75 4.34
Rn.2151 AA818024 Rat hydroxysteroid sulfotransferase mRNA, complete cds 7.53 3.93
Rn.53990 AJ302031 Rattus norvegicus mRNA for putative alpha 1B-glycoprotein (ORF1) 7.08 1.53
Rn.102325 AW917611 Similar to Kruppel-like factor 7 (ubiquitous) 5.41 1.50
Rn.2586 NM_031572 Rattus norvegicus Cytochrom P450 15-beta gene (Cyp2c12) 3.89 1.74
Rn.4000 X74402 R. norvegicus rab GDI alpha mRNA 2.38 1.77
Rn.1247 AA818043 cytochrome P450, 2c39 2.31 5.72
Rn.7245 AA858966 Rat cytochrome P450 PB1 (PB1 allele) mRNA 2.28 3.39
Rn.17105 AI029316 ESTs, Highly similar to tetrahydrofolylpolyglutamate synthase 1.88 3.74
Rn.32282 AI045872 R. norvegicus mRNA for V1a arginine vasopressin receptor 1.86 1.79
Rn.2382 AA964489 R. norvegicus mRNA for C-CAM2a isoform 1.79 3.47
Rn.13801 AW142659 Amphoterin induced gene and ORF 3 1.69 1.78
Rn.23741 AA900073 ESTs, Weakly similar to Ser/ Thr protein phosphatase 5 1.59 2.35
Female predominant and down-regulated by ethinylestradiol
Rn.1292 AA858662 Tyrosine 3-monooxygenase/tryptophan 5-monooxygenase activation protein, zeta polypeptide 2.20 0.18
Rn.756 AA859785 Rat alcohol dehydrogenase (ADH) mRNA, complete cds 1.88 0.61
Rn.19721 U73174 glutathione reductase mRNA 1.64 0.43
X12367 glutathione peroxidase I 1.69 0.56
Male predominant and down-regulated by ethinylestradiol
Rn.1647 AF037072 carbonic anhydrase III 0.06 0.06
Rn.37424 U09742 CYP3A2 (testosterone 6-Beta-hydroxylase) 0.12 0.39
Rn.106677 AA851893 Similar to nucleoporin 37 0.15 0.16
Rn.102461 X16417 beta-globin 0.21 0.66
Rn.107334 NM_013096 Hemoglobin, alpha 1 (Hba1) 0.24 0.64
Rn.107335 AW142257 2-alpha globin; alpha-2-globin chain; hemoglobin alpha chain 0.28 0.59
Rn.100762 XM_235562 platelet-derived endothelial cell growth factor 1 0.42 0.33
Rn.7279 AF121345 peroxisomal phytanoyl-CoA hydroxylase (PHYH) 0.44 0.35
Rn.29771 AA900486 Rat ATP citrate-lyase mRNA, complete cds 0.46 0.32
Rn.15755 AW918421 EST 0.47 0.45
Rn.17644 AA817759 Peroxisomal Ca-dependent solute carrier-like protein 0.47 0.24
Rn.1086 AA817745 Adenylate kinase 4 0.52 0.57
Rn.5819 AA900928 Glutamic-oxaloacetic transaminase 1, soluble 0.53 0.58
Rn.9486 X62888 fatty acid synthase (EC 2.3.1.85) 0.56 0.34
Rn.48821 NM_012624 pyruvate kinase (L-type) 0.61 0.48
Rn.106064 AW141056 Similar to another partner for ARF 1 0.61 0.66
Rn.15739 M13508 apolipoprotein A – IV 0.62 0.53
Rn.10985 AW140851 choline kinase R; choline kinase R1 0.63 0.53
Rn.10389 AI058887 Rat p450Md mRNA for cytochrome P-450 0.65 0.54
Male predominant and up-regulated by ethinylestradiol
Rn.66254 AA817793 Glucose-6-phosphatase catalytic subunit 3 0.68 1.55
Rn.888 AA819595 Hydroxysteroid dehydrogenase, 11 beta type 1 0.12 3.17
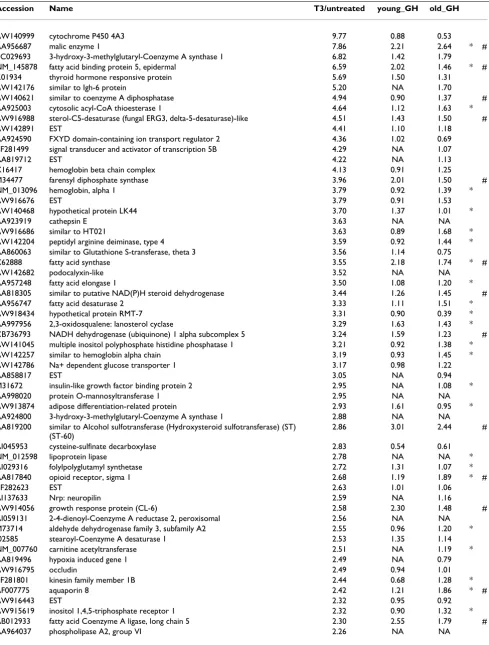
Table 6: T3 and GH have overlapping effects on gene expression in liver.
Accession Name T3/untreated young_GH old_GH
AW140999 cytochrome P450 4A3 9.77 0.88 0.53
AA956687 malic enzyme 1 7.86 2.21 2.64 * #
BC029693 3-hydroxy-3-methylglutaryl-Coenzyme A synthase 1 6.82 1.42 1.79
NM_145878 fatty acid binding protein 5, epidermal 6.59 2.02 1.46 * #
K01934 thyroid hormone responsive protein 5.69 1.50 1.31
AW142176 similar to Igh-6 protein 5.20 NA 1.70
AW140621 similar to coenzyme A diphosphatase 4.94 0.90 1.37 #
AA925003 cytosolic acyl-CoA thioesterase 1 4.64 1.12 1.63 *
AW916988 sterol-C5-desaturase (fungal ERG3, delta-5-desaturase)-like 4.51 1.43 1.50 #
AW142891 EST 4.41 1.10 1.18
AA924590 FXYD domain-containing ion transport regulator 2 4.36 1.02 0.69
BF281499 signal transducer and activator of transcription 5B 4.29 NA 1.07
AA819712 EST 4.22 NA 1.13
X16417 hemoglobin beta chain complex 4.13 0.91 1.25
M34477 farensyl diphosphate synthase 3.96 2.01 1.50 #
NM_013096 hemoglobin, alpha 1 3.79 0.92 1.39 *
AW916676 EST 3.79 0.91 1.53
AW140468 hypothetical protein LK44 3.70 1.37 1.01 *
AA923919 cathepsin E 3.63 NA NA
AW916686 similar to HT021 3.63 0.89 1.68 *
AW142204 peptidyl arginine deiminase, type 4 3.59 0.92 1.44 *
AA860063 similar to Glutathione S-transferase, theta 3 3.56 1.14 0.75
X62888 fatty acid synthase 3.55 2.18 1.74 * #
AW142682 podocalyxin-like 3.52 NA NA
AA957248 fatty acid elongase 1 3.50 1.08 1.20 *
AA818305 similar to putative NAD(P)H steroid dehydrogenase 3.44 1.26 1.45 #
AA956747 fatty acid desaturase 2 3.33 1.11 1.51 *
AW918434 hypothetical protein RMT-7 3.31 0.90 0.39 *
AA997956 2,3-oxidosqualene: lanosterol cyclase 3.29 1.63 1.43 *
CB736793 NADH dehydrogenase (ubiquinone) 1 alpha subcomplex 5 3.24 1.59 1.23 #
AW141045 multiple inositol polyphosphate histidine phosphatase 1 3.21 0.92 1.38 *
AW142257 similar to hemoglobin alpha chain 3.19 0.93 1.45 *
AW142786 Na+ dependent glucose transporter 1 3.17 0.98 1.22
AA858817 EST 3.05 NA 0.94
M31672 insulin-like growth factor binding protein 2 2.95 NA 1.08 *
AA998020 protein O-mannosyltransferase 1 2.95 NA NA
AW913874 adipose differentiation-related protein 2.93 1.61 0.95 *
AA924800 3-hydroxy-3-methylglutaryl-Coenzyme A synthase 1 2.88 NA NA
AA819200 similar to Alcohol sulfotransferase (Hydroxysteroid sulfotransferase) (ST)
(ST-60)
2.86 3.01 2.44 #
AI045953 cysteine-sulfinate decarboxylase 2.83 0.54 0.61
NM_012598 lipoprotein lipase 2.78 NA NA *
AI029316 folylpolyglutamyl synthetase 2.72 1.31 1.07 *
AA817840 opioid receptor, sigma 1 2.68 1.19 1.89 * #
BF282623 EST 2.63 1.01 1.06
AI137633 Nrp: neuropilin 2.59 NA 1.16
AW914056 growth response protein (CL-6) 2.58 2.30 1.48 #
AI059131 2-4-dienoyl-Coenzyme A reductase 2, peroxisomal 2.56 NA NA
M73714 aldehyde dehydrogenase family 3, subfamily A2 2.55 0.96 1.20 *
J02585 stearoyl-Coenzyme A desaturase 1 2.53 1.35 1.14
NM_007760 carnitine acetyltransferase 2.51 NA 1.19 *
AA819496 hypoxia induced gene 1 2.49 NA 0.79
AW916795 occludin 2.49 0.94 1.01
BF281801 kinesin family member 1B 2.44 0.68 1.28 *
AF007775 aquaporin 8 2.42 1.21 1.86 * #
AW916443 EST 2.32 0.95 0.92
AW915619 inositol 1,4,5-triphosphate receptor 1 2.32 0.90 1.32 *
AB012933 fatty acid Coenzyme A ligase, long chain 5 2.30 2.55 1.79 #
we found that similarities were limited to a small number of genes (indicated with a # in Table 6). A comparison of frequency distribution among gene ontology (GO) cate-gories related to the biological function between the whole set of expressed genes and those up-regulated by T3 and GH revealed a statistically significant overrepresenta-tion (p < 0.05) of regulated genes in the category of lipid metabolism. Similar overrepresentation of genes involved in lipogenesis was identified among the genes induced by thyroid hormone.
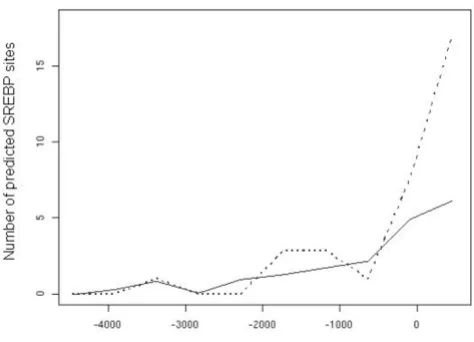
The SREBP family of transcriptional regulators plays an essential role in the regulation of lipogenesis and is known to regulate several of the genes found to be induced by thyroid hormone (Table 6) [17]. Because the transcriptional effects of T3 were rapid, we hypothesize the existence of a direct mechanistic crosstalk between SREBPs and T3 signaling in mouse liver. Therefore, we analyzed the promoter regions of T3-induced genes to find out whether any consensus SREBP binding sites could be found in promoter regions. The genes that were included in this analysis are indicated with a * in Table 5. Interestingly, we could identify a clear overrepresentation of putative SREBP binding sites around the transcriptional start site in the T3-regulated group compared to the con-trol group (Figure 2). To make sure that this result was not only due to higher phylogenetic conservation in the T3-regulated group, a basic statistic analysis was performed: the region from -500 to +100 relative the transcriptional start sites (TSS) was picked out of each alignment in both groups. A simple two-sided t-test of the mean conserva-tion in both groups showed that they were not signifi-cantly different (p = 0.12). In fact, the T3-regulated group had a slightly lower (but not statistically significant) mean degree of conservation than the control group. We tested if the distribution of SREBP sites was significantly differ-ent between the two groups using Chi-square analysis. As
the number of genes in the control group was higher, this distribution was normalized to correspond to 30 genes instead of the original 300 controls. The test demonstrates conclusively (p = 0.0001) that the two distributions are different and thus that there is a clear overrepresentation of putative SREBP binding sites near the TSSs in the T3-regulated group (Figure 2). In contrast, we were not able
AI044427 similar to myotonic dystrophy protein kinase 2.17 NA 1.20 *
AW913988 GTP cyclohydrolase 1 2.17 0.83 1.29 *
M95591 farnesyl diphosphate farnesyl transferase 1 2.16 1.02 1.15 *
AA998726 nasal embryonic LHRH factor 2.12 NA 0.92 *
AW916626 EST 2.09 1.07 0.90
AW140633 hemoglobin Y, beta-like embryonic chain 2.08 0.97 1.37
AA926032 enoyl coenzyme A hydratase 1 2.05 0.91 1.19 *
AA925091 fatty acid binding protein 4 2.01 NA NA
AA925731 isocitrate dehydrogenase 1 2.00 NA NA *
All of the genes in this list were up-regulated by T3 in hypothyroid mice (ratio repeatedly larger than 2). Clones that did not map to any Unigene cluster were removed. The genes that were included in the promoter analysis, where mouse and human orthologs could be found, are indicated
with a *. The genes that were up-regulated by continuous infusion of GH in at least one of the in vivo models in a statistically significant manner are
indicated with a #. The table shows Unigene ID, GenBank accession number, gene name, and the median ratio (treated/untreated). "NA" means that the gene was flagged away in the analysis due to low expression in two or more hybridizations. The shown experiments are: T3: thyroid hormone treatment of hypothyroid mice for 2 hours; Young GH: infusion of bovine growth hormone (bGH) in young (3 months) male rats for 7 days; Old GH: infusion of human growth hormone (hGH) in old (2 years) male rats for 3 weeks.
Table 6: T3 and GH have overlapping effects on gene expression in liver. (Continued)
Promoter analysis of T3-regulated genes
Figure 2
to localize a significant overrepresentation of thyroid hor-mone response elements (TREs) in the close promoters of the T3-regulated genes. We can not exclude that TREs exist in the promoters of these genes, but either they are located further away from the transcriptional initiation sites or in areas that are not phylogenetically conserved between mice and humans.
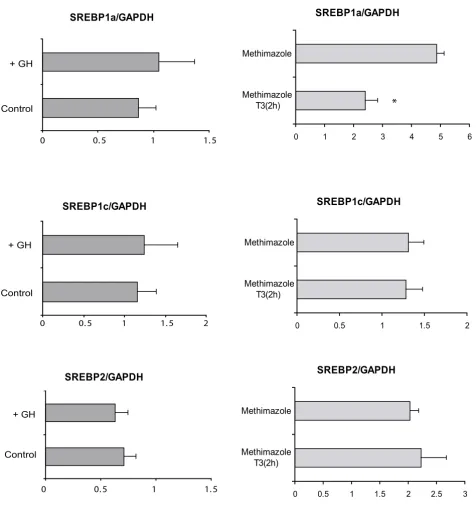
Three different SREBP isoforms, 1a, 1c and 2, encoded by two distinct genes have been described. SREBP1c is the predominant form in adult liver and adipocytes [17]. SREBPs are translated as large precursors tethered to the endoplasmic reticulum and nuclear membrane where they, in response to sterol depletion, are proteolytically cleaved into mature, transcriptionally active factors that migrate to the nucleus and bind sterol regulatory elements of specific genes [18]. The mechanisms whereby T3 regu-late SREBP actions have been previously studied but remain unclear. Long-term treatment with T3 has been shown to induce SREBP2 expression in hepatocytes [19]. We tested whether rapid transcriptional induction could account for the observed up-regulation of lipogenic genes. As shown in Figure 3, T3 treatment had no effect on SREBP1c or SREBP2 mRNA levels whereas the expression of SREBP1a was significantly reduced. The results demon-strate that rapid transcriptional induction of SREBPs is not the mechanism behind the T3 regulation of lipogenic genes. Since the set of genes overlapping between T3 and GH contained mostly genes involved in lipid metabolism, we also analyzed the transcriptional induction of SREBP1a, 1c and 2 after long term GH treatment, but failed to detect any significant effect that could explain the up-regulation of lipogenic genes (Figure 3).
We next explored whether early events in SREBP activa-tion, such as the proteolytic processing of endoplasmic reticulum (ER) resident SREBPs could be regulated by T3. The ER and nuclear forms of SREBP1 were measured before and after T3 treatment. The analysis was extended to study the effects of GH treatment. The Western blots in Figure 4 show a decrease in the concentration of ER bound (high molecular weight) SREBP1, indicating a rapid activation of its proteolytic processing by T3. No sig-nificant effect of T3 could be detected for SREBP2 (data not shown). Interestingly, the concentration of the nuclear (short) form of SREBP1 was also reduced indicat-ing that the total nuclear concentration of SREBP1 poorly reflects its activity as judged by the transcriptional induc-tion of target genes. In contrast to the findings with thy-roid hormone, the effect of GH doesn't seem to be exerted through similar mechanisms since no significant changes in ER or nuclear SREBP levels were evident after GH treat-ment (Figure 4). It is therefore possible that alternative mechanisms such as RNA stability or even the activation
of other transcription factors account for the GH effects on lipogenic genes.
Discussion
Here, we have attempted an analysis of a compilation of expression profiles to gain insight into the hormonal reg-ulation of liver gene expression. We demonstrated that a positive correlation exists between the effects of GH treat-ment in primary hepatocytes cultured on matrigel and those detected in vivo. Nevertheless, the correlation was not very high despite the care taken of cultivating the hepatocytes on matrigel to avoid de-differentiation. We know from previous studies that hepatocytes cultured on matrigel express GH receptors, that GH signalling through the JAK2/STAT5 pathway is functional and that GH induces IGF-1, a well- known GH regulated gene in vivo
[25]. Therefore, the differences between the in vivo and in vitro models are likely due to structural and systemic fac-tors found in intact liver which would be required for the full extension of GH actions. On the other hand, our data demonstrate that primary hepatocytes cultured on matrigel do provide a model to study some GH activated mechanisms; those directly related to the activation of the GH receptor and its signaling molecules. The newly described GH regulated genes in hepatocytes (Table 3): phytanoyl-CoA hydroxylase (Phyh), hydroxysteroid 11-beta dehydrogenase 1 (Hsd11b1), the catalytic subunit of protein phosphatase 3, alpha isoform (Ppp3ca) and fatty acid translocase/CD36 antigen (FAT/CD36) constitute new target genes that could be used to study the basis of transcriptional regulation by GH in hepatocytes.
Effects of GH and T3 on SREBP expression measured by real-time PCR
Figure 3
Effects of GH and T3 on SREBP expression measured by real-time PCR. Two hours after thyroid hormone treat-ment of hypothyroid mice, SREBP1a expression is down-regulated, while SREBP1c and 2 are unaffected. Expression of SREBP1a, 1c and 2 is not affected after 7 days of bGH infusion in young male rats. * p < 0.005.
0 0. 5 1 1. 5 2
Control + GH
0 0. 5 1 1. 5
+ GH
0 0. 5 1 1. 5
Control Control
+ GH
SREBP1c/GAPDH
0 0.5 1 1.5 2
Methimazole T3(2h) Methimazole
SREBP1a/GAPDH
0 1 2 3 4 5 6
Methimazole T3(2h) Methimazole
SREBP2/GAPDH
0 0.5 1 1.5 2 2.5 3 Methimazole
T3(2h) Methimazole
*
SREBP1a/GAPDHSREBP1c/GAPDH
transcription factors have been identified, including female predominant HNF-6 [24] and male predominant STAT5b [25]. Nevertheless, an analysis of promoter sequences of the genes identified in Table 4 has failed to identify any significant overrepresentation of HNF-6 or STAT5 consensus binding sites (data not shown).
There-fore, further analyses are required to better understand the molecular mechanism behind the feminizing actions of GH in liver.
Both GH and thyroid hormone are required for longitudi-nal growth [26]. The coordinate actions of these
hor-Effects of GH and T3 on SREBP1 processing
Figure 4
Effects of GH and T3 on SREBP1 processing. A Western blot showing hypothyroid mice livers with or without a T3-injection 2 hours prior to measurement. In the T3-treated samples, there is a decreased concentration of high molecular weight (ER bound) SREBP1, indicating an activation of its proteolytic processing by T3.
Methimazole
SREBP1
T3 (2h)
+
+
+
+
+
+
+
+
+
+
64
128
-+
+
+
+
+
--SREBP1
-nSREBP1
-SREBP1
-nSREBP1
64
-
51128
-GH
+
+
+
+
-
-
-
-SREBP1
mones are achieved through multiple mechanisms. Thyroid hormone is a key activator of GH secretion in the pituitary gland while GH promotes the formation of T3 from less active T4 in peripheral tissues [27]. Through the comparisons of expression profiles, we could identify a small group of genes that were up-regulated by both hor-mones. Most of the genes were assigned to the category of lipid metabolism by unbiased classification based on the current gene ontology. This is in agreement to the known lipogenic effects of both hormones in liver [7,10,28]. The correlation between GH and T3 effects was small which could be due to important differences in experimental design as well as to mechanistic differences. Therefore, the study of the long term effects of T3 treatment has the potential to identify more overlapping effects.
The effects of T3 described herein are produced after 2 hours of treatment and are likely to be direct hormonal effects on the liver. Therefore, we analyzed the proximal promoter of genes rapidly regulated by T3 to gain further insight into the mechanisms of hepatic T3 actions. Inter-estingly, we were not able to localize a significant overrep-resentation of TREs in the close promoters of the T3-regulated genes. On the other hand, we found a clear over-representation of putative SREBP binding sites; in agree-ment with the lipogenic nature of the T3-regulated genes. Further analysis did not detect any transcriptional induc-tion of SREBPs by T3. Instead, we showed that T3 decrease the concentration of ER-bound SREBP1, probably due to induction of its proteolytic processing. Regulation of SREBP activity by T3 seems to be complex and involves multiple mechanisms. The thyroid hormone receptor (TR) and active SREBP1c can cooperate to activate the transcription of a single gene even when their response elements are situated very far apart [29]. Moreover, direct interaction between TR alpha and the active form of SREBP1 has been demonstrated when their binding sites are closely located in the promoter of the chicken acetyl-CoA carboxylase-α gene [30]. Direct interactions between TR and ER-resident SREBPs are unlikely to be responsible for the effect observed in this study since the two proteins have different intracellular localizations [31]. Neverthe-less, this possibility can not be completely discarded since 10% of TRs are found in the cytosol both in the absence or presence of T3 [31]. Non-genomic effects of T3 such as the activation of PI-3 kinase, MEK and STAT transcription factors have been reported in several systems [32]. Whether the rapid induction of SREBP1 processing by T3 is due to a non-genomic mechanism of T3 action, or not, remains to be demonstrated. SREBP proteolyticactivation in the Golgi is regulated by its interaction with SCAP and Insig-1 and -2 [33]. When sterols are present at high con-centrations, the SCAP/SREBP complex is retained in the ER. When the sterol concentration is reduced, SCAP does not interact with Insig and the SCAP/SREBP complex exits
the ER and is delivered to the Golgi where it is proteolyti-cally cleaved. A role of SCAP as a monitor of the compo-sition of the cytoplasmic leaflet of the ER membrane has been proposed [33]. Since T3 has been shown to bind the outer half of the lipid bilayer in reconstituted microsomes [34], there is a hypothetical possibility that T3 could bind ER membranes and regulate SCAP activity. It is important to notice that the concentration of the nuclear (short) form of SREBP1 was also reduced upon T3 treatment. Why this occurs simultaneously to the transcriptional induction of SREBP target genes is unknown but a recent publication indicates that transcriptionally active SREBP1 is rapidly targeted for proteosomal degradation [35]. If this mechanism is at play, one would expect the effects of T3 on lipogenic genes expression to be transient. This is indeed the case, most of the T3 effects on lipogenic genes can not be found after 5 days of hormonal treatment [10]. Future studies will clarify the importance of SREBPs for thyroid hormone liver actions.
Conclusion
In summary, we have analyzed six different experiments concerning the hepatic actions of GH, T3, estrogen and gender. We could conclude that GH and estrogen are both important determinants of gender-related differences in hepatic gene expression, that GH and T3 have overlapping effects on the regulation of several lipogenic genes, and that some T3 effects in the liver may be mediated through the induction of proteolytic processing of SREBP1. Through EndoGED and its web-based interface, we have made available a large data set of transcript profiles related to the actions of several hormones in different in vivo and in vitro models. This resource is of special interest for the endocrine researcher offering the possibility of in depth exploration of hormonal transcriptional actions and interactions. In the same way, here exemplified by the analysis of hormone actions in liver, the actions of other hormones can be explored to generate testable hypotheses of relevance to endocrine research.
Methods
Experimental design
hybridiza-tions were performed on arrays larger than the ones described in the previously published studies. At least 4 statistically independent microarray measurements were used to characterize each physiological situation; with the exception of the experiment where thyroid hormone actions were studied where RNA pooled from 5 different mice was used. Other experiments included in this study have not previously been described. Primary hepatocytes were isolated from young male rats and cultured on matrigel as described previously[16]. The cells were grown in serum-free William's media E (Invitrogen, CA) supple-mented with 55 µg/ml ascorbic acid (Sigma-Aldrich, MO), 100 IU/ml streptomycin and 1 µg/ml insulin (Sigma-Aldrich, MO) for two days before adding 100 ng/ ml bGH (National Hormone and Peptide Program, A.F. Parlow, USA) to the media. GH-treated and untreated cells were harvested 24 hours later in Trizol (Invitrogen, CA), and RNA was purified according to the manufac-turer's protocol. The procedure was repeated with cells isolated from different rats. In another experiment, 3 months old male rats were injected with 17-α -ethi-nylestradiol (5 mg/kg body weight; Sigma-Aldrich, MO) or vehicle 24 hours before sacrifice. Total RNA was iso-lated using Trizol (Invitrogen, CA). All animal experi-ments used in these studies were approved by the local ethical committee.
cDNA microarrays, probe preparation and hybridization The cDNA microarrays used in this study were produced in our lab, as described previously [7]. They have, how-ever, been extended to comprise about 6200 clones, including clones from the TIGR Rat Gene Index, Research Genetics (Invitrogen, CA), and our own obtained through differential cloning experiments. The arrays were pre-hybridized in 1% BSA, 5XSSC and 0.1% SDS at 42°C for 1–2 hours, washed in milli-Q water, and dried immedi-ately before the probe was applied. Total RNA was reverse-transcribed in the presence of Cy3- or Cy5-conjugated dUTP (PerkinElmer, MA) and purified as described previ-ously [13]. In all studies except the one with T3-treated mice, RNA samples originating from livers of individual animals were labeled and each tester sample was hybrid-ized against a control sample. In the T3-study, a pool of tester samples (from 6 different T3-treated animals) was hybridized against a pool of control samples due to lim-ited availability of RNA. Dye-swaps were used in all stud-ies to reduce systematic errors [36]. The final volume was adjusted to 25 µl with hybridization buffer consisting of 3.4XSSC, 0.3% SDS, 20 µg mouse Cot1 DNA (Invitrogen, CA), 20 µg polyA RNA, and 20 µg yeast tRNA. After heat-ing at 98°C for 2 min and coolheat-ing to room temperature, the probe was added to the array and covered with a plas-tic cover slip (Grace Bio-Labs, OR). Hybridization took place at 65°C for 15–18 hours. The array was then washed and scanned with a GMS 418 scanner (Affymetrix, CA).
Data processing and analysis
Data processing was performed essentially as described previously [13]. The software GenePix Pro (Axon Instru-ments, CA) was used to quantify the fluorescence inten-sity of each spot and the surrounding background. Automatic and manual flagging were used to localize absent or very weak spots (less than 2 times above back-ground), which were excluded from analysis. The signal from each spot was calculated as the average intensity minus the average local background. We used a normali-zation method that takes into account and corrects for intensity-dependent artifacts in the measurements, the locally weighted linear regression (Lowess) method in the SMA package (Statistics for Microarray Analysis, available at http://www.stat.berkeley.edu/users/terry/Group/soft ware.html) [36]. SMA is an add-on library written in the statistical language R.
We next used EndoGED to extract all expressed hepatic genes from the included experiments concerning hor-mone treatment of rodents. In total, 6096 transcripts were expressed in one or more hybridizations. Hierarchical clustering using the TIGR Multiexperiment Viewer (MeV) software (available at http://www.tigr.org[37]) was per-formed to explore and compare the different hormone treatments in the generated gene expression matrix. The euclidean distance was used as distance metric. We first compared the usage of ratios from all hybridizations with the usage of just the median log2 ratio for each set of rep-licated measurements (experiment group). These strate-gies gave similar results in the clustering, grouping the replicated measurements closely together. The median rather than the mean ratio was used to minimize the influ-ence of outliers. Therefore, we calculated the median log2 ratio for each transcript within each experiment group, and used this ratio for further analysis. Genes that were detected in only half of the replicated measurements, or less, were excluded since we did not consider these meas-urements reliable. Included in the hierarchical clustering were only genes that had four or more median expression ratios from the six experiment groups (2518 genes). Using the same dataset with median ratios from each experi-ment group, we also calculated the correlation coefficient between the different experiment groups.
web-based tool eGOn (developed at the Norwegian University of Science and Technology, available at http:// nova2.idi.ntnu.no/egon/) to functionally classify the tran-scripts. With the two-sided one-sample binomial test implemented in eGOn, we compared the list of differen-tially expressed genes to all genes expressed in the T3 and GH experiments. The same software was also used to clas-sify all T3-regulated genes (at least 2-fold up-regulation), and to compare them to all genes expressed in the experi-ments regarding T3. For the comparisons between gender differentiated genes and the effects of GH and estrogen, a mean ratio cutoff (log2 ratio treated/untreated >0.58, cor-responding to at least 1.5-fold difference) was applied on top of the SAM statistical criteria.
Brief description of EndoGED
The EndoGED system includes a Lab Information Man-agement System (LIMS) to manage array fabrication, and modules to collect, store and process gene expression data concerning the actions of hormones. The system offers a flexible solution to integrate external analysis tools, including possibilities to store transformed expression values (e.g. normalized ratios) and associated parameters derived from statistical evaluation. The systems run on Microsoft operating system and have a client-server archi-tecture implemented in SQL-Server as the database engine and Borland Delphi for the program modules. In the data-base design, we have taken into consideration the latest MIAME recommendations from the MGED Society regarding microarray data description [39]. We have implemented a detailed description of biomaterials and treatments used in the experiments, carefully considering what information would be significant to the endocrine researcher. The exploration tools have been implemented to allow easy retrieval of relevant data through a multi-level search engine. Furthermore, we have made part of our collected data available through Internet for easy access to researchers worldwide http://www.cmm.ki.se/ EndoGED. The database structure and software are availa-ble for free to academic and other nonprofit researchers.
Real Time-PCR
The expression of some genes from the array experiments were verified using quantitative real-time PCR. The Dynamo kit (Finnzymes Oy, Finland) containing SYBR Green was used for quantification. The primers and applied annealing temperatures are listed in Table 2. The expression of all genes was normalized to glyceraldehyde-3-P dehydrogenase (GAPDH), which was always meas-ured in parallel to the other genes.
Promoter analysis
We undertook a promoter analysis of a group of genes that were all up-regulated more than 2-fold two hours after T3 treatment in hypothyroid mice. We sought to find
out if there was a statistically significant overrepresenta-tion of SREBP and TRE binding sites in the T3-regulated group of genes compared to a control group, unaffected by the treatment. We used pair wise cross-species compar-ison (phylogenetic footprinting) as described by Lenhard et al [40] to identify putative transcription factor binding sites in the regions upstream of the transcriptional start site (TSS). Comprehensive reviews covering the field of transcriptional regulation bioinformatics are available [41,42].
As the study concerned mice, we used mouse orthologs to the rat genes printed on the arrays. To locate mouse orthologs for the rat sequences, we aligned the rat sequences to the mouse genome (NCBI build 30) using BLAT [43] and then searched for mouse cDNA sequences aligning to the same loci as the rat sequences and indicat-ing similar gene structures. Human cDNA sequences orthologous to the mouse cDNA sequences were identi-fied using the GeneLynx database [44,45]. Guided by genomic mappings of the cDNA sequences from the UCSC Genome Browser Database [46], we retrieved human (NCBI build 33) and mouse gene and promoter sequences. Since cDNA sequences are often truncated, we used consensus exon-intron structures derived from over-lapping and similar cDNA mappings. We aimed to retrieve sequence from -5000 to +100 relative to TSSs. However, to ensure that the corresponding human and mouse genomic regions were extracted, we extended this region if, in an alignment of the human and mouse gene sequences, the TSSs could not be align. In addition, to avoid inclusion of other nearby genes in the retrieved sequences, we truncated the sequences at the border of any multi-exon cDNA mapping upstream of a TSS. If such a mapping was encountered within 100 bps of a TSS, no sequence was retrieved. Genes which could not confi-dently be mapped onto either mouse or human genomes were excluded from the analysis.
We analyzed 30 genes rapidly up-regulated by T3 (indi-cated with a * in Table 6) and, as a control group, 300 expressed but unaffected genes that were randomly selected from the array. We used a 50 bp sliding window and 70% sequence conservation for the alignment win-dows. The binding model was constructed by merging two matrix models (M00220 and M00221) from the TRANS-FAC database [47]. The score cutoff for this model was set to 75%.
Western blots
blocked for 1 h at RT in TTBS (20 mM Tris-HCl, 150 mM NaCl, Tween 0.1%, pH 7.4) containing 5% skim milk powder. Membranes were incubated overnight at 4°C with an anti-SREBP1 or antiβ-actin, as a loading control (SantaCruz Biotechnology, USA). After three 10 min washes in TTBS, binding of primary antibody was visual-ized using horseradish peroxidase-conjugated secondary antibodies, and the immunolabeling was detected by an enhanced chemoluminescence (ECL) method according to the manufacturer's instructions (Pierce Chemical Com-pany, USA).
Authors' contributions
NS, LH, P.T-E, LFP and A.F-M carried out the microarray studies, NS, A.F-M and RM implemented the EndoGED database. NS carried out the expression measurements by RT-PCR. AS, BL and PS carried out the promoter analysis. AF-M carried out the Western Blot analysis. All authors read and approved the final manuscript.
Acknowledgements
We are grateful to Dr. Vennstrom for providing tissues from T3 treated mice. This work was supported by grants from the Swedish Medical Research Council, Wallenberg Consortium North, the Swedish Society of Medical Research, the Fredrik and Ingrid Thuring Foundation, the Tore Nilsson Foundation for Medical Research, the Magnus Bergvall Foundation, the Swedish Medical Association, the Loo and Hans Osterman Foundation and the Åke Wiberg Foundation, the MECD (PM98-033 to L.F.), the Minis-terio de Sanidad y Consumo (FIS 1/1000 to L.F.), and the MCYT (SAF2003-02117 to L.F.). L. H-H is recipient of predoctoral fellowship from the Min-isterio Educación, Cultura y Deportes.
References
1. Waterston RH, Lindblad-Toh K, Birney E, Rogers J, Abril JF, Agarwal P, Agarwala R, Ainscough R, Alexandersson M, An P, Antonarakis SE, Attwood J, Baertsch R, Bailey J, Barlow K, Beck S, Berry E, Birren B, Bloom T, Bork P, Botcherby M, Bray N, Brent MR, Brown DG, Brown SD, Bult C, Burton J, Butler J, Campbell RD, Carninci P, Cawley S, Chiaromonte F, Chinwalla AT, Church DM, Clamp M, Clee C, Collins FS, Cook LL, Copley RR, Coulson A, Couronne O, Cuff J, Curwen V, Cutts T, Daly M, David R, Davies J, Delehaunty KD, Deri J, Dermitza-kis ET, Dewey C, Dickens NJ, Diekhans M, Dodge S, Dubchak I, Dunn DM, Eddy SR, Elnitski L, Emes RD, Eswara P, Eyras E, Felsenfeld A, Fewell GA, Flicek P, Foley K, Frankel WN, Fulton LA, Fulton RS, Furey TS, Gage D, Gibbs RA, Glusman G, Gnerre S, Goldman N, Goodstadt L, Grafham D, Graves TA, Green ED, Gregory S, Guigo R, Guyer M, Hardison RC, Haussler D, Hayashizaki Y, Hillier LW, Hinrichs A, Hlavina W, Holzer T, Hsu F, Hua A, Hubbard T, Hunt A, Jackson I, Jaffe DB, Johnson LS, Jones M, Jones TA, Joy A, Kamal M, Karlsson EK, Karolchik D, Kasprzyk A, Kawai J, Keibler E, Kells C, Kent WJ, Kirby A, Kolbe DL, Korf I, Kucherlapati RS, Kulbokas EJ, Kulp D, Landers T, Leger JP, Leonard S, Letunic I, Levine R, Li J, Li M, Lloyd C, Lucas S, Ma B, Maglott DR, Mardis ER, Matthews L, Mauceli E, Mayer JH, McCarthy M, McCombie WR, McLaren S, McLay K, McPherson JD, Meldrim J, Meredith B, Mesirov JP, Miller W, Miner TL, Mongin E, Montgomery KT, Morgan M, Mott R, Mullikin JC, Muzny DM, Nash WE, Nelson JO, Nhan MN, Nicol R, Ning Z, Nusbaum C, O'Connor MJ, Okazaki Y, Oliver K, Overton-Larty E, Pachter L, Parra G, Pepin KH, Peterson J, Pevzner P, Plumb R, Pohl CS, Poliakov A, Ponce TC, Ponting CP, Potter S, Quail M, Reymond A, Roe BA, Roskin KM, Rubin EM, Rust AG, Santos R, Sapojnikov V, Schultz B, Schultz J, Schwartz MS, Schwartz S, Scott C, Seaman S, Searle S, Sharpe T, Sheridan A, Shownkeen R, Sims S, Singer JB, Slater G, Smit A, Smith DR, Spencer B, Stabenau A, Stange-Thomann N, Sugnet C, Suyama M, Tesler G, Thompson J, Torrents D, Trevaskis E, Tromp J, Ucla C,
Ureta-Vidal A, Vinson JP, Von Niederhausern AC, Wade CM, Wall M, Weber RJ, Weiss RB, Wendl MC, West AP, Wetterstrand K, Wheeler R, Whelan S, Wierzbowski J, Willey D, Williams S, Wilson RK, Winter E, Worley KC, Wyman D, Yang S, Yang SP, Zdobnov EM, Zody MC, Lander ES: Initial sequencing and comparative anal-ysis of the mouse genome. Nature 2002, 420(6915):520-562. 2. Lander ES, Linton LM, Birren B, Nusbaum C, Zody MC, Baldwin J,
Devon K, Dewar K, Doyle M, FitzHugh W, Funke R, Gage D, Harris K, Heaford A, Howland J, Kann L, Lehoczky J, LeVine R, McEwan P, McKernan K, Meldrim J, Mesirov JP, Miranda C, Morris W, Naylor J, Raymond C, Rosetti M, Santos R, Sheridan A, Sougnez C, Stange-Thomann N, Stojanovic N, Subramanian A, Wyman D, Rogers J, Sul-ston J, Ainscough R, Beck S, Bentley D, Burton J, Clee C, Carter N, Coulson A, Deadman R, Deloukas P, Dunham A, Dunham I, Durbin R, French L, Grafham D, Gregory S, Hubbard T, Humphray S, Hunt A, Jones M, Lloyd C, McMurray A, Matthews L, Mercer S, Milne S, Mullikin JC, Mungall A, Plumb R, Ross M, Shownkeen R, Sims S, Waterston RH, Wilson RK, Hillier LW, McPherson JD, Marra MA, Mardis ER, Fulton LA, Chinwalla AT, Pepin KH, Gish WR, Chissoe SL, Wendl MC, Delehaunty KD, Miner TL, Delehaunty A, Kramer JB, Cook LL, Fulton RS, Johnson DL, Minx PJ, Clifton SW, Hawkins T, Branscomb E, Predki P, Richardson P, Wenning S, Slezak T, Doggett N, Cheng JF, Olsen A, Lucas S, Elkin C, Uberbacher E, Frazier M, Gibbs RA, Muzny DM, Scherer SE, Bouck JB, Sodergren EJ, Worley KC, Rives CM, Gorrell JH, Metzker ML, Naylor SL, Kucherlapati RS, Nelson DL, Weinstock GM, Sakaki Y, Fujiyama A, Hattori M, Yada T, Toyoda A, Itoh T, Kawagoe C, Watanabe H, Totoki Y, Taylor T, Weissenbach J, Heilig R, Saurin W, Artiguenave F, Brottier P, Bruls T, Pelletier E, Robert C, Wincker P, Smith DR, Doucette-Stamm L, Rubenfield M, Weinstock K, Lee HM, Dubois J, Rosenthal A, Platzer M, Nyakatura G, Taudien S, Rump A, Yang H, Yu J, Wang J, Huang G, Gu J, Hood L, Rowen L, Madan A, Qin S, Davis RW, Federspiel NA, Abola AP, Proctor MJ, Myers RM, Schmutz J, Dickson M, Grimwood J, Cox DR, Olson MV, Kaul R, Shimizu N, Kawasaki K, Minoshima S, Evans GA, Athanasiou M, Schultz R, Roe BA, Chen F, Pan H, Ramser J, Lehrach H, Reinhardt R, McCombie WR, de la Bastide M, Dedhia N, Blocker H, Hornischer K, Nordsiek G, Agarwala R, Aravind L, Bai-ley JA, Bateman A, Batzoglou S, Birney E, Bork P, Brown DG, Burge CB, Cerutti L, Chen HC, Church D, Clamp M, Copley RR, Doerks T, Eddy SR, Eichler EE, Furey TS, Galagan J, Gilbert JG, Harmon C, Hay-ashizaki Y, Haussler D, Hermjakob H, Hokamp K, Jang W, Johnson LS, Jones TA, Kasif S, Kaspryzk A, Kennedy S, Kent WJ, Kitts P, Koonin EV, Korf I, Kulp D, Lancet D, Lowe TM, McLysaght A, Mikkelsen T, Moran JV, Mulder N, Pollara VJ, Ponting CP, Schuler G, Schultz J, Slater G, Smit AF, Stupka E, Szustakowski J, Mieg D, Thierry-Mieg J, Wagner L, Wallis J, Wheeler R, Williams A, Wolf YI, Wolfe KH, Yang SP, Yeh RF, Collins F, Guyer MS, Peterson J, Felsenfeld A, Wetterstrand KA, Patrinos A, Morgan MJ, Szustakowki J, de Jong P, Catanese JJ, Osoegawa K, Shizuya H, Choi S, Chen YJ: Initial sequencing and analysis of the human genome. Nature 2001, 409(6822):860-921.
Rice S, Goodstadt L, Beatson SA, Emes RD, Winter EE, Webber C, Brandt P, Nyakatura G, Adetobi M, Chiaromonte F, Elnitski L, Eswara P, Hardison RC, Hou M, Kolbe D, Makova K, Miller W, Nekrutenko A, Riemer C, Schwartz S, Taylor J, Yang S, Zhang Y, Lindpaintner K, Andrews TD, Caccamo M, Clamp M, Clarke L, Curwen V, Durbin R, Eyras E, Searle SM, Cooper GM, Batzoglou S, Brudno M, Sidow A, Stone EA, Payseur BA, Bourque G, Lopez-Otin C, Puente XS, Chakra-barti K, Chatterji S, Dewey C, Pachter L, Bray N, Yap VB, Caspi A, Tesler G, Pevzner PA, Haussler D, Roskin KM, Baertsch R, Clawson H, Furey TS, Hinrichs AS, Karolchik D, Kent WJ, Rosenbloom KR, Trumbower H, Weirauch M, Cooper DN, Stenson PD, Ma B, Brent M, Arumugam M, Shteynberg D, Copley RR, Taylor MS, Riethman H, Mudunuri U, Peterson J, Guyer M, Felsenfeld A, Old S, Mockrin S, Collins F: Genome sequence of the Brown Norway rat yields
insights into mammalian evolution. Nature 2004,
428(6982):493-521.
4. Scherf U, Ross DT, Waltham M, Smith LH, Lee JK, Tanabe L, Kohn KW, Reinhold WC, Myers TG, Andrews DT, Scudiero DA, Eisen MB, Sausville EA, Pommier Y, Botstein D, Brown PO, Weinstein JN: A gene expression database for the molecular pharmacology of cancer. Nat Genet 2000, 24(3):236-244.
5. Ross DT, Scherf U, Eisen MB, Perou CM, Rees C, Spellman P, Iyer V, Jeffrey SS, Van de Rijn M, Waltham M, Pergamenschikov A, Lee JC, Lashkari D, Shalon D, Myers TG, Weinstein JN, Botstein D, Brown PO: Systematic variation in gene expression patterns in human cancer cell lines. Nat Genet 2000, 24(3):227-235. 6. Willson TM, Moore JT: Genomics versus orphan nuclear
recep-tors--a half-time report. Mol Endocrinol 2002, 16(6):1135-1144. 7. Flores-Morales A, Stahlberg N, Tollet-Egnell P, Lundeberg J, Malek RL,
Quackenbush J, Lee NH, Norstedt G: Microarray analysis of the in vivo effects of hypophysectomy and growth hormone treatment on gene expression in the rat. Endocrinology 2001, 142(7):3163-3176.
8. Stahlberg N, Rico-Bautista E, Fisher RM, Wu X, Cheung L, Flores-Morales A, Tybring G, Norstedt G, Tollet-Egnell P: Female-pre-dominant expression of fatty acid translocase/CD36 in rat and human liver. Epub Endocrinology Dec 18; 2003.
9. Tollet-Egnell P, Flores-Morales A, Stahlberg N, Malek RL, Lee N, Norstedt G: Gene expression profile of the aging process in rat liver: normalizing effects of growth hormone replace-ment. Mol Endocrinol 2001, 15(2):308-318.
10. Flores-Morales A, Gullberg H, Fernandez L, Stahlberg N, Lee NH, Vennstrom B, Norstedt G: Patterns of liver gene expression governed by TRbeta. Mol Endocrinol 2002, 16(6):1257-1268. 11. Tellgren A, Wood TJ, Flores-Morales A, Torndal UB, Eriksson L,
Norstedt G: Differentially expressed transcripts in neoplastic hepatic nodules and neonatal rat liver studied by cDNA microarray analysis. Int J Cancer 2003, 104(2):131-138. 12. Pang ST, Dillner K, Wu X, Pousette A, Norstedt G, Flores-Morales A:
Gene expression profiling of androgen deficiency predicts a pathway of prostate apoptosis that involves genes related to oxidative stress. Endocrinology 2002, 143(12):4897-4906. 13. Dillner K, Kindblom J, Flores-Morales A, Pang ST, Tornell J, Wennbo
H, Norstedt G: Molecular characterization of prostate hyper-plasia in prolactin-transgenic mice by using cDNA represen-tational difference analysis. Prostate 2002, 52(2):139-149. 14. Dillner K, Kindblom J, Flores-Morales A, Shao R, Tornell J, Norstedt
G, Wennbo H: Gene expression analysis of prostate hyperpla-sia in mice overexpressing the prolactin gene specifically in the prostate. Endocrinology 2003, 144(11):4955-66. Epub 2003 Aug 7..
15. Tollet-Egnell P, Parini P, Stahlberg N, Lonnstedt I, Lee NH, Rudling M, Flores-Morales A, Norstedt G: Growth hormone-mediated alteration of fuel metabolism in the aged rat as determined from transcript profiles. Physiol Genomics 2004, 16(2):261-7. Epub 2003 Nov 11..
16. Tollet P, Enberg B, Mode A: Growth hormone (GH) regulation of cytochrome P-450IIC12, insulin-like growth factor-I (IGF-I), and GH receptor messenger RNA expression in primary rat hepatocytes: a hormonal interplay with insulin, IGF-I, and thyroid hormone. Mol Endocrinol 1990, 4(12):1934-1942. 17. Horton JD, Goldstein JL, Brown MS: SREBPs: activators of the
complete program of cholesterol and fatty acid synthesis in the liver. J Clin Invest 2002, 109(9):1125-1131.
18. Sakai J, Duncan EA, Rawson RB, Hua X, Brown MS, Goldstein JL: Sterol-regulated release of SREBP-2 from cell membranes
requires two sequential cleavages, one within a transmem-brane segment. Cell 1996, 85(7):1037-1046.
19. Shin DJ, Osborne TF: Thyroid hormone regulation and choles-terol metabolism are connected through Scholes-terol Regulatory Element-Binding Protein-2 (SREBP-2). J Biol Chem 2003, 278(36):34114-8. Epub 2003 Jun 26..
20. Mode A, Norstedt G: Effects of gonadal steroid hormones on the hypothalamo-pituitary-liver axis in the control of sex dif-ferences in hepatic steroid metabolism in the rat. J Endocrinol
1982, 95(2):181-187.
21. Rudling M, Norstedt G, Olivecrona H, Reihner E, Gustafsson JA, Angelin B: Importance of growth hormone for the induction of hepatic low density lipoprotein receptors. Proc Natl Acad Sci U S A 1992, 89(15):6983-6987.
22. Mode A, Tollet P, Strom A, Legraverend C, Liddle C, Gustafsson JA: Growth hormone regulation of hepatic cytochrome P450 expression in the rat. Adv Enzyme Regul 1992, 32:255-263. 23. Ahluwalia A, Clodfelter KH, Waxman DJ: Sexual dimorphism of
rat liver gene expression: regulatory role of growth hor-mone revealed by deoxyribonucleic Acid microarray analy-sis. Mol Endocrinol 2004, 18(3):747-60. Epub 2003 Dec 18.. 24. Lahuna O, Fernandez L, Karlsson H, Maiter D, Lemaigre FP, Rousseau
GG, Gustafsson J, Mode A: Expression of hepatocyte nuclear factor 6 in rat liver is sex-dependent and regulated by growth hormone. Proc Natl Acad Sci U S A 1997, 94(23):12309-12313. 25. Choi HK, Waxman DJ: Plasma growth hormone pulse
activa-tion of hepatic JAK-STAT5 signaling: developmental regula-tion and role in male-specific liver gene expression.
Endocrinology 2000, 141(9):3245-3255.
26. Kindblom JM, Gothe S, Forrest D, Tornell J, Vennstrom B, Ohlsson C: GH substitution reverses the growth phenotype but not the defective ossification in thyroid hormone receptor alpha 1-/-beta-/- mice. J Endocrinol 2001, 171(1):15-22.
27. Kuhn ER, Verheyen G, Chiasson RB, Huts C, Huybrechts L, Van den Steen P, Decuypere E: Growth hormone stimulates the periph-eral conversion of thyroxine into triiodothyronine by increasing the liver 5'-monodeiodinase activity in the fasted and normal fed chicken. Horm Metab Res 1987, 19(7):304-308. 28. Frick F, Linden D, Ameen C, Eden S, Mode A, Oscarsson J:
Interac-tion between growth hormone and insulin in the regulaInterac-tion of lipoprotein metabolism in the rat. Am J Physiol Endocrinol Metab 2002, 283(5):E1023-31.
29. Jump DB, Thelen AP, Mater MK: Functional interaction between sterol regulatory element-binding protein-1c, nuclear factor Y, and 3,5,3'-triiodothyronine nuclear receptors. J Biol Chem
2001, 276(37):34419-34427.
30. Yin L, Zhang Y, Hillgartner FB: Sterol regulatory element-bind-ing protein-1 interacts with the nuclear thyroid hormone receptor to enhance acetyl-CoA carboxylase-alpha tran-scription in hepatocytes. J Biol Chem 2002, 277(22):19554-65. Epub 2002 Mar 20..
31. Baumann CT, Maruvada P, Hager GL, Yen PM: Nuclear cytoplas-mic shuttling by thyroid hormone receptors. multiple pro-tein interactions are required for nuclear retention. J Biol Chem 2001, 276(14):11237-45. Epub 2001 Jan 4..
32. Bassett JH, Harvey CB, Williams GR: Mechanisms of thyroid hor-mone receptor-specific nuclear and extra nuclear actions.
Mol Cell Endocrinol 2003, 213(1):1-11.
33. Adams CM, Goldstein JL, Brown MS: Cholesterol-induced confor-mational change in SCAP enhanced by Insig proteins and mimicked by cationic amphiphiles. Proc Natl Acad Sci U S A 2003, 100(19):10647-52. Epub 2003 Sep 8..
34. Chehin RN, Isse BG, Rintoul MR, Farias RN: Differential trans-membrane diffusion of triiodothyronine and thyroxine in liposomes: regulation by lipid composition. J Membr Biol 1999, 167(3):251-256.
35. Sundqvist A, Ericsson J: Transcription-dependent degradation controls the stability of the SREBP family of transcription factors. Proc Natl Acad Sci U S A 2003, 100(24):13833-8. Epub 2003 Nov 13..
36. Quackenbush J: Microarray data normalization and transfor-mation. Nat Genet 2002, 32(Suppl):496-501.
Publish with BioMed Central and every scientist can read your work free of charge "BioMed Central will be the most significant development for disseminating the results of biomedical researc h in our lifetime."
Sir Paul Nurse, Cancer Research UK
Your research papers will be:
available free of charge to the entire biomedical community
peer reviewed and published immediately upon acceptance
cited in PubMed and archived on PubMed Central
yours — you keep the copyright
Submit your manuscript here:
http://www.biomedcentral.com/info/publishing_adv.asp
BioMedcentral
microarray data management and analysis. Biotechniques 2003, 34(2):374-378.
38. Tusher VG, Tibshirani R, Chu G: Significance analysis of micro-arrays applied to the ionizing radiation response. Proc Natl Acad Sci U S A 2001, 98(9):5116-21. Epub 2001 Apr 17..
39. Brazma A, Hingamp P, Quackenbush J, Sherlock G, Spellman P, Stoeckert C, Aach J, Ansorge W, Ball CA, Causton HC, Gaasterland T, Glenisson P, Holstege FC, Kim IF, Markowitz V, Matese JC, Parkin-son H, RobinParkin-son A, Sarkans U, Schulze-Kremer S, Stewart J, Taylor R, Vilo J, Vingron M: Minimum information about a microarray experiment (MIAME)-toward standards for microarray data. Nat Genet 2001, 29(4):365-371.
40. Lenhard B, Sandelin A, Mendoza L, Engstrom P, Jareborg N, Wasser-man WW: Identification of conserved regulatory elements by comparative genome analysis. J Biol 2003, 2(2):13. Epub 2003 May 22..
41. Stormo GD: DNA binding sites: representation and discovery.
Bioinformatics 2000, 16(1):16-23.
42. Wasserman WW, Sandelin A: Applied bioinformatics for the identification of regulatory elements. Nature Reviews Genetics
2004, 5(4):276-287.
43. Kent WJ: BLAT--the BLAST-like alignment tool. Genome Res
2002, 12(4):656-664.
44. Lenhard B, Wahlestedt C, Wasserman WW, Hayes WS: GeneLynx mouse: integrated portal to the mouse genome GeneLynx: a gene-centric portal to the human genome. Genome Res 2003, 13(6B):1501-1504.
45. Lenhard B, Hayes WS, Wasserman WW: GeneLynx: a gene-cen-tric portal to the human genome. Genome Res 2001, 11(12):2151-2157.
46. Karolchik D, Baertsch R, Diekhans M, Furey TS, Hinrichs A, Lu YT, Roskin KM, Schwartz M, Sugnet CW, Thomas DJ, Weber RJ, Haussler D, Kent WJ: The UCSC Genome Browser Database. Nucleic Acids Res 2003, 31(1):51-54.