UNIVERSITY OF TRENTO - ITALY
INTERNATIONAL DOCTORATE SCHOOL IN INFORMATION AND COMMUNICATION TECHNOLOGIES
P H D T H E S I S
to obtain the title ofPhD in ICT
of the University of Trento - Italy
Speciality :
Telecommunication
Defended by
Karina Mabell
Gomez Chavez
Energy Efficiency in Wireless
Access Networks: Measurements,
Models and Algorithms
Thesis Advisor: Prof. Imrich
Chlamtac
prepared at CREATE-NET Trento–Italy,
iNSPIRE
Team
defended on April, 2013
Jury :
Advisor: Prof. Imrich Chlamtac - CREATE-NET (Italy)
Co–Advisor: Prof. Fabrizio Granelli - University of Trento (Italy)
Dr. Daniele Miorandi - CREATE-NET (Italy)
Examinators: Prof. Khaldoun Al Agha - Universite Paris-Sud (France)
Prof. Jose Moreno - Carlos III University (Spain)
c
Energy Efficiency in Wireless Access Networks: Measurements, Models and Algorithms
This work is licensed under a
Creative Commons Attribution–NonCommercial–ShareAlike 3.0 Italy License. To view a copy of this license, visit the website:
Energy Efficiency in Wireless Access Networks: Measurements, Models and Algorithms
Abstract:
Wireless Telecommunication networks have become fundamental to daily activities. Today, people have access to at least one type of wireless telecommunication network. In this context, optimizing the energy consumption of wireless telecom-munications infrastructure has become a new challenge for the research community, governments and industries in order to reduce CO2 emission and operational
energy costs. This thesis investigates the power consumption of indoor/outdoor Wireless Access Devices (WADs, specifically WiFi and WiMAX access points) and provides novel techniques for improving the energy efficiency of wireless access networks. Our approach focuses on monitoring and analyzing the power consumption of WADs using real–testbed and experimental measurements in order to understand the fundamental limits and trade-offs involved. This, in turn, will be used to propose efficient techniques to reduce power consumption and to maximize the energy efficiency of wireless access networks. We introduce energino a novel hardware and software solution for real–time energy consumption monitoring in wireless networks. We also propose an experimentally–driven approach to (i) characterize typical WADs from a power consumption standpoint, (ii) develop simple and accurate power consumption models and metrics for such WADs, and (iii) design techniques to tune the power consumption of a wireless infrastructure to the actual network conditions in terms of both users density and traffic patterns. Our measurements from several real–life deployments show that (a) the power consumption of such WADs exhibits a linear dependence on the traffic until a saturation point is reached and (b) the developed techniques can deliver significant energy savings with minimal degradation in terms of the quality of service provided.
Esta tesis esta dedicada al ser maravilloso de la tierra, a quien dedico mi
primer pensamiento en la man˜ana y en ultimo pensamiento de la noche.
Por darme el amor mas puro y maravilloso, y por ser mi todo en todos los momentos de mi vida.
Acknowledgments
This dissertation would not have been possible without the guidance and the help of several individuals who in one way or another contributed and extended their valuable assistance in the preparation and completion of this study.
First at all, I would like to take the opportunity to thank my advisor Prof. Imrich Chlamtac and co–advisor Prof. Fabrizio Granelli for helping to improve my work through their advice and ideas.
I would like also to thank Dr. Daniele Miorandi and Dr. Tinku Rasheed for their kind, responsible and understanding advises during the process of this thesis giving some advice and ideas to accomplish this thesis. I am grateful to Dr. Roberto Riggio for the valuable comments, discussions and support related to the topics investigated in this Thesis. Without their continuous support all this would have been not possible.
Furthermore, I would like to thank Dr. Cigdem Sengul for the valuable comments and discussions related to the power model andmorfeoalgorithm and for allowing to use the BOWL Testbed infrastructure for the measurements of IEEE 802.11n Indoor presented in Chapter 4,5and 6.
I would like also to thank Dr. Nico Bayer for the valuable comments and discussions related to morfeo algorithm and for allowing to use the outdoor testbed deployed at Telekom Innovation Laboratories in Berlin, Germany, for the measurements of IEEE 802.11g Outdoor presented in Chapter 4 and 6.
I would like to express my gratitude to my colleagues and friends from the CREATE–NET Research Centre for the moral support. Last but not the least, my family, Andrea and friends for their support and encouragement during this years of study, thank you so much.
Karina Mabell Gomez Chavez
Contents
1 Introduction 3
1.1 Motivations . . . 3
1.2 Research Questions . . . 5
1.3 Research Methodology . . . 6
1.4 Contributions and Outline . . . 6
1.4.1 Chapter 2: State of the Art . . . 7
1.4.2 Chapter 3: Hardware and Software Solution for Power Con-sumption Monitoring of Wireless Access Networks . . . 7
1.4.3 Chapter 4: Power Consumption Behavior of Wireless Access Devices (WiFi and WiMAX Technologies) . . . 7
1.4.4 Chapter 5: Energy and Power Consumption Metrics and Mod-els for Wireless Access Devices . . . 8
1.4.5 Chapter 6: Energy–Saving Solutions for Wireless Access Net-works . . . 8
2 State of the Art 10 2.1 Power Consumption Measurements: Tools and Methodologies . . . . 10
2.2 Power Consumption Models of Wireless Access Devices . . . 12
2.3 Energy Efficiency Improvements in Wireless Access Networks . . . . 16
3 Energino: Hardware and Software Solution for Power Consump-tion Monitoring of Wireless Access Networks 20 3.1 Introduction . . . 20
3.2 Requirements . . . 21
3.3 Design Choices . . . 21
3.4 Architecture: Hardware and Software . . . 22
3.4.1 Hardware Details . . . 23
3.4.2 Software Details . . . 24
3.5 Validation of Energino . . . 25
3.6 Conclusions . . . 26
Contents ix
4.2 WiFi Outdoor WADs: Power Consumption Behavior of Outdoor
IEEE 802.11g Wireless Access Devices . . . 31
4.2.1 Network Settings . . . 31
4.2.2 Testing Methodology . . . 32
4.2.3 Experimental Measurements and Analysis for IEEE 802.11g Wireless Access Devices . . . 33
4.2.4 Measurements of Power Consumption versus Transmissions Power Level . . . 40
4.3 WiFi Indoor WADs: Power Consumption Behavior of Indoor IEEE 802.11g and IEEE 802.11n Wireless Access Devices . . . 43
4.3.1 Network settings . . . 44
4.3.2 Testing Methodology . . . 45
4.3.3 Experimental Measurements and Analysis for IEEE 802.11n Wireless Access Devices . . . 46
4.3.4 Power Consumption Behavior Comparison between IEEE 802.11g and IEEE 802.11n Indoor Wireless Access Devices . . 49
4.4 WiMAX Outdoor WADs: Power Consumption Behavior of IEEE 802.16 Wireless Access Devices . . . 57
4.4.1 Network settings . . . 57
4.4.2 Testing Methodology . . . 59
4.4.3 Experimental Measurements and Analysis for IEEE 802.16 Wireless Access Devices . . . 60
4.5 Conclusions . . . 66
5 Energy and Power Consumption Metrics and Models for Wireless Access Devices 68 5.1 Introduction . . . 68
5.2 Energy Consumption Metrics . . . 69
5.2.1 Optimal Message Size . . . 69
5.2.2 Average Energy Cost per Bit . . . 70
5.3 Power Consumption Modeling . . . 71
5.3.1 Measurements–Based Modeling of Power Consumption as a function of Traffic . . . 72
5.3.2 Measurements–Based Modeling of Power Consumption as a Function of Datagram Size . . . 79
5.4 Conclusions . . . 89
6 Energy–Saving Solutions for Wireless Access Networks 92 6.1 Introduction . . . 92
6.2 Energy–Saving Architectures, Techniques and Algorithms for Wire-less Access Networks . . . 93
x Contents
6.2.2 Energy–Saving Techniques: Operation Modes for Wireless
Access Devices . . . 95
6.2.3 Energy–Saving Algorithms: MORFEO Energy–Saving Decision Algorithm . . . 97
6.3 Switching Times Impact Analysis . . . 102
6.3.1 Impact of Active–Off Mode Switching Times . . . 103
6.3.2 Impact of Active–Partial Sleep Mode Switching Times . . . . 107
6.4 Performance Evaluation . . . 109
6.4.1 Network Settings . . . 109
6.4.2 Testing Methodology . . . 109
6.4.3 Results Analysis . . . 111
6.5 Conclusions . . . 115
7 Conclusions 118 7.1 Achievements and Contributions . . . 118
7.2 Final Remarks and Future Directions . . . 120
A Appendix 123 A.1 List of Publications . . . 123
Bibliography 125
List of Figures
3.1 Energino system architecture details. . . 23
3.2 Energino: Hardware and software solution for power consumption monitoring. . . 25
3.3 Simple circuit used for the validation ofenergino power meter . . . . 26
3.4 Comparison of voltage and current values measured by HAMEG In-strument and energino power meter. . . 27
4.1 WiFi Outdoor WAD:Network scenario used for the measurement campaign. . . 31
4.2 WiFi Outdoor WADs: Average power consumption and network performance at the AP as a function of different traffic generation rates for a constant datagram size of 1280 bytes. . . 34
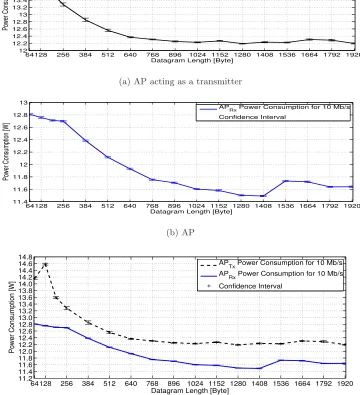
4.3 WiFi Outdoor WADs: Average power consumption at the AP as a function of the datagram size for a constant traffic generation rate of 10 Mb/s . . . 36
4.4 WiFi Outdoor WADs: Network Performance at the AP as a func-tion of the datagram size for a constant traffic generafunc-tion rate of 10 Mb/s . . . 37
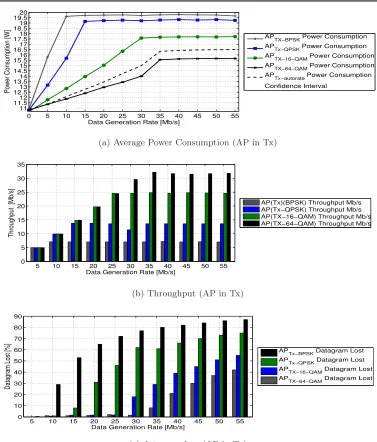
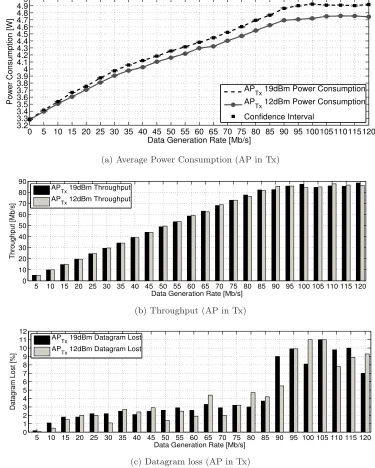
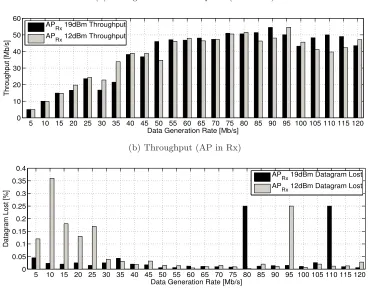
4.5 WiFi Outdoor WADs: Average power consumption and network performance at the AP (Tx) as a function of different traffic genera-tion rates for a constant datagram size of 1280 bytes. AP is acting as a transmitter with a fixed modulation and coding scheme. . . 39
4.6 WiFi Outdoor WADs: Average power consumption at the AP as a function of different traffic generation rates for a constant datagram size of 1280 bytes. AP is with a fixed modulation and coding scheme. 40
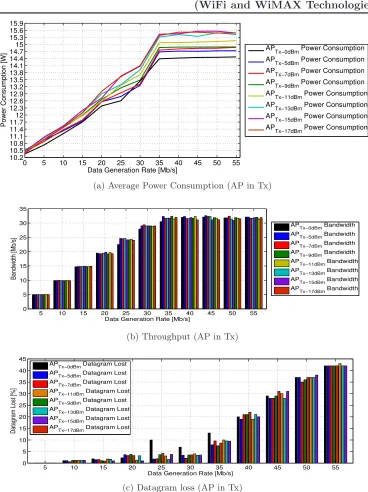
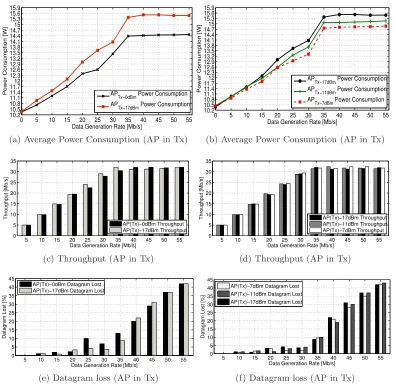
4.7 WiFi Outdoor WADs: Average power consumption and network performance at the AP as a function of different traffic generation rates for different transmission power levels for a constant datagram size of 1280 bytes. . . 41
4.8 WiFi Outdoor WADs: Average power consumption at the AP as a function of different traffic generation rates for different transmission power levels for a constant datagram size of 1280 bytes. . . 42
xii List of Figures
4.10 WiFi Outdoor WADs: Average energy per bit at AP actings as transmitter as a function of different traffic generation rates for differ-ent transmission power levels for a constant datagram size of 1280 bytes. 44
4.11 WiFi Indoor WAD: Network scenario used for the measurement campaign. . . 45
4.12 WiFi Indoor WADs: Average power consumption and network performance at the IEEE 802.11n AP as a function of different traffic generation rates for a constant datagram size of 1280 bytes . . . 47
4.13 WiFi Indoor WADs: Average power consumption and network performance at the IEEE 802.11n AP as a function of the datagram size for a constant traffic generation rate of 20 Mb/s . . . 49
4.14 WiFi Indoor WADs: Average power consumption and network performance at the IEEE 802.11n AP as a function of different traffic generation rates for different transmission power levels rates for a constant datagram size of 1280 bytes . . . 50
4.15 WiFi Indoor WADs: Average power consumption and network performance at the IEEE 802.11n AP as a function of different traffic generation rates for different transmission power levels rates for a constant datagram size of 1280 bytes . . . 51
4.16 WiFi IEEE 802.11g/n Indoor WADs: Comparison of the average power consumption and network performance for the IEEE 802.11g AP and IEEE 802.11n AP as a function of different traffic generation rates for a constant datagram size of 1280 bytes. AP acting as a transmitter . . . 53
4.17 WiFi IEEE 802.11g/n Indoor WADs: Comparison of the average power consumption and network performance for the IEEE 802.11g AP and IEEE 802.11n AP as a function of different traffic generation rates for a constant datagram size of 1280 bytes. AP . . . 54
4.18 WiFi IEEE 802.11g/n Indoor WADs: Comparison of the average power consumption and network performance at the IEEE 802.11g AP and IEEE 802.11n AP as a function of the datagram size for a constant traffic generation rate of 20 Mb/s. AP acting as a transmitter. 55
4.19 WiFi IEEE 802.11g/n Indoor WADs: Comparison of the average power consumption and network performance at the IEEE 802.11g AP and IEEE 802.11n AP as a function of the datagram size for a constant traffic generation rate of 20 Mb/s. AP . . . 56
4.20 WiFi IEEE 802.11g/n Indoor WADs: Comparison of the average energy per bit at the IEEE 802.11g AP and IEEE 802.11n AP as a function of the datagram size for a constant traffic generation rate of 20 Mb/s . . . 58
4.21 WiMAX Outdoor WADs: Network scenario used for the mea-surement campaign. . . 58
List of Figures xiii
4.23 WiMAX Outdoor WADs: Average power consumption and net-work performance as a function of different traffic generation rates for a constant datagram size of 1280 bytes.. . . 62
4.24 WiMAX Outdoor WADs: Average power consumption and throughput at either the BS as a function of the datagram size for a constant traffic generation rate (1 and 5 Mb/s). Datagram loss was less than 1% during all measurements. . . 63
4.25 WiMAX Outdoor WADs: Average power consumption at the BS and datagram loss as a function of different traffic generation rates for different transmission power levels. Datagram size is equal to 1280 bytes. . . 63
4.26 WiMAX Outdoor WADs: Goodput between BS and SS using different transmission power levels. The results refer to a saturated TCP connection. . . 64
4.27 WiMAX Outdoor WADs: Average of power consumption at the BS (Transmitter) and datagram loss as a function of different traffic generation rate for different modulation types. Datagram size is equal to 1280 bytes. . . 65
5.1 WiFi Outdoor WADs: Polynomial fitted curve of the power con-sumption at the AP with a datagram size equal to 1280 bytes.. . . . 74
5.2 WiFi Outdoor WADs: Sum of sinusoid fitted curve of the power consumption at the AP with a datagram size equal to 1280 bytes. . . 74
5.3 WiFi Outdoor WADs: Piecewise linear fitted curve of the power consumption at the AP with a datagram size equal to 1280 bytes. . . 76
5.4 R–Model: Estimating the power consumption of a WAD as a func-tion of the transmission rate. . . 79
5.5 R–Model: Real and modeled power consumption of a WAD as a function of the transmission rate. . . 80
5.6 WiFi Outdoor WADs: Polynomial fitted curve of the power con-sumption at the AP with different datagram size. . . 83
5.7 WiFi Outdoor WADs: Exponential fitted curve of the power con-sumption at the AP with different datagram size. . . 84
5.8 Average power consumption at the AP as a function of the datagram size for a constant traffic generation rate of10 Mb/s plotted using a semi–logarithmic scale. . . 84
5.9 WiFi Outdoor WADs: Piecewise log–linear fitted curve of the power consumption at the AP with different datagram size. . . 85
5.10 S–Model: Estimating the power consumption of a WAD as a func-tion of the datagram size. . . 87
xiv List of Figures
6.1 Schematic of the energy monitoring and control framework support-ing implementation of energy–savsupport-ing solutions . . . 95
6.2 The finite state machine for the different operation modes supported by the proposed framework. . . 97
6.3 Flow diagrams of themorfeo’s cycle . . . 98
6.4 Flow diagrams of themorfeo procedures for partial coverage . . . 102
6.5 Cycle and power cost required for switching between Active/Off Mode103
6.6 Graphical representation of the energy saved and of that wasted due to switching time.. . . 103
6.7 Switching time: measurements for Wireless Access Devices . . . 106
6.8 Cycle and power cost required for switching between Active/Partial Sleep Mode . . . 107
6.9 Average power consumed for Partial Sleep Mode . . . 108
6.10 Network topology for testing scenarios. The red dots represent the WiFi APs used in our experiments. The green and blue dots and ar-rows show the antenna directions for access and backbone interfaces, respectively. . . 110
6.11 Average power consumption of each AP in the network working under different scenarios1 where the network is working without users. . . . 112
6.12 Average power consumption of each AP in the network working under different scenarios2 where the network is working with users without
traffic. . . 112
6.13 Average power consumption of each AP in the network working under different scenarios3where the network is working with users and UDP
traffic. . . 113
6.14 Average power consumption of each AP in the network working under different scenarios4where the network is working with users and TCP
traffic. . . 113
List of Tables
3.1 Approaches to power consumption monitoring. . . 22
4.1 IEEE 802.11g rates and modulation types . . . 33
4.2 Average cost energy per bit at WAP acting as a transmitter using different transmission power levels. . . 44
5.1 Optimal message size to saving energy . . . 70
5.2 WiFi Outdoor WAD: Energy cost per bit for Outdoor IEEE 802.11g WAD . . . 71
5.3 WiFi Outdoor WAD: Goodness of the different fit used by mod-eling the power consumption as a function of traffic . . . 77
5.4 WiFi Outdoor WAD:Linear R–Model parameters (s= 1280bytes). 81
5.5 WiFi Outdoor WAD: Goodness of the different fit used by mod-eling the power consumption as a function of datagram size . . . 86
5.6 WiFi Outdoor WAD: Log–Linear S–Model parameters (x = 10 Mb/s). . . 89
6.1 State transition table for Operation Modes Switching . . . 97
6.2 Netowrk scenario description . . . 111
6.3 Network performance for each AP working under Scenario3 and
List of Equations
3.2 Equ. 3.2: Actual converting voltage consumed by the monitored device 24
3.3 Equ. 3.3: Actual converting current consumed by the monitored device 25
5.1 Equ. 5.1: Energy efficiency of the WAD . . . 69
5.2 Equ. 5.2: Optimal message size . . . 70
5.3 Equ. 5.3: Energy cost per bit . . . 71
5.12 Equ. 5.12: R–Model = Power Consumption Model as a function of traffic load . . . 78
5.19 Equ. 5.19: S–Model = Power Consumption Model as a function of datagram size . . . 86
6.8 Equ. 6.11: Minimum time the WAD needs to be in Off Mode in order to save energy as a function of power consumption . . . 105
6.9 Equ. 6.9: Minimum time the WAD needs to be in Off Mode in order to save energy as a function of current consumption. . . 105
List of Algorithms
1 Step 1: Initialisation . . . 99
2 Step 2: Reactive updates . . . 100
3 Step 3: Correction . . . 101
Chapter 1
Introduction
Contents
1.1 Motivations. . . 3
1.2 Research Questions . . . 5
1.3 Research Methodology . . . 6
1.4 Contributions and Outline . . . 6
1.4.1 Chapter 2: State of the Art . . . 7
1.4.2 Chapter 3: Hardware and Software Solution for Power Con-sumption Monitoring of Wireless Access Networks . . . 7
1.4.3 Chapter 4: Power Consumption Behavior of Wireless Access Devices (WiFi and WiMAX Technologies) . . . 7
1.4.4 Chapter 5: Energy and Power Consumption Metrics and Models for Wireless Access Devices . . . 8
1.4.5 Chapter 6: Energy–Saving Solutions for Wireless Access Net-works . . . 8
1.1
Motivations
According to a number of climate studies [gw1, Watanabe 2012, gw3], the 20th century’s last two decades were the hottest in 400 years and possibly the warmest for several millenniums, so behavior of the past human generations cannot be the cause of the current global warming. However, this is not the case of the new human generation behavior which have huge impact on global warming mainly due to the technological boom occurred across the last century. Global warmingis a hot topic, the projected impact of global warming often makes headlines [gw2 ]. The potentially disastrous effects of even a few degree temperature rise may cause the disappearance of island countries into the ocean, polar ice melts, sea level rises and hurricanes and tropical storms may intensify, to name a few [gw1 ,Watanabe 2012,
gw3,gw2 ].
4 Chapter 1. Introduction
reports that electricity increased in the last three years, from 2010 to 2012, and it will continue increasing in the coming years. It will have a dramatic impact on the communication service prices specially on those countries that are importing their energy such as Italy and Cyprus, which actually have the highest industries electricity prices in the Europe Union [ec ]. Therefore, considering the environmen-tal and economical motivations explained before, one of the most urgent challenges in the new century for current and future human generations is to investigate and introduce new energy efficiency technologies that can enable a transition towards a more sustainable society with a reducedCO2 footprint.
We all know that modern society is more dependent on strong and efficient com-munication means; several daily activities has been planned using comcom-munication infrastructure. Social networks, such as Facebook and twitter, Software applications and Internet in general are the most attractive and instantaneous access media to be used for common individuals in order to communicate human feelings, news, sharing pictures-files and hundreds of others services. This tendency is increasing exponentially the traffic volumes, i.e. the amount of traffic volumes in wireless net-work increases from 300% to 700% annually [Micallef 2010]. The recent smartphone, tablet and laptop revolution are also contributing to this phenomena. For instance, the number of WiFi APs deployed are increasing exponentially [Jardosh 2009] due to the necessity of provided Internet connectivity for users anywhere and anytime mainly for business scope.
Energy efficiency in Information and Communication Technology (ICT) in-frastructures is becoming a top priority for industries, governments and scien-tific communities alike. Although, due to the number of variables involved, it is hard to find definitive figures on the impact of the ICT sector on the global CO2 emissions, it is widely accepted that such impact is non–negligible and
that by 2020 it could range from 2% up to 10% of the worldwide carbon emis-sions [RFG 2008, sma 2010, GAP 2012]. Isolating the impact of the Telecoms is even more problematic. In [sma 2010] it is estimated that by 2020 the Telecom infrastructure and devices alone would account for about the 25% of the ICT sec-tor’s CO2 emissions and that mobile networks will be responsible for about half of
1.2. Research Questions 5
conferences and initiatives1
in order to research solutions.
1.2
Research Questions
Network topology, transmission media, packet processing and coverage considera-tions are some of the key aspects governing energy efficiency at the network and device level. However, data reveals a large expenditure of energy on the radio access network. The paradigm shift from “always on” network to “always available” under similar time constraints is gaining importance. This is due to the fact that, the periods of extended underutilization can be predictable, detected and utilized for additional energy savings. At this point, the use of different operation modes in Wireless Access Devices (WAD) (referred as WAD, which can be an Access Point or Base Station) are mandatory for energy saving in wireless access networks. However, the achievable savings are not easily quantifiable and there are some open questions in this field (i) which metric to use in order to decide which network is more en-ergy efficient compared to another network?, and (ii) how to understand how much energy is consumed by a specific network for specific operations? Accordingly, it is important both to define energy efficiency metrics as well as power consumption trends in order to migrate toward the new green technologies generation. In this Thesis we address the following questions:
(a) Where is the power used in WADs?
(b) How is the power consumed in WADs? How much of the power is wasted?
(c) How much of the wasted power could be saved?
(d) What are future trends (that affect energy use and waste)?
(e) Which are the critical aspects of standards with respect to power consumption?
(f) Which is the relationship between power consumption and performance in the network?
(g) Under which conditions it is possible to put the WADs in different operation modes?
(h) How the time for switching between the different operation modes affect the network performance?
(i) Which network architectures allows to introduce different operation modes?
It is the Author’s standpoint that the answers to these questions are very im-portant since they would provide us with an increased insight into the network behaviour, paving the way to the development of (i) experimental–methods for un-derstanding the network behavior in terms of power consumption (see Chapter 3
1
6 Chapter 1. Introduction
and Chapter 4), (ii) realistic metrics and models for power consumption in wireless access networks (see Chapter5) and (iii) energy efficiency protocols and algorithms for their operations (see Chapter 6).
1.3
Research Methodology
In order to answer the research questions outlined previously, we apply the quan-titative experimental method for understanding the power consumption behavior of WADs and the reasons that govern such behavior in order to identify where and
how the power of WADs is consumed. Our quantitative experimental methodaims to investigate the outlined research questions looking at potential relationships be-tween variables including the power consumption, the transmission power level, the datagram size and the modulation and coding schemes, and specially the traffic load.
In our quantitative experimental method, energino power meter is used as the data collection instrument. Energino is an hardware and software solution for real– time power consumption monitoring of WADs ( see Chapter 3). Using this data collection instrument, we create a real testing environment and performed several experiments, which are explained in detail in the Chapter 4 for producing results used for summarizing, comparing, and generalizing the power consumption behavior of WADs. Statistics derived from quantitative experimental methodresults are used to establish the existence of associative or causal relationships between variables (see Chapter 5). Finally, the quantitative experimental methodresults and outputs help us to propose efficient techniques for reducing energy wastage and improving the energy efficiency of the wireless access networks (see Chapter 5).
1.4
Contributions and Outline
The main contributions of this Thesis are:
(i) Design and development of energino, a novel hardware and software solution for real–time energy consumption monitoring in wireless access networks.
(ii) Propose a methodology to characterize energy consumption of WADs as a function of (a) the traffic load, (b) the modulation and coding schemes, (c) the size of the datagram used and (d) different transmission power levels.
(iii) Identify and develop meaningful metrics in order to evaluate network energy efficiency in wireless access networks.
(iv) Propose a simple and accurate power consumption model for the WADs which is validated by experimental measurements with real WADs using different parameter settings.
1.4. Contributions and Outline 7
The rest of the Thesis is organized as follows. Chapter 2 discusses the state of the art of the related topic to this Thesis while Chapter 3 introduces energino an hardware and software solution for power consumption monitoring of DC-devices. In Chapter 4 the power consumption behavior of WADs working with WiFi and WiMAX technologies are presented and Chapter 5 describes several energy and power consumption metrics and models for wireless access devices. Then, Chap-ter6 summarizes the proposed energy–saving solutions for wireless access networks discussed in this Thesis. Finally, Chapter 7 draws conclusions and describes the future work.
Below we will provide a more detailed overview of each Chapter. List of Author’s Publications and Abbreviations are provided in the appendix of this Thesis.
1.4.1 Chapter 2: State of the Art
In Chapter2, we discuss the state of the art. We present an overview of the related work on tools and methodologies for power consumption measurements, the power consumption models and the energy efficiency improvements proposed for WADs.
1.4.2 Chapter 3: Hardware and Software Solution for Power Con-sumption Monitoring of Wireless Access Networks
In Chapter 3, we introduce energino a scalable and affordable solution for energy consumption monitoring in wireless networks. The energino power meter is a stan-dalone plug–load meter based on the Arduino platform providing high resolution and sampling rate capabilities. We evaluate the capabilities and distinctive features of the energino power meter in real–circuits. Results show that energino is capa-ble of isolating high resolution/frequency dynamics that can not be analyzed using commercially available tools.
The main contents of this Chapter have been published in paper [Gomez 2012b]. The prototype of energino was implemented and evaluated by the author of this Thesis under the supervision of Dr. Roberto Riggio. We also release both the hardware schematics and the software with a permissive license in order to encourage the research community to use and extend it.
1.4.3 Chapter4: Power Consumption Behavior of Wireless Access Devices (WiFi and WiMAX Technologies)
8 Chapter 1. Introduction
analysis and comparison of the power consumption behavior between IEEE 802.11g– IEEE 802.11n Indoor WAD is also presented in this Chapter. Our measurements show that the power consumption of such WADs exhibits a linear dependence on the traffic until a saturation point is reached.
The contributions of this Chapter have been previously published in paper
[Gomez 2012a]. The author of this Thesis was responsible for the design,
imple-mentation and evaluation of the measurements campaign using energino.
1.4.4 Chapter 5: Energy and Power Consumption Metrics and Models for Wireless Access Devices
In Chapter5, we describe several energy and power consumption metrics and models for WADs. We propose specific power consumption models and metrics for applica-tion level estimaapplica-tion of energy consumpapplica-tion for designing energy–aware wireless net-work. In particular, we implement a simple and realistic power consumption models for WADs, which reflect the power consumption in various functioning states and during transitions between states of the WAD. By applying the power consumption models, we are able to evaluate and analyze the energy efficiency of various WADs. Experimental measurements with real WADs validated the proposed metrics and models.
The models and results of this Chapter have been published in [Gomez 2011,
Gomez 2012a]. The author of this Thesis formulated the models, carried out all the
measurements and analyzed of results.
1.4.5 Chapter 6: Energy–Saving Solutions for Wireless Access Networks
In Chapter 6, we summarize the proposed energy–saving solutions for WADs dis-cussed in this Thesis. We presentmorfeoa flexible energy–saving decision algorithm to tune the energy consumption of a wireless infrastructure to the actual network conditions in terms of both user density and traffic patterns. Experimental results from a real–life deployment shows that our solution can deliver significant energy savings with minimal degradation in terms of the quality of service provided.
Part of the content of this Chapter have been published in paper [Riggio,
Gomez 2013]. The solution algorithms were devised, implemented and evaluated
Chapter 2
State of the Art
Contents
2.1 Power Consumption Measurements: Tools and Methodologies . . . 10
2.2 Power Consumption Models of Wireless Access Devices . . . 12
2.3 Energy Efficiency Improvements in Wireless Access Networks. . . . 16
In this Chapter, we present an overview of the related work on (i) tools and methodologies for power consumption measurements, (ii) the power consumption models and (iii) the energy efficiency improvements proposed for WADs.
2.1
Power Consumption Measurements:
Tools and
Methodologies
Energy consumption measurements of complete devices have been performed mainly for mobile phones [Rice 2010] and Network Interface Cards (NICs) [Feeney 2001,
Ebert 2002,Halperin 2010]. In this section, we focus on the tools and methodologies
used in order to perform real–time power consumption measurements while the power consumption models and main observations of these works will be explained in the next section.
In [Carroll 2010], a detailed analysis of the power consumption of a recent mobile
phone, the Openmoko Neo Freerunner is presented. The authors measure the overall system power as well as the exact breakdown of power consumption by the main hardware components of the device. In order to calculate the power consumed by the phone, both the supply voltage and current are measured experimentally. Firstly, the authors measure the current inserting a sensing resistor on the power supply rails of the relevant components–this is relatively simple on the device–under–test selected, since most of them have been designed with placeholders for sense resistors. Authors used a current-sense resistor selected such that the peak voltage drop did not exceed 10mV, which in all cases is less than 1% of the supply voltage and therefore presents an acceptably small perturbation. With a known resistance and measured voltage drop, current is determined by Ohm’s law. In order to measure the voltages, a National Instruments PCI–6229 Data Acquisition Module1
is used. Using the experimental testbed, the real traffic logs are collected together with the power consumption of the phone.
1
2.1. Power Consumption Measurements: Tools and Methodologies 11
In [Halperin 2010], measurements of the power consumption of an 802.11n NIC
across a broad set of operating states (channel width, transmit power, rates, anten-nas, Multiple–Input/Multiple–Output (MIMO) streams, sleep, and active modes) are reported. The NIC used in the experiments is available in a mini-PCI Express form factor, which was connected to the desktop–testbed–node via an adapter that converts to a PCI Express interface. To measure the power consumption, the au-thors placed a resistor (40Ω) on the 3.3V power supply to the wireless interface. A National Instruments 6218 Data Acquisition Module (NIDAM)2
was used in order to measure and record the voltage drop across the resistor. Thus, the power consumed by the wireless interface was calculated using the data recorded with NIDAM. In order to inject traffic in the experimental testbed, packets with 1500 bytes are gen-erated and logged several times. Then, the average of multiple collecting samples was used for estimating the instantaneous power consumption of the NIC (i) during transmission or reception, and (ii) for sleep and idle modes.
In [Rice 2010], authors ran a large number of automated tests using Google
Android G1, Magic, Hero and Nexus handsets and present results for the average energy consumption of connection and data transmission over 802.11 wireless net-works. The phone’s power consumption is measured by inserting a high-precision 0.02Ω measurement resistor in series between a battery terminal and its connector on the phone. A National Instruments PCI-MIO-16E-43
sampling board is used in order to measure the voltage across the phone battery and also the voltage drop across the measurement resistor at 250 kHz. Inserting the measurement resistor increases the circuit resistance, and therefore its power consumption. This is not a problem for measurements purposes as this is typically less than 1% of the total power. Then the current is determined by Ohm’s law.
The tools and methodologies used by [Carroll 2010, Halperin 2010, Rice 2010] for measuring the energy consumption of wireless devices are similar and suitable to be used in laboratory tests. However, these solutions are not suitable at moment to scale the experiments to real–time power monitoring in deployed testbed. Other similar approaches for energy consumption monitoring suitable to be used in labo-ratory tests are explained in [Feeney 2001,Ebert 2002]. These works perform high resolution and high frequency sampling using a digital oscilloscope. However such solution is expensive and hard to integrate in distributed networks due to typically bulky laboratory equipments. On the other hand, for battery–powered devices the energy consumption of the such devices can be derived from the battery discharge as explained in [Rantala 2009, Lochin 2003, Pathak 2011]. However, this solution cannot be applied for the majority of the wireless networking devices since these devices are often not battery–powered.
In order to measure the whole power consumption of devices, commercial prod-ucts can be used. In particular, several plug–load power meters are available as off–the–shelf solutions, they are all characterized by low frequency and low
reso-2
Available at: http://sine.ni.com/nips/cds/view/p/lang/en/nid/203484
3
12 Chapter 2. State of the Art
lution sampling capabilities. The Watts Up! [wat] and Expert Power Controller (EPC) [EPC] power meters are an example of commercial solutions. Watts Up! and EPC are “plug load” power meters that measures the amount of electricity used by whatever electrical appliance is plugged into it. Such measurements, taken with a granularity of 0.1W and a sampling period of 1s, can be logged into the device’s internal memory or they can be exported using either an Ethernet port or a serial in-terface. Nevertheless, such specifications proved to be insufficient to catch dynamics occurring at the transition point between linear and saturation power consumption regimes are shown in our previous works [Gomez 2011,Gomez 2012a].
2.2
Power Consumption Models of Wireless Access
De-vices
Real–world energy consumption measurements of wireless networking devices have not been performed often in the past. This, in turn, led to unrealistic and/or over– simplified models being used in simulations.
In [Feeney 2001], the authors present several measurements for an IEEE 802.11a–
based wireless network interface operating in idle, sleep, receive and transmit modes. Such measurements are obtained using an oscilloscope. In the work, the per–packet energy consumption E is approximated using a linear model given by:
E =m·S+b (2.1)
Where,
• S is the length of the packet,
• m represent the values of the linear coefficients,
• bis a constant and it must be determined experimentally for various operation modes,
The authors conclude that the energy consumption of an IEEE 802.11a wireless interface has a complex range of behaviors according to several factors such as relative proportions of broadcast and point-to-point traffic, packet size and reliance on promiscuous mode operations. The behavior of power consumption as a function of packet size is shown to follow a linear behavior. However, the model does not consider the case of link–layer fragmentation and the impact of the different amount of traffic on power consumption figures.
2.2. Power Consumption Models of Wireless Access Devices 13
Ebit−good =
AverageCP
Goodput (2.2)
Where,
• Goodput indicates the (MAC) goodput (expressed in [Bit/s]), it must be recorded simultaneously with the power consumption measurements (AverageCP);
• AverageCP indicates the power consumption measurements (expressed in [W]);
• Ebit−good indicates the amount of energy expenditure in order to transmit one bit of payload data successfully (expressed in [J/Bit]);
The authors also conclude that large packets use energy more efficiently than small ones as well as high modulation schemes are more energy efficient. In contrast to our work, the impact of traffic on power consumption figures is not considered for the Authors.
In [Halperin 2010], the authors focus their analysis on the new IEEE 802.11n
standard using a wide range of experiments. Each experiment is aimed at assessing the impact that a certain feature (e.g. channel width, transmission power, modula-tion and coding scheme, etc.) has on the global energy consumpmodula-tion figures. The testbed used for the power consumption measurements was composed of two nodes placed close to each other in order to have good link quality, which allowed the authors to effectively exploit all the IEEE 802.11n modulation and coding schemes. The main conclusions of this work are that (i) for optimizing energy consumption, it is imperative to use the fastest single-stream rate possible, especially for shorter packets and (ii) the optimal device settings will also depend on channel conditions and workload. The authors also observed that transmit power levels have very little effect on the power consumed by the interface.
In [Xiao 2010], the authors present a power consumption model for IEEE 802.11g
WLANs exploiting the power saving mode. The authors also show the power con-sumption model accuracy w.r.t. physical data measured from three popular mobile platforms, namely Maemo, Android and Symbian. The model aims at estimating the energy usage based on the flow characteristics which are easily available on all the platforms without modifications to low–level software components or hard-ware. The authors conclude that energy is wasted by the idle status between packet intervals, in line with our results.
14 Chapter 2. State of the Art
model estimates the total energy (in Joules) consumed by a station in order to trans-mit/receive 1MByte of data based on (i) the energy consumed by the station in a specific state and (ii) the energy consumed by the station for transmitting/receiving
1MByte. Based on calculations, the author concludes that energy usage for the sta-tion grows approximately linearly with N and asN increases, the energy wastage also increases. Such behavior is mainly due to passive overhearing of packets in-tended for another station. The power consumption is analyzed only for a fixed amount of traffic.
The results reported by the authors in [Feeney 2001, Xiao 2010, Ebert 2002,
Halperin 2010,Ergen 2007] provides us with insights on the power consumption of
the single wireless interface rather than of the system as a whole, ignoring the energy expenditures related to other functions such as operations for packet forwarding and reception, fragmentation and reassembling etc. On the other hand, in this Thesis, we focus our attention on the overall energy expenditure in that it is useful to (i) model the real power consumption behavior for WWAN and WLAN WADs and (ii) determinewhere andhow the energy is wasted in wireless access network gateways.
In [Tauber 2011], the authors focus on the energy consumption of a wireless
network as a whole. The authors present a joint experimental evaluation of energy consumption and performance in a IEEE 802.11–based WLAN using both 802.11a and 802.11n operating modes. The testbed consisted of an AP communicating with a single station. The power consumption measurements are taken using a suitable power meter and traffic is injected using the iperf traffic generator. The authors have exploited an application–level approach, varying the packet size and transmission rate and evaluating the energy consumption across a wide transmission rates. They also perform a comparison of the energy consumed by popular Internet applications such as YouTube and Skype. A metric for energy usage namely Effective Application–specific energy–usage (EA) was defined, as follows:
EA= P
T (2.3)
Where,
• P is the mean power used during transmission of flow (expressed in [J]);
• T is the mean throughput of flow (expressed in [Mb/s]);
The authors also observed that both the application’s transmission rate and the packet size have an impact on power consumption when the device is acting as transmitter. In contrast to our work, the case when the device is acting as receiver is not considered, and no power consumption model is provided.
In [Garcia-Saavedra 2011], the authors investigate the case of IEEE 802.11-based
2.2. Power Consumption Models of Wireless Access Devices 15
a closed-form expression for the optimal configuration of WLANs with respect to the energy-efficiency criteria.
In [Deruyck 2010], the authors present a power consumption model for wireless
access networks and, in particular, for mobile WiMAX, HSPA and LTE networks. The scenario is a suburban area and a physical bit rate of 10 Mb/s is used. The au-thors compare wireless technologies for one SISO system and three MIMO systems considering a ranking of the wireless technologies as a function of their power con-sumption, range and energy efficiency. To compare the different technologies, the authors define models in order to calculate the total power consumption per user and the power consumption of the base station. In contrast to our work, the model provided by the authors is based in the amount of power consumed by each part of the system separately rather than the power consumption of the system as a whole. The authors also present relevant analysis to (i) determine which technology is the best solution for the specified area, and (ii) compare the power consumption of the wireless access networks with the power consumption of the wired access networks. In order to compare the different technologies, the authors define:
• The total power consumption P utot per user (expressed in W) given by:
P utot =Phome+Paccess+Pcore (2.4)
Where,
– Phome is the power consumption of the CPE (Customer Premises Equip-ment)(in W);
– Paccess is the power consumption of the access network (expressed in W);
– Pcore is the power consumption of the core network (expressed in W);
• The power consumption P bof the base station (expressed in W) given by:
P b=nsector·(nT x·Pamp+Ptrans+Pproc+Pconv+Pgen)+Pmicro+Pairco (2.5)
Where,
– nsector is the number of sectors in the cell;
– nT x is the number of transmitting antennas per sector;
– Pamp is the power consumption of the power amplifier;
– Ptrans is the power consumption of the transceiver;
– Pproc is the power consumption of the digital signal processing unit;
– Pconv is the power consumption of the AC-DC converter;
– Pgen is the power consumption of the signal generator;
– Pmicro is the power consumption of the microwave link;
16 Chapter 2. State of the Art
The most relevant conclusion of the paper is that with a pre–defined bit rate of 10 Mb/s, the mobile WiMAX is the most energy–efficient solution compared with HSPA and LTE. However, the investigation is limited to a fixed amount of traffic consequently the scenarios of low traffic load and high traffic load are not considered leaving the question “how the traffic affects the power consumption of the WiMAX, HSPA and LTE devices” unanswered.
2.3
Energy Efficiency Improvements in Wireless Access
Networks
In this section, we present an overview of the related work on energy efficiency improvements proposed for cellular and enterprise WiFi networks.
From the beginning, cellular networks are designed to optimize the energy con-sumption of mobile devices. Recently, the focus has moved towards the optimization of energy consumption of fixed infrastructure. The article [Pentikousis 2010] gives an overview of the evolution of mobile devices, from the first until the latest gener-ation of mobile technologies, and its implicgener-ation on power management. The article shows that power management plays a very important role in mobile devices and mobile networking. Therefore, the design of novel ways to deliver network services in mobile communication networks without resorting to always–on connectivity, com-bining with a suitable service management, is mandatory in order to increase the energy efficiency of mobile networks. Techniques for energy saving on mobile devices are discussed in [Perrucci 2008]. Authors present a possible solution introducing a secondary air interface with lower energy consumption. It is used as a signaling channel to wake up mobile devices in the presence of wireless networks.
From WADs point of view, the majority of the works investigate the most ef-ficient ways to turn off cells/networks or put them in sleep mode, while maintain-ing good quality of service [Marsan 2010,Saker 2009, Marsan 2009,Micallef 2010,
Elayoubi 2011, Dufkova 2010]. In [Marsan 2010], a cooperative approach between
2.3. Energy Efficiency Improvements in Wireless Access Networks 17
of service (QoS) for the offered traffic.
The same approach, putting resources in sleep mode, is also used in
[Marsan 2009, Micallef 2010, Elayoubi 2011] but in a more efficient way. These
papers introduce models for the energy–aware management of cellular access net-works. The idea is to reduce the number of active cells in low traffic conditions. Consequently, when some cells are switched off, the traffic is taken by the cells that remain active in order to guarantee the availability of the service over the whole area. This solution implies changes on antenna tilt configuration in order to guarantee the coverage area. In [Dufkova 2010] a methodology for saving energy in Mobile Communications Networks is presented. It is based on re–arranging the user–cell association in order to allow shutting down of under–utilized parts of the network. These set of solutions have an approach focusing on minimizing the idle time of the network, taking advantage of low traffic, in order to maximize the energy savings.
Similar sleeping approaches also exist for WLANs [Jardosh 2009,Lorincz 2010]. In the papers, the authors affirm that the most of energy consumed in a wireless net-work is wasted because of the large period of idle netnet-work resources in the absence of traffic. Therefore, the paper [Jardosh 2009] proposes SEAR, a resource on–demand strategy to power on or off resources in high–density WLANs. SEAR strategy anal-yses the volume and location of user demand in order to power on/off WLAN access points (APs) dynamically according to the user demand. As similar approach is used in [Lorincz 2010], focusing mainly on wireless access. The proposed technique analyses traffic in different hours, days and weeks in order to optimize the man-agement of on/off state (idle or sleep) and transmission power of access stations. The paper [Lorincz 2010] considers as example the energy consumption of IEEE 802.11b/g WLAN networks, remarking that similar considerations can be done also for other wireless technologies (3G, WiMAX, LTE systems).
Other approaches to save energy include exploiting the heterogeneity of the ac-cess technologies and the interaction with wired networks, and adapting transmission power based on energy and coverage trade-offs [Al-Hazmi]. For example, one of the proposals is to decrease the number of active APs by increasing the transmission power and relay messages using ad hoc networking to increase coverage. We also present a pioneer works in techniques for reducing network energy consumption. In
[Nedevschi 2008] the techniques are investigated in wired network. Nevertheless,
the approach can be applied to wireless networks taking account the limitations of wireless communications. The paper [Nedevschi 2008] investigates two forms of power management schemes for energy savings. The first scheme explores putting components in sleep mode and the second scheme explores adapting the rate of “net-work operation” to “net-workload in order to reduce the energy consumed in the absence of packets and when actively processing packets. The authors also determine when sleeping is best and under which conditions rate adaptation is best. Both sleep-ing and rate adaptation are performed showsleep-ing improvements in energy with small increase in latency and packet loss.
18 Chapter 2. State of the Art
consumption in the whole cellular network architecture. The future solutions are mainly focusing on energy metrics, energy efficient architectures, multi-hop routing and frequency management. In [Fehske 2009], the authors propose the deployment of small, low-power base stations together with conventional macro sites. The same approach is used in [Richter 2010] for homogeneous and heterogeneous wireless net-works, where the utilization of low-power micro sites instead of macro sites is con-sidered to enhance throughput, energy efficiency and network coverage. The micro sites are low power base stations thus the energy efficiency of the network is im-proved. The technique adapts the power transmissions of micro sites to take traffic load conditions into account. These proposed methods uses the current cellular net-work infrastructure adding micro sites as a solution in order to improve the power consumption by area. However, this implies major changes to the hardware and software in the cellular network deployments, and as a consequence, will affect the current cellular network infrastructure.
Finally, a different approach is presented in [J.-M. 2010]. The technique op-timizes the transmission power of the base stations in order to reduce the global energy consumption in the network. The optimization technique takes into account (i) the effect of shadowing (ii) the presence of thermal noise (ii) the impact of the base station transmission power in the coverage and the capacity of mobile cellular networks. Thus, the optimization technique determines the optimal transmitting power to each base station while it maintains the QoS. Similar techniques are also used in [Richter 2010,Lorincz 2010]. These techniques are very interesting because they help to save energy just limiting power transmission without affecting the QoS. These solutions require only minor upgrades to the base station software.
Chapter 3
Energino: Hardware and Software
Solution for Power Consumption
Monitoring of Wireless Access
Networks
Contents
3.1 Introduction . . . 20
3.2 Requirements. . . 21
3.3 Design Choices. . . 21
3.4 Architecture: Hardware and Software . . . 22
3.4.1 Hardware Details . . . 23
3.4.2 Software Details. . . 24
3.5 Validation of Energino . . . 25
3.6 Conclusions. . . 26
3.1
Introduction
In this Chapter, we introduce energino a novel hardware and software solution for real–time energy consumption monitoring in wireless networks. The development ofenergino was motivated by limitations, especially in terms of sampling resolution and granularity, found in currently available commercial solutions for energy con-sumption monitoring. As a matter of fact, the available commercial solutions are not able to identify high resolution/frequency power variations in WADs where the variations occur in milliseconds.
To the best of our knowledge,energinois the first power meter capable of deliver-ing high performance while remaindeliver-ing an affordable solution for large deployments. We also release both the hardware schematics and the software of energino 1
with a permissive license in order to encourage the research community to use and ex-tend it. We evaluated the distinctive features of energino power meter in a realistic setting in Chapter 4.
1
3.2. Requirements 21
3.2
Requirements
The energino power meter has been designed around the following set of require-ments:
• High sampling rate: Ideally, in order to isolate MAC–layer features such as
RTS/CTS handshakes and acknowledgments in WiFi networks a millisecond precision is needed. Therefore, if high frequencies dynamics, such as these MAC–level protocol transients are to be caught, an high frequency sampling rate is required.
• High resolution: In order to develop realistic models capable of capturing
the correlation between different traffic patterns and energy consumption, it is mandatory to collect samples with a very fine granularity, ideally in the order of 10 mW or less.
• Low–cost/Low–power:.The fraction of devices that can be actively
moni-tored in a wireless network is clearly limited by the cost to deploy and run such energy monitoring infrastructure. As a result, having a device that is both cheap to produce/assemble and that require very low power in order to operate is mandatory if a significant number of wireless devices have to be monitored.
• Manageability: Supporting basic management functions, such as being able
to selectively turn on/off network devices or radio interfaces, enables the devel-opment of novel protocols and algorithms capable of adapting power consump-tion to the real network condiconsump-tions (i.e., number of users and traffic patterns).
• Autonomous: Being able to operate as a stand–alone monitor without
re-quiring the connectivity to either the device being monitored or to a third device is of capital importance in a highly distributed deployment. Such re-quirements mandate both a dedicated power supply and the support of net-working functionality (i.e. Ethernet, WiFi, ZigBee).
3.3
Design Choices
Covering the entire spectrum of requirements with a single commercial product proved to be unfeasible. In particular, albeit several plug–loads meters are available as off–the–shelf solutions, they are all characterized by low frequency and low reso-lution sampling capabilities. Moreover, their prices range between 80e, for devices
without network connectivity and very limited storage capabilities, up to 200efor
devices with full network connectivity (Ethernet or ZigBee).
22
Chapter 3. Energino: Hardware and Software Solution for Power Consumption Monitoring of Wireless Access Networks
Table 3.1: Approaches to power consumption monitoring.
Resolution Sampling Price Ease of
Rate Deployment
Plug-load meters Low Low Average High
Oscilloscopes Very High Very High Very High Low
granularity of 0.1W and a sampling period of 1s, can be logged into the device’s internal memory or they can be exported using either an Ethernet port or a serial in-terface. Nevertheless, such specifications proved to be insufficient to catch dynamics occurring at the transition point between linear and saturation power consumption regimes [Gomez 2011, Gomez 2012a]. It is the Author’s opinion that, a sampling period in the order of tens of times per second and a resolution of 10 mW is required in order to properly investigate such high resolution/frequency power consumption dynamics.
High resolution and high frequency sampling can be easily obtained using a digital oscilloscope as done in [Feeney 2001]. However such a solution is expensive with a cost ranging from 500eup to several thousand of euros. Moreover, meant to
serve as laboratory equipment, oscilloscopes are typically bulky and hard to integrate in an highly distributed network.
A summary of the advantages and disadvantages of both family of solutions is reported in Table 3.1. As it can be seen, there is a clear space for novel energy consumption monitoring solutions. It is worth noticing that, albeit the design pre-sented in this chapter is primarily addressed towards the needs of the experimentally driven research, it can be easily extended to support also use cases coming from the industry such as monitoring of deployments powered using renewable sources and/or validation and characterization of the energy budget of metropolitan wireless net-works.
3.4
Architecture: Hardware and Software
energino is a plug–load meter designed to monitor the energy consumption of DC devices. It consists of an hardware and a software components both based on the Arduino platform. A management backend written in Python is used to configure energino’s operating parameters, i.e. sampling rate and resolution, and to gather the energy consumption statistics. We release both the hardware schematics and the software with a permissive license2
in order to encourage the research community to use and extend it.
2
3.4. Architecture: Hardware and Software 23
Figure 3.1: Energino system architecture details.
3.4.1 Hardware Details
The need for a programmable and extensible platform drove us toward the Arduino platform. Arduino [ard] is an open–source fast prototyping platform which, at its core, consists of a programmable micro–controller that can sense the environment using a variety of sensors and can affect its surroundings by controlling lights, mo-tors, and other actuators. Additional modules, called “shields”, can be used in order to extend the Arduino capabilities. Particularly relevant for our prototype are the extensions providing networking functionality (Ethernet, WiFi, and ZigBee).
The Arduino board supports 6 input channels using a 10–bit analog to digital converter. In particular, it maps input voltages between 0 V and 5 V to integer values between 0 and 1023. The ensuing resolution is thus 4.9 mV per unit. Each input can be sampled with a period of 100µs which results in a maximum sampling rate of 10kHz. Such a sampling rate is not high enough to catch MAC-level events such as acknowledgments however, we accepted it as a reasonable trade–off between cost/complexity and performance.
The Arduino has been extended with a custom module integrating a voltage sensor (based on a voltage divider), a current sensor (based on the Hall effect), and a solid state relay. A block diagram of the entire system is reported in Fig. 3.1. In the rest of this section we shall describe in details these three subsystems.
3.4.1.1 Voltage Sensor
The voltage sensor is implemented using a resistive voltage divider which produces an output voltage (Vout) that is a fraction of its input voltage (Vin). The divider consist of a series of two resistors R1 and R2. The relationship between input
voltage, Vin, and output voltage,Vout, is given by:
Vout=Vin· R2
R1 +R2 (3.1)
The divider has been dimensioned to support input voltages up to55 V. The ra-tionale behind this choice is that standard Power–Over–Ethernet injectors typically used to power networking devices are characterized by an output voltage of 48 V. In particular, R1 = 10 KΩ and R2 = 100 KΩ, which result in an output voltage
24
Chapter 3. Energino: Hardware and Software Solution for Power Consumption Monitoring of Wireless Access Networks
3.4.1.2 Current Sensor
The current sensor consists of a linear Hall–effect3
circuit capable of measuring currents between −5 A and +5 A. An applied current flowing through this circuit generates a magnetic field which is sensed by the integrated Hall IC and converted into a proportional voltage. The output of the device when no current is flowing through the sensor is 2.5 V. The sensitivity of the device is 185 mV/A, i.e. for each ampere flowing through the current sensor the voltage on its output linearly increases of 185 mV. For example when a 5 A current is applied, the corresponding voltage read on the output is 3.425 V. Reversely, if a negative current of −5 A is applied, the output will read 1.575 V.
3.4.1.3 Relay
Finally, a solid state relay (SSR) is used in order to turn on/off the network device being monitored. An SSR is an electronic switching device where a small control signal controls a larger load. It comprises a voltage or current sensor which responds to an appropriate input (control signal), a solid–state electronic switching device which switches power to the load circuitry either on or off, and some coupling mechanism to enable the control signal to activate this switch without mechanical parts. The device used in our system is a Crydom MPDCD3-B4
. This SSR relay can switch loads up to 3A@60VDC using a control voltage of 3 to 32 volts direct current (VDC).
3.4.2 Software Details
The Arduino hardware[ard] is programmed using the C/C++ programming lan-guage with some simplifications and modifications. A library, called Wiring, is provided in order to make common input/output operations easier. Finally, a cross–platform Integrated Development Environment (IDE) written in Java is made available. Such IDE supports basic editing capabilities (syntax highlighting, and automatic indentation) and is also capable of compiling and uploading programs to the board effectively supporting the entire application life–cycle.
The software which managesenerginoperiodically transmits over the USB inter-face (i) the average power , (ii) the actual voltage and (iii) actual current consumed by the monitored device during the last observation period. The actual input voltage is given by:
Vreal= 0.0049·Vraw
R1 +R2
R2 = 0.0293·Vraw (3.2)
Where,
3
The Hall effect is the generation of an electric potential perpendicular to both an electric current flowing along a conducting material and an external magnetic field.
4
3.5. Validation of Energino 25
Figure 3.2: Energino: Hardware and software solution for power consumption monitoring
• Vraw is the outputs of the voltage sensors;
• Vreal is the the actual converting voltage consumed by the monitored device;
Similarly, the actual input current is given by:
Ireal=
0.0049·Iraw−2.5
0.185 = 0.026·Iraw−13.51 (3.3)
Where,
• Iraw is the outputs of the current sensors;
• Ireal is the the actual converting current consumed by the monitored device;
It is worth noticing that during each sampling period the Arduino continuously polls the voltage and the current sensors and accumulates the values into two sep-arate registers. At the end of the polling period the average power consumption is computed and the result is sent over the USB interface. This is done in order to filter–out fluctuations in the values read from the analog inputs.
3.5
Validation of Energino
In this section, we present the experimental evaluation of energino power meter in laboratory tests. Here, the current and voltage sensed by energino are compared with the current and voltage generated and measured by HAMEG Instrument5
an AC/DC power supply and current sensor. In Fig. 3.2 the energino power meter hardware solution for power consumption monitoring is shown.
Fig.3.3a simple circuit used to the validation ofenergino power meter is shown. In this there is a HAMEG Instrument DC power supply (-25 V up to + 25 V),
5
26
Chapter 3. Energino: Hardware and Software Solution for Power Consumption Monitoring of Wireless Access Networks
Figure 3.3: Simple circuit used for the validation of energino power meter
energino power meter and a potentiometer (50 KΩ-500 KΩ)6
. To measure the voltage, the authors varied the voltage injected to the circuit from -25 V until 25 V in steps of 5 V. The voltage and current dropped on the potentiometer is monitoring for energino power meter during 100s for each sample. In order to change the level of current flowing in the circuit, we fixed the voltage to 5 V and varied the resistance of the potentiometer.
The voltage generated by HAMEG Instrument is compared with the en-ergino voltage outputs in Fig. 3.4awhile the current measured by HAMEG Instru-ment and energino power meter are shown in Fig. 3.4b, each sample is presented with the 95% confidence interval. As it can been seen in the figures, the empirical voltage and current data–points delivered by HAMEG Instrument are plotted to-gether with the values measured using energino power meter, the values measured by theenergino power meter are matching very well with the data–points generated and measured with HAMEG Instrument.
It is important to note that energino power meter is also experimentally evalu-ated in practical scenarios in Chapter 4, where the power consumption behavior of WADs working with WiFi and WiMAX technologies are presented.
3.6
Conclusions
In this Chapter, we introducedenergino, an affordable solution for real–time energy consumption monitoring in wireless networks. The hardware schematics and the software architecture were discussed in order to encourage the research community to use and extend energino. The main features ofenergino are:
• Arduino–based, a flexible platform with a very active community;
6
3.6. Conclusions 27
1 2 3 4 5 6 7 8 9 10 11 12 0.1
0.2 0.3 0.4 0.5 0.6 0.7 0.8 0.9 1
Samples
Current [mA]
Measured Current Energino Output
(a) Current Comparison
1 2 3 4 5 6 7 8 9 10 11 −25
−20 −15 −10 −5 0 5 10 15 20 25
Samples
Voltage [V]
Generated Voltage Energino Output
(b) Voltage Comparison
Figure 3.4: Comparison of voltage and current values measured by HAMEG Instru-ment and energino power meter
• High sampling rate, up to 10000 voltage/current samples per second;
• High resolution, configurable from 26 mA down to 1 mA;
• Low cost/low power, it costs about 80 eto assemble an energino complete
with Ethernet connectivity;
• Manageability, the device being monitored by energino can be turned on/off remotely using the embedded RESTful interface;
Chapter 4
Power Consumption Behavior of
Wireless Access Devices
(WiFi and WiMAX Technologies)
Contents
4.1 Introduction . . . 30
4.2 WiFi Outdoor WADs: Power Consumption Behavior of Outdoor
IEEE 802.11g Wireless Access Devices. . . 31
4.2.1 Network Settings . . . 31
4.2.2 Testing Methodology . . . 32
4.2.3 Experimental Measurements and Analysis for IEEE 802.11g
Wireless Access Devices . . . 33
4.2.4 Measurements of Power Consumption versus Transmissions
Power Level . . . 40
4.3 WiFi Indoor WADs: Power Consumption Behavior of Indoor
IEEE 802.11g and IEEE 802.11n Wireless Access Devices . . . 43
4.3.1 Network settings . . . 44
4.3.2 Testing Methodology . . . 45
4.3.3 Experimental Measurements and Analysis for IEEE 802.11n
Wireless Access Devices . . . 46
4.3.4 Power Consumption Behavior Comparison between IEEE
802.11g and IEEE 802.11n Indoor Wireless Access Devices . 49
4.4 WiMAX Outdoor WADs: Power Consumption Behavior of
IEEE 802.16 Wireless Access Devices . . . 57
4.4.1 Network settings . . . 57
4.4.2 Testing Methodology . . . 59
4.4.3 Experimental Measurements and Analysis for IEEE 802.16
Wireless Access Devices . . . 60
30
Chapter 4. Power Consumption Behavior of Wireless Access Devices (WiFi and WiMAX Technologies)
4.1
Introduction
In the last years, wireless local area networks (WLANs) have become the most pop-ular wireless access technology. Due to their rapid evolution in terms of sustained data rates, reduced cost of equipment and ease of deployment, WLANs are nowa-days extensively used by corporations, universities and municipalities in order to provide Internet connectivity to end users. Trends