Authentication of virgin olive oil by using dielectric spectroscopy
combined with some artificial intelligence methods
Mahmoud Soltani Firouz
1*,
Mahdi Rashvand
2, Nima Teimouri
1, Mahmoud Omid
1 (1. Department of Agricultural Machinery Engineering, Faculty of Agricultural Engineering & Technology, College of Agriculture &Natural Resources, University of Tehran, Daneshkadeh Ave., Karaj-Iran;
2. Machine design and Mechatronics Department, Institute of Mechanics, Iranian Research Organization for Science and Technology (IROST) Sh. Ehsani Rad St., Enqelab St., Parsa Sq., Ahmadabad Mostoufi Rd., Azadegan Highway, Tehran, Iran
Zipecode: 33535-111)
Abstract: Adulteration is a serious problem in food industry. Olive oil is widely adulterated with other cheap edible oils such
as sunflower and canola oils. Therefore, developing a low-cost, practical and rapid analytical method for detecting such adulteration in olive oil would be useful and needed. In this research, we aimed to develop a dielectric measurement based system combined with complementary analytical intelligent techniques to recognize authentication of virgin olive oil from adulterated with vegetable oils (canola and sunflower). 192 sinusoidal signals in the range of 20 kHz and 20 MHz were feed into the cylindrical dielectric sensor filled with oil sample. Correlation based feature selection (CFS) was applied to select the most appropriate dielectric features and eliminate irrelevant data. Support vector machines (SVMs), artificial neural networks (ANNs) and decision trees (DTs) were developed to classify virgin olive oil samples from adulterated ones. The obtained results indicated that ANN with topology of 2-5-3 had the best performance with accuracy of 100%.
Keywords: olive oil, authentication, dielectric properties, data mining
Citation: Soltani Firouz,M., M. Rashvand, N. Teimouri, and M. Omid. 2019. Authentication of virgin olive oil by using
dielectric spectroscopy combined with some artificial intelligence methods. Agricultural Engineering International: CIGR Journal, 21(4): 224–230.
1 Introduction
Adulteration of food products can be very beneficial for food manufacturers, raw material suppliers and distributors. Produces adulteration is not only a major economic fraud, but can also have major health implications for consumers (Tay et al., 2002). Adulteration involved replacement of high-cost ingredients with cheaper substitutes. Olive oil is also subjected to be adulterated with other edible oils of lower commercial value, frequently (Flores et al., 2006). Adulteration in olive oil is done by economic reasons.
Received date: 2018-11-01 Accepted date: 2019-04-28
* Corresponding author: Mahmoud Soltani Firouz, Ph.D.,
Department of Agricultural Machinery Engineering, Faculty of Agricultural Engineering and Technology, University of Tehran, Karaj, Iran. Email: [email protected], Tel: +989191657116, Fax: +982632814411.
time consuming, expensive, generally destructive (the examined sample is unusable) of the sample material and require a high degree of technical knowledge when interpreting the data. There is an increasing demand for the development of new rapid and sensitive methods instead of traditional time-consuming and expensive analysis techniques (Gurdeniz and Ozen, 2009).
Tay et al. (2002) focused on the application of Fourier transform infrared spectroscopy to identify the adulteration of olive oils adulterated with varying concentrations of sunflower oil. Gurdeniz and Ozen (2009) focused on the detection and quantification of extra-virgin olive oil adulterated with different edible oils using mid-infrared (IR) spectroscopy with chemometrics. They analyzed the obtained data with a general principle component analysis (PCA) model and partial least square (PLS). Rohman and Man (2010) developed a Fourier transform infrared spectroscopy for analysis of extra virgin olive oil adulterated with palm oil. They used PLS and principle component regression (PCR) optimized for constructing the calibration models. The discriminant analysis was also used for the classification analysis between pure olive oil and that adulterated with the other vegetable oils (palm oil, corn oil, canola oil and sunflower oil). The main problems of the mentioned methods are their high complexity and cost of implementation. Thus, developing a new method that can solve such problems with high precision and low processing time is necessary. Therefore, implementing non-destructive and cheap techniques such as dielectric spectroscopy with its remarkable advantages like high accuracy, quick response and high repeatability is inevitable. Then, due to the advantages of dielectric spectroscopy technique, it can be properly applied to detect adulteration in olive oil. This study aims to demonstrate the applicability of dielectric measurements as a rapid method combined with complementary analytical intelligent techniques to improve determination of olive oil adulteration with vegetable oils (canola and sunflower). In the previous work (Rashvand et al., 2016), PCA and LDA techniques were used to detect the adulteration of olive oil. In this research, other techniques (ANN, SVMs and DTs) were used to validate the test.
2 Materials and methods
2.1 Sample preparation
Virgin olive oil samples were obtained from Khorramshar Extraction Oil Company. Sunflower and canola oils are the main edible oils that are used in adulteration of virgin olive oil, due to their low price, appearance and chemical similarities of adulterated olive oil by these oils with the original ones. So, the samples of sunflower and canola oils were prepared at the same time as preparing virgin olive oil. For canola and sunflower oils adulteration, virgin olive oil samples were blended with canola and sunflower oils at 0%-50% (cc/cc). Finally, three classes including virgin olive oil and olive oil mixed with sunflower and canola oils were obtained. Composition of each corn/sunflower adulterated olive oil sample is presented in Table 1.
Table 1 Volumetric percentages of sunflower, canola and olive oil in 5%-50% adulterated samples
Sample number Olive oil (%) Adulterated oil
1 100 0
2 95 5
3 90 10
4 80 20
5 70 30
6 60 40
7 50 50
Sunflower oil (%)
8 95 5
9 90 10
10 80 20
11 70 30
12 60 40
13 50 50
Canola oil (%)
2.2 System setup
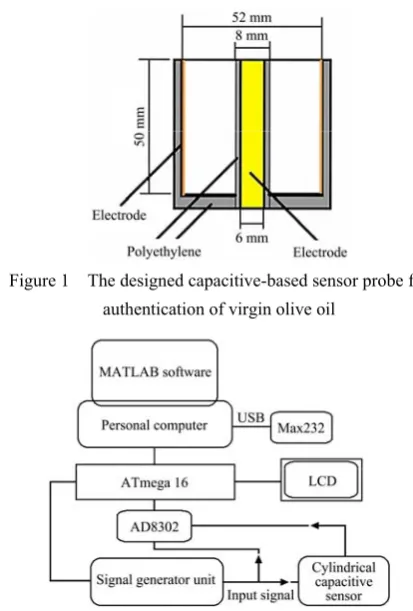
An electronic system was designed to extract dielectric features based on dielectric measurement in the range of radio frequency. The electrodes of the cylindrical capacitive-based sensor probe were made of cupper material with volume of 100 cc (Figure 1).
constant and the loss factor of dielectric material in the capacitive sensor (Soltani et al., 2015)
2 Δ
1 360
φ c
ε
d f
⎛ ⎞
′ = +⎜ ⎟
⎝ ⎠ (1)
Δ
8.68
A c
ε ε
π d f
′′= ′
× (2)
where, c is the speed of light (m s-1); f is the frequency of signal (Hz); d is the thickness of the layer of material (m);
ΔA is the attenuation in decibels, and Δϕ is the phase shift in degree.
Figure 1 The designed capacitive-based sensor probe for authentication of virgin olive oil
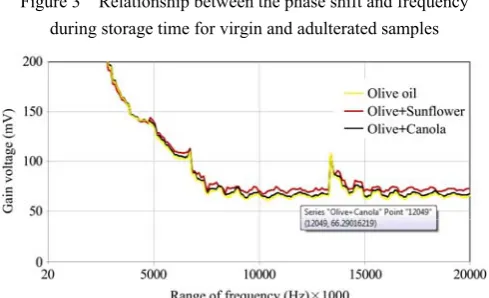
Figure 2 Block diagram of the developed electronic system
In this study, we had no intention of measuring the dielectric constant and the loss factor of oil samples, precisely. We intended to authenticate the virgin olive oil using the voltages related to the dielectric constant and the loss factor by means of artificial intelligence methodologies. Therefore, the measured voltages and related code of frequencies were transferred to the MATLAB 2014a.
Electrical experiments were carried out at room temperature (24°C±1°C). The frequency range between 20 kHz and 20 MHz sinusoidal signal was selected to feed into the capacitor probe and then 384 voltage values (192 for phase shift and 192 for gain) were extracted and recorded in a personal computer and analyzed in
MATLAB software.
2.3 Feature selection
In the real-time classification, to improve performance of classifier, selection of beneficial features and elimination of irrelevant data seems to be necessary, because the system should be easily trainable and automated. Another advantage of selection of useful data set is improvement of system’s ability and rapidity. Several techniques have been developed for selection of the important features. One of them is correlation based feature selection (CFS). CFS algorithm uses a heuristic to evaluate the score of a subset of features and the subset with the highest correlation to the class and the lowest intercorrelation is selected for classification (Hall, 1999). The CFS algorithm has been carried out on the dielectric attributes using MATLAB software.
2.4 Principal component analysis (PCA)
Component analysis is an unsupervised approach to finding the right features from the data. The most common method to analyze data is principal component analysis (PCA). In PCA, the data with d-dimension is transferred to a lower-dimensional space (Rashvand et al., 2016). This would reduce the degrees of freedom, reduce the space and time complexities. The goal is to represent the data in a space that describes the variation in a sum-squared error sense, in the best way (Duda et al., 2012)
2.5 ANN modeling
ANNs is one of the subcategories of artificial intelligence science that is widely used in data analysis and modeling. Various types of ANNs have been developed. Multilayer perceptron (MLP) is commonly used for classification and function approximation purposes (Mollazade et al., 2012). Input layer, hidden layer (s) and output layer constitute the MLP structure. MLP is a feed-forward neural network (FFNN), meaning that the data flows in one direction from input layer to output. Error minimization can be performed by gradient descent with momentum (GDM), this method was used to classify different classes of oil.
2.6 Support vector machines (SVMs)
suitable kernel function. The idea of the kernel function is to enable operations to be performed in the input space rather than the potentially high dimensional feature space. Hence the inner product does not need to be evaluated in the feature space (Omid, 2011). In this study, the polynomial function was chosen to classify the data set.
2.7 Decision trees (DTs)
DTs are extremely useful supervised learning tools in the field of data mining. These are a type of machine learning classifiers in which a divide-and-conquer approach leads to a style of representation called tree (Mollazade et al., 2012). The DTs are organized in a way that at each layer one class is rejected. The last remaining class at the bottom of the tree is considered as the winning class. In the structure of DTs, nodes involve testing a particular feature of the raisin selected feature’s vector (Kirchner et al., 2006). The outgoing branches of a node correspond to possible outcomes of the test at that node. There are a large number of DT induction algorithms described completely in the machine learning and applied statistic literatures. In the current work, three different DT induction algorithms were used to classify oil. These algorithms were J48, LMT (a classifier that combines logistic regression and decision tree learning), and CART (classification and regression trees). Readers can refer to Witten and Frank (2016) to get more information about these algorithms.
3 Result and discussion
3.1 Electrical measurements
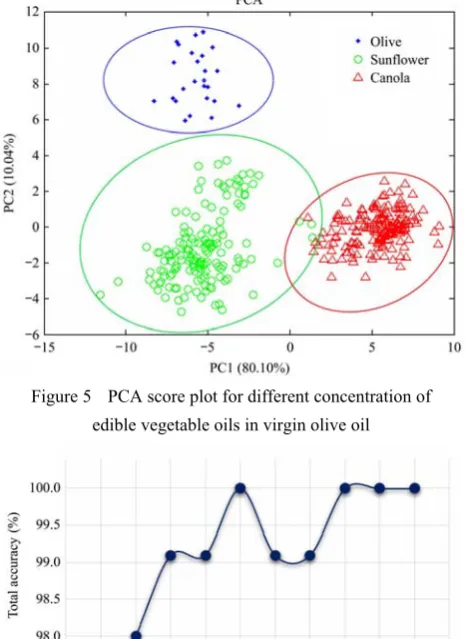
The electrical experiments were carried out in the range of 20 kHz to 20 MHz. All of the samples were categorized into three different classes which include virgin olive oil, olive adulterated by sunflower oil and olive adulterated by canola oil (respectively 25, 175, and 175 samples). We intended to consider the influence of different concentration of sunflower and canola oils in olive oil and evaluate the developed system. In this research, there were 375 observations with 384 variables (phase shift and gain, each equals to 192). Figure 3 and Figure 4 show a typical phase shift and gain related to virgin olive oil and adulterated samples, respectively.
The samples were divided into three groups randomly (50% of the set was used for training, 20% for validation,
and the remaining 30% for testing of the network).
Figure 3 Relationship between the phase shift and frequency during storage time for virgin and adulterated samples
Figure 4 Changes in gain voltage at different frequencies for virgin and adulterated oils
3.2 Feature selection
To eliminate irrelevant features through dielectric voltages, CFS was performed. For oils, among dielectric voltages, more appropriate attributes were selected by the software. In the prediction of adulteration, CFS reduced the size of feature vector from 384 attributes to 43 features.
3.3 PCA
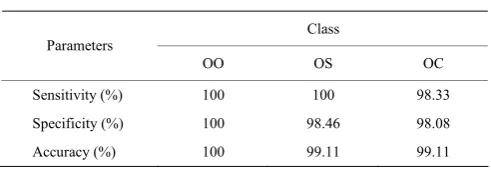
The PCA technique was used to reduce the dimension of data set and based on this method, the first component (PC1) and the second component (PC2) were extracted from 43 attributes. PC1 and PC2 contain 90.14% of total variance of the features. The result of PCA is illustrated in Figure 5. The observation of PCA score plots for all oil samples showed an acceptable performance in the identification of three categories.
3.4 ANN
appropriate for an online process. So, in this research, MLP with one hidden layer was used in the structure of ANNs. To obtain the best model with the highest performance, ANNs with different number of neuron in the hidden layer were performed and evaluated. Figure 6 shows the total accuracy of ANNs with different number of neurons using the test data (112 samples). The best result was obtained using ANN with 5 neurons in the hidden layer with accuracy of 100%. It means that ANN with topology of 2-5-3 has a perfect capability to classify oil samples into three different categories.
Figure 5 PCA score plot for different concentration of edible vegetable oils in virgin olive oil
Figure 6 Total accuracy of ANN with different number of neuron
The confusion matrix of the selected ANN is presented in Table 2. As shown in Table 3, the developed model perfectly classified oil samples.
Table 2 Confusion matrix of ANN obtained from test data sets
Desired Predicted
OO OS OC OO 5 0 0 OS 0 47 0 OC 0 0 60
Table 3 Values of sensitivity, specificity and accuracy indices for ANN classifier
Class Parameters
OO OS OC Sensitivity (%) 100 100 100
Specificity (%) 100 100 100 Accuracy (%) 100 100 100
3.5 Support vector machines (SVMs)
Selection of an appropriate kernel function was made by trial and error method on the test set (Mollazade et al., 2012). In this study, polynomial function was used to classify the test data. The confusion matrix for the test samples is presented in Table 4. Also, the amount of three indices (Se, Sp, and Ac) is presented in Table 5. The result shows that just one of the adulterated samples (OS) was misclassified into OC class and the others were successfully categorized.
Table 4 Confusion matrix obtained from the evaluation of SVMs with polynomial kernel
Desired Predict
OO OS OC
OO 5 0 0 OS 0 46 0 OC 0 1 60
Table 5 Values of sensitivity, specificity and accuracy indices for SVM classifier
Class Parameters
OO OS OC Sensitivity (%) 100 97.87 100
Specificity (%) 100 100 98.08 Accuracy (%) 100 99.11 99.11
3.6 Decision tree
Table 6 shows the results of oil classification by LMT, J48 and CART trees. According to the results, CART and LMT trees had the highest Kappa value, 0.983, and the highest total accuracy, 99.11%, compared to the J48 tree. According to the confusion matrix obtained from the test data (Table 7), there was one misclassified sample in OC samples. The value of Se for OO, OS, and OC were 100%, 100%, 98.33%, respectively (Table 8).
Table 6 Obtained results from different DTs in oil classification
Table 7 Confusion matrix for classification oil using CART method
Desired Predict
OO OS OC
OO 5 0 0 OS 0 47 1 OC 0 0 59
Table 8 Values of sensitivity, specificity and accuracy indices for DTs classifier
Class Parameters
OO OS OC
Sensitivity (%) 100 100 98.33 Specificity (%) 100 98.46 98.08 Accuracy (%) 100 99.11 99.11
The same results were reported by Merás et al. (2018). They applied fluorescence spectroscopy combined with second-order chemometric methods for the detection of adulteration in extra virgin olive oil (Merás et al., 2018). Complexity and being expensive are the main disadvantages of this method. Georgouli et al. (2017) worked on the detection of adulteration of extra virgin olive oil using mid infrared and Raman spectroscopic data (Georgouli et al., 2017). They reported that about 80% and 75% overall mean classification rate has been obtained for the classification problem with four classes (100% extra virgin olive oil; adulterated by 1%-11% hazelnut oil; adulterated by 12%-90% hazelnut oil; 100% hazelnut oil) with 82.29% for Raman and FT-IR (Fourier transform infrared) data.
4 Conclusion
In the current research, four different DM techniques were applied to determine olive oil adulterated. Comparison of testing stage of these techniques showed MLP network with 2-5-3 topology, DTs with CART algorithm, and SVM classifier with polynomial function are the best classifiers. As regards, the accuracies of the methods are close together, this can be concluded that all selected techniques, presented here, have a good potential to be used to determine olive oil fraud. The PCA technique was used to compress related features and then the extracted PCs were selected as inputs of classifiers. The results yielded that ANN with topology of 2-5-3 has the best performance with accuracy of 100%.
Acknowledgements
The authors would like to thank the Department of Agricultural Machinery Engineering, Faculty of Agricultural Engineering and Technology, University of Tehran for their contributions to this study.
References
Duda, R. O., P. E. Hart, and D. G. Stork. 2012. Pattern Classification. New York: John Wiley & Sons.
Flores, G., M. L. R. Del Castillo, G. P. Blanch, and M. Herraiz. 2006. Detection of the adulteration of olive oils by solid phase microextraction and multidimensional gas chromatography. Food Chemistry, 97(2): 336–342.
Georgouli, K., J. M. Del Rincon, and A. Koidis. 2017. Continuous statistical modelling for rapid detection of adulteration of extra virgin olive oil using mid infrared and Raman spectroscopic data. Food Chemistry, 217: 735–742.
Gurdeniz, G., and B. Ozen. 2009. Detection of adulteration of extra-virgin olive oil by chemometric analysis of mid-infrared spectral data. Food Chemistry, 116(2): 519–525.
Hall, M. A. 1999. Correlation-based feature selection for machine learning. Ph.D. diss., University of Waikato.
Kirchner, K., K. H. Tolle, and J. Krieter. 2006. Optimization of the decision tree technique applied to simulated sow herd datasets. Computers and Electronics in Agriculture, 50(1): 15–24.
Merás, I. D., J. D. Manzano, D. A. Rodríguez, and A. M. de la Peña. 2018. Detection and quantification of extra virgin olive oil adulteration by means of autofluorescence excitation-emission profiles combined with multi-way classification. Talanta, 178: 751–762.
Mollazade, K., M. Omid, and E. Arefi. 2012. Comparing data mining classifiers for grading raisins based on visual features. Computers and Electronics in Agriculture, 84(2): 124–131. Omid, M. 2011. Design of an expert system for sorting pistachio
nuts through decision tree and fuzzy logic classifier. Expert Systems with Applications, 38(4): 4339–4347.
Ou, G., R. Hu, L. Zhang, P. Li, X. Luo, and Z. Zhang. 2015. Advanced detection methods for traceability of origin and authenticity of olive oils. Analytical Methods, 7(14): 5731–5739. Rashvand, M., M. Omid, H. Mobli, and M. S. Firouz. 2016.
Adulteration detection in olive oil using dielectric technique and data mining. Sensing and Bio-Sensing Research, 11(1): 33–36.
Rohman, A., and Y. C. Man. 2010. Fourier transform infrared (FTIR) spectroscopy for analysis of extra virgin olive oil adulterated with palm oil. Food Research International, 43(3): 886–892.
prediction using dielectric and visual properties based on artificial neural network. Food analytical Methods, 8(3): 710–717.
Tay, A., R. K. Singh, S. S. Krishnan, and J. P. Gore. 2002. Authentication of olive oil adulterated with vegetable oils using
Fourier transform infrared spectroscopy. LWT-Food Science and Technology, 35(1): 99–103.