Development of empirical expression for thin layer groundnut
drying under open sun and forced convection modes
Ravinder Kumar Sahdev
1*, Mahesh Kumar
2, Ashwani Kumar Dhingra
1(1. Department of Mechanical Engineering, University Institute of Engineering&Technology, Maharshi Dayanand University,
Rohtak, 124001, Haryana, India;
2. Department of Mechanical Engineering, Guru Jambheshwar University of Sciences and Technology, Hisar, 125001, Haryana, India) Abstract: The thin layer drying behaviour of groundnut was investigated under open sun drying (OSD) and indoor forced convection drying (IFCD) modes. The groundnut samples were dried from initial moisture content of 38% (w.b.) to the safe storage moisture content of 8%-10% (w.b.). Four mathematical models were compared for describing the groundnut drying process. The performance of thin layer drying models was investigated by comparing the statistical parameters such as coefficient of correlation (R), reduced chi-square (χ2), root mean square error (RMSE), and mean bias error (MBE) between
experimental and predicted moisture ratios. Henderson and Pabis model was observed to give the highest value of R and lowest values of χ2, RMSE and MBE for the groundnut drying under both OSD and IFCD modes. The values of statistical
parameters under Lewis model were also found to be very close to Henderson and Pabis model. Therefore, Henderson and Pabis and Lewis models were found to be the best for describing the drying behaviour of groundnut under both given conditions.
Keywords: groundnut/peanut, thin layer, mathematical modelling, open sun drying, indoor forced convection drying, moisture ratio
Citation: Sahdev, R. K., M. Kumar, and A. K. Dhingra. 2017. Development of empirical expression for thin layer groundnut drying under open sun and forced convection modes. Agricultural Engineering International: CIGR Journal, 19(4): 152–158.
1 Introduction
Peanut (Groundnut), highly rich in protein (20% to 50%), fat (40% to 50%) and edible oil (43% to 55%), belongs to the bean family (Sahdev et al., 2016). It is one of the most important oilseed crop in India. It was considered to be originated in South America and then spread to other countries in the world (Zhao et al., 2012). It came into existence in India in the sixteenth century. It is also known as wonder nut, monkey nut and cashew nut for the poor people because of its highly nutritious values (Talawar, 2004).
Indian groundnut is very famous because of its taste, flavour and crunchiness. India contributes 14.83% share
Received date: 2017-01-23 Accepted date: 2017-06-13
∗ Corresponding author: Ravinder Kumar Sahdev, Department of Mechanical Engineering, University Institute of Engineering & Technology, Maharshi Dayanand University, Rohtak, 124001, Haryana, India. Email: [email protected].
of groundnut production in the world (USDA, 2017) and ranks second (6.3 metric million tons) in the production of groundnut followed by China (17 metric million tons). Exports of Indian groundnuts have reached about 5.38 metric million tons during 2015-2016 (APEDA, 2017).
are also estimated to be about 30%-40% due to improper method of drying (Sahdev et al., 2017). Moreover, farmers are also lacking with the better drying facilities. Hence, the need is felt to adopt such a method which gives continuous and controlled drying. Therefore indoor forced convection drying (IFCD) method may be adopted for the drying of groundnuts in which the product is dried
in thin layer by continuous hot air.
Simulation models are very helpful in designing a new dryer or in improving an existing dryer for the drying of agricultural products. Many researchers have carried out the studies on the mathematical modelling and experimental studies on thin layer drying phenomenon of various commodities, as given in Table 1.
Table 1 Summary of thin layer drying of various commodities under open sun and forced drying
S. No. Author and year Commodity Drying method Suggested model
1 Akpinar et al., 2003 Red pepper slices Convective dryer Diffusion model
2 Toğrul and Pehlivan, 2004 Apricots, grapes, peaches, figs and plums OSD
Diffusion model (apricot and figs), modified Henderson and Pabis model (plum) and Verma et al. model (peach).
3 Gunhan et al., 2005 Bay leaves Laboratory dryer Page model
4 Akpinar, 2006 Parsley, mint and basil OSD Modified Page model and Verma et al.
model
5 Yang et al., 2007 Peanut Trailer type dryer
Henderson-Pabis, Hummeida and Modified Oswin equilibrium moisture
content (EMC) model
6 Saeed et al., 2008 Roselle Constant temperature and humidity
chamber Two-term exponential model
7 Meisami-asl and Rafiee, 2009 Apple Laboratory convective dryer Midilli et al. model
8 Toğrul, 2010 Black grapes Laboratory dryer Page model
9 Kumar et al., 2011 Khoa OSD and greenhouse drying Exponential model
10 Kouchakzadeh and Haghihi, 2011 Pistachios Laboratory scale vacuum dryer Logarithmic model
11 Mao et al., 2012 Australian peanut Hot air drying Two term model
12 Darvishi, 2012 Potato slices microwave dryer Midilli et al. model
13 Kumar et al., 2012 Carrot pomace laboratory scale hot air forced convection dryer Hii et al. model
14 Kaleta et al., 2013 Apple Fluidized bed dryer Page model
15 Jayashree and Visvanathan, 2013 Ginger OSD Diffusion model
16 Mihindukulasuriya and Jayasuriya, 2013 Chilli hot air oven and fluidized bed dryer Midilli et al. model
17 Purkayastha et al., 2013 Tomato slices Hot air drying Logarithmic model
18 Bagheri et al., 2013 Tomato slices Laboratory dryer Page model
19 Gharehbeglou et al., 2014 Turnip Laboratory dryer Modified Henderson and Pabis and Hii,
Law and Cloke models
20 Mutuli and Mbuge, 2015 Cowpea leaves and jute mallow Convective laboratory dryer Page model
21 Taghipour et al., 2016 Lime slices Laboratory dryer Peleg model
22 Dhanushkodi et al., 2017 Cashew Solar biomass hybrid dryer Page model
From the vast literature, it is observed that the information on thin layer drying behaviour of groundnut under OSD and IFCD is not available. Therefore, this study has been carried out to fulfil the existing gap on thin layer modelling of groundnut. The main objectives of this study are (i) to investigate the drying kinetics of groundnut under OSD and IFCD modes, and (ii) to study the most suitable drying model for describing the drying behaviour of groundnut under given conditions. This study would be useful to predict the drying behaviour of groundnut in OSD and IFCD modes.
2 Materials and methods
2.1 Experimental set-up and instrumentation
mode was kept in open sun at a place with negligible wind velocity. A heat convector (Model FH-812T, Usha Shriram, made in India) was used for blowing hot air over the groundnut surface during IFCD mode. The difference of two successive readings of the weighing balance gave the water evaporated during that time interval and was used in the calculations of moisture ratio (MR).
2.2 Sample preparation and experimental procedure
Fresh groundnuts were purchased from the farmer and cleaned to remove immature and broken pods. Groundnut samples required for experimentation were remoistened by soaking in water for 12 hours and then conditioned in shed for one hour to remove the extra moisture. The experiments were performed during the months of February and May, 2016 in the climatic conditions of Rohtak (28o54′N 76o34′E), India. Groundnuts of 130 g (Sample 1) and 198 g (Sample 2) under OSD and 180 g (Sample 3) under IFCD were spread in single thin layer and the tray was kept on the electronic digital weighing balance. Observations were recorded for OSD and IFCD modes. The observation time interval for IFCD was taken as 30 minutes whereas for OSD it was an hour. The two consecutive values of weighing balance directly gave the moisture evaporated during that time interval and was used in the calculations. The groundnut samples were dried up to the safe storage moisture level of 8% to 10% (w.b.).
The experimental data obtained for the groundnut weight were used for the drying kinetics of groundnut in terms of moisture removal rate. The moisture content data for both experimental modes were converted into MR and were used for different drying models as defined in Table 2.
Table 2 Thin layer drying models
S. No. Model name Model Reference
1 Lewis MR=exp (−kt) Lewis (1921)
2 Page MR=exp(−ktn) Page (1949)
3 Modified Page MR=exp[(−kt) ]n Yaldiz et al. (2001)
4 Henderson and Pabis MR a= exp(−kt) Henderson and Pabis (1961) Note: k = drying constant (1/h); t = time (hrs); a = coefficient in the drying models, and n = number of constants in drying models.
The moisture ratio of groundnut during drying was estimated by using Equation (1) (Dejchanchaiwong et al., 2016). t e i e M M MR M M − =
− (1)
where, Mt = moisture content at ‘t’ drying time (%, dry basis); Me = equilibrium moisture content, and Mi = initial moisture content (%, dry basis).
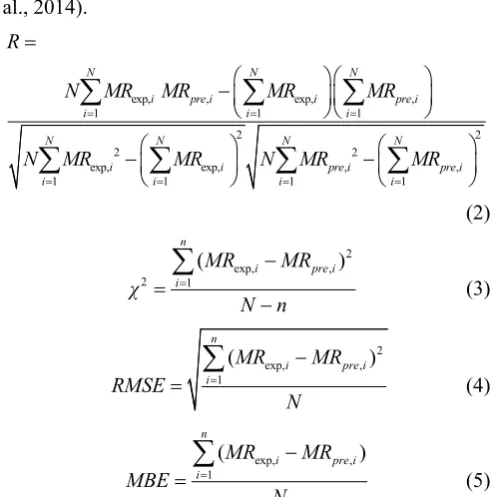
The coefficient of correlation (R), reduced chi square (χ2), root mean square error (RMSE) and mean bias error (MBE) were considered to be the primary criterion to determine the consistency of the best thin layer drying model. These parameters can be evaluated using Equations (2) to (5) (Prakash and Tiwari, 2005; Shringi et al., 2014).
R=
exp, , exp, ,
1 1 1
2 2
2 2
exp, exp, , ,
1 1 1 1
N N N
i pre i i pre i
i i i
N N N N
i i pre i pre i
i i i i
N MR MR MR MR
N MR MR N MR MR
= = = = = = = ⎛ ⎞ ⎛ ⎞ − ⎜⎝ ⎟ ⎜⎠ ⎝ ⎟⎠ ⎛ ⎞ ⎛ ⎞ −⎜ ⎟ −⎜ ⎟ ⎝ ⎠ ⎝ ⎠
∑
∑
∑
∑
∑
∑
∑
(2) 2 exp, , 2 1 ( ) ni pre i
i MR MR χ N n = − = −
∑
(3) 2 exp, , 1 ( ) ni pre i
i MR MR RMSE N = −
=
∑
(4)exp, , 1
( )
n
i pre i
i MR MR MBE N = −
=
∑
(5)where, MRexp,i is the experimentally calculated moisture ratio and MRpre,i is the predicted moisture ratio for the model. N and n are the number of observations and number of constants respectively. The model suitability was evaluated by considering the higher value of R and least values of χ2, RMSE and MBE. The drying rate (i.e.
DR) was expressed as the amount of moisture evaporated over time and is evaluated using Equation (6) (Meisami-asl and Rafiee, 2009):
t dt t
M M
DR
dt
+ −
= (6)
where, Mt is the moisture content at ‘t’ drying time (%, dry basis) and Mt+dt is the moisture content at (t+dt) drying time (%, dry basis).
3 Results and discussion
under OSD and IFCD are given in Tables 3 and 4 respectively.
Table 3 Experimental data for groundnut drying under OSD
Sample 1 Sample 2
Time, t
(hrs) Wt.(g) MR Wt.(g) MR
0 130.0 1 198.0 1
1 120.0 0.76744 182.3 0.75079
2 108.0 0.48837 164.0 0.46032
3 103.0 0.37209 157.0 0.34921
4 97.0 0.23256 148.0 0.20635
5 94.4 0.17209 144.0 0.14286
6 92.2 0.12093 141.3 0.10000
7 90.0 0.06977 139.0 0.06349
8 88.0 0.02326 137.0 0.03175
9 87.0 0 135.0 0
Table 4 Experimental data for groundnut drying under IFCD
Sample 3 Time, t
(hrs) Wt.(g) MR
0 180.3 1
0.5 156.0 0.53089
1.0 144.3 0.30502
1.5 136.2 0.14865
2.0 131.7 0.06178
2.5 128.5 0
The groundnut samples were dried from initial moisture content of 38% (w.b.) to the safe storage moisture content of 8% to 10% (w.b.). Moisture ratio data of groundnut samples were fitted to four thin layer drying models and the statistical parameters such as R,χ2, RMSE and MBE along with their constants are summarized in Tables 5 and 6 respectively.
Table 5 Modeling of MR for thin layer drying of groundnut under OSD
Sample no. Model name k n a R RMSE χ2 MBE
Lewis 0.254911 0.99667 0.09402 0.00994 0.08328
Page 0.063051 0.3170 0.96067 0.62474 0.50182 0.55646
Modified Page 0.214199 0.1049 0.79433 0.21653 0.06028 0.08474
Sample 1
Henderson and Pabis 0.43002 1.21546 0.99238 0.07555 0.00734 0.01763
Lewis 0.266072 0.99487 0.09839 0.01089 0.08726
Page 0.050828 0.3008 0.96029 0.65741 0.55566 0.58911
Modified Page 0.504912 0.0654 0.77821 0.21855 0.06141 0.07942
Sample 2
Henderson and Pabis 0.419298 1.1109 0.99588 0.04007 0.00206 0.00715
Table 6 Modeling of MR for thin layer drying of groundnut under IFCD condition
Sample no. Model Name k n a R RMSE χ2 MBE
Lewis 0.77547 0.99759 0.09665 0.01168 0.08640
Page 0.44056 0.24973 0.98163 0.56470 0.53147 0.49330
Modified Page 0.31849 1.91987 0.86050 0.50995 0.43341 0.45221
Sample 3
Henderson and Pabis 1.36829 1.06832 0.99842 0.03468 0.00200 0.00787
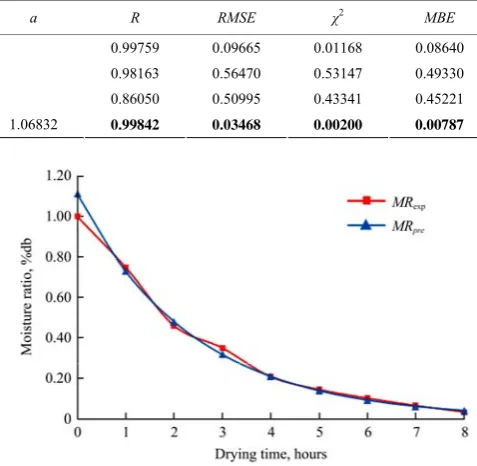
The variation of moisture ratio with respect to drying time for the drying of groundnut samples 1, 2 (OSD) and 3 (IFCD) are shown in Figures 1, 2 and 3 respectively.
Figure 1 Variation of moisture ratio with respect to drying time for the drying of groundnut sample 1 under OSD mode
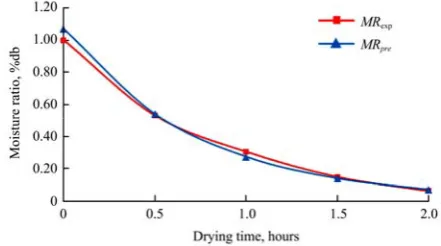
Figure 3 Variation of moisture ratio with respect to drying time for the drying of groundnut sample 3 under IFCD mode
Figure 4 Variation of drying rate with respect to drying time for the drying of groundnut under OSD mode
Figure 5 Variation of drying rate with respect to drying time for the drying of groundnut under IFCD mode
From the Tables 5 and 6, it is observed that Henderson and Pabis model with highest value of R
(0.99588 and 0.99842) and lowest values of χ2 (0.00206 and 0.00200), RMSE (0.04007 and 0.03468) and MBE
(0.00715 and 0.00787) was found to be most suitable for groundnut drying under both, i.e., OSD and IFCD modes among all the models investigated. Yang et al. (2007) has also suggested the Henderson and Pabis model for drying groundnuts inside a trailer type dryer. From Tables 5 and 6, it is also observed that the values of statistical parameters under Lewis model are also very close to the values under Henderson and Pabis model. Groundnut
drying under both modes occurred in the falling rate drying period from initial to final moisture content. From Table 5, it can be seen that the value of drying constant ‘k’ during drying of groundnuts under OSD mode for Lewis model is observed to be 0.254911 and 0.266072 and for Henderson and Pabis model it is found to be 0.43002 and 0.419298 for sample 1 and sample 2 respectively. From Table 6, it can be seen that the value of drying constant ‘k’ for drying of groundnuts under IFCD condition for Lewis model is found to be 0.77547 and for Henderson and Pabis model it is found to be 1.36829. It is pertinent to mention here that the air temperature for IFCD condition was higher than the OSD condition throughout the experiment. Thus, it can be concluded that the value of drying rate constant increases with the increase in drying air temperature. Similar results have also been reported in the literature for drying apricots, grapes, peaches, figs and plums (Toğrul and Pehlivan, 2004), red pepper slices (Akpinar, 2006), apple (Meisami-asl and Rafiee, 2009), pistachios (Kouchakzadeh and Haghihi, 2011), and tomato slices (Bagheri et al., 2013). From Figures 4 and 5, it is observed that the drying rate is higher in case of IFCD condition. This means that the time required to dry the groundnut up to the safe storage moisture content forced convection mode is shorter.
4 Conclusion
also observed to be very close to Henderson and Pabis model. Drying rate during IFCD mode was found to be higher than OSD. Therefore, it is concluded that the Henderson and Pabis and Lewis models are the most suitable for describing the drying behaviour of groundnut sample in OSD and IFCD modes.
References
Akpinar, E. K. 2006. Mathematical modelling of thin layer drying process under open sun of some aromatic plants. Journal of Food Engineering, 77(4): 864–870.
Akpinar, E. K., Y. Bicer, and C. Yildiz. 2003. Thin layer drying of red pepper. Journal of Food Engineering, 59(1): 99–104. Agricultural and Processed Food Products Export Development
Authority (APEDA). 2017. India Export of Agro Food Products. Available at: http://agriexchange.apeda.gov.in/ indexp/Product_description_32head.aspx?gcode=0501.
Accessed 4 January 2017.
Bagheri, H., A. Arabhosseini, M. H. Kianmehr, and G. R. Chegini. 2013. Mathematical modeling of thin layer solar drying of tomato slices. CIGR Journal, 15(1): 146–153.
Darvishi, H. 2012. Energy consumption and mathematical modeling of microwave drying of potato slices. CIGR Journal, 14(1): 94–102.
Dejchanchaiwong, R., A. Arkasuwan, A. Kumar, and P. Tekasakul. 2016. Mathematical modeling and performance investigation of mixed-mode and indirect solar dryers for natural rubber sheet drying. Energy for Sustainable Development, 34: 44–53. Dhanushkodi, S., V. H. Wilson, and K. Sudhakar. 2017.
Mathematical modeling of drying behavior of cashew in a solar biomass hybrid dryer. Resource-Efficient Technologies, 1–8. (in press)
Gharehbeglou, P., B. Askari, A. H. Rad, S. S. Hoseini, H. T. Pour, and A. H. E. Rad. 2014. Investigating of drying kinetics and mathematical modeling of turnip. CIGR Journal, 16(3): 194–204.
Gunhan, T., V. Demir, E. Hancioglu, and A. Hepbasli. 2005. Mathematical modelling of drying of bay leaves. Energy Conversion and Management, 46(11): 1667–1679.
Henderson, S. M., and S. Pabis. 1961. Grain drying theory I. Temperature effect on drying coefficient. Journal of Agricultural Engineering Research, 6(3): 169–174.
Jayashree, E., and R. Visvanathan. 2013. Mathematical modeling for thin layer sun drying of ginger (Zingiber officinale Rosc.).
Journal of Spices and Aromatic Crops, 22(1): 24–30. Kaleta, A., K. Górnicki, R. Winiczenko, and A. Chojnacka. 2013.
Evaluation of drying models of apple (var. Ligol) dried in a fluidized bed dryer. Energy Conversion and Management, 67: 179–185.
Kouchakzadeh, A., and K. Haghighi. 2011. Modeling of vacuum-infrared drying of pistachios. CIGR Journal, 13(3): 1–6.
Kumar, M., K. S. Kasana, S. Kumar, and O. Prakash. 2011. Experimental investigation on convective heat transfer coefficient for khoa drying. International journal of current research, 3(8): 88–93.
Kumar, N., B. C. Sarkar, and H. K. Sharma. 2012. Mathematical modelling of thin layer hot air drying of carrot pomace.
Journal of food science and technology, 49(1): 33–41. Lewis, W. K. 1921. The rate of drying of solid materials. Industrial
& Engineering Chemistry, 13(5): 427–432.
Mao, S., G. Srzednicki, and R. H. Driscoll. 2012. Modeling of drying of selected varieties of Australian peanuts. Drying Technology, 30(16): 1890–1895.
Meisami-asl, E., and S. Rafiee. 2009. Mathematical modeling of kinetics of thin-layer drying of apple (var. Golab). CIGR Journal, XI: 1–10.
Mihindukulasuriya, S. D., and H. P. Jayasuriya. 2013. Mathematical modeling of drying characteristics of chilli in hot air oven and fluidized bed dryers. CIGR Journal, 15(1): 154–166.
Mutuli, G. P., and D. Mbuge. 2015. Drying characteristics and energy requirement of drying cowpea leaves and jute mallow vegetables. CIGR Journal, 17(4): 265–272.
Page, G. E. 1949. Factors Influencing the Maximum Rates of Air Drying Shelled Corn in Thin layers. M. S. thesis. West Lafayette, Indiana: Purdue University.
Prakash, O., and G. N. Tiwari. 2005. Empirical expressions for convective and evaporative heat transfer coefficients for the drying of concentrated sugar-cane juice. International Journal of Ambient Energy, 26(1): 45–55.
Purkayastha, M. D., A. Nath, B. C. Deka, and C. L. Mahanta. 2013. Thin layer drying of tomato slices. Journal of Food Science and Technology, 50(4): 642–653.
Saeed, I. E., K. Sopian, and Z. Z. Abidin. 2008. Drying characteristics of roselle (1): mathematical modeling and drying experiments. CIGR Journal, XI: 1–25.
Sahdev, R. K., M. Kumar, and A. K. Dhingra. 2015. Present status of peanuts and progression in its processing and preservation techniques. CIGR Journal, 17(3): 309–327.
Sahdev, R. K., M. Kumar, and A. K. Dhingra. 2016. A review on applications of greenhouse drying and its performance. CIGR Journal, 18(2): 395–412.
Sahdev, R. K, M. Kumar, and A. K. Dhingra. 2017. A comprehensive review on greenhouse shapes and its applications. Frontiers in Energy, 1–12.
Analysis and Calorimetry, 118(1): 533–539.
Taghipour, M., M. B. Kakolaki, A. Zomorodian, and S. M. Nassiri. 2016. Determination of equilibrium isotherms and proper mathematical model for lime slices. CIGR Journal, 18(1): 284–293.
Talawar, S. 2004. Peanut in India: History, Production and Utilization. Peanut in local and global food system series report no. 5. Online. Available at: http://caes2.caes.uga.edu/ commodities/fieldcrops/peanuts/pins/documents/indiaproducti on.pdf. Accessed 21 December 2016.
Toğrul, İ. T. 2010. Modelling of heat and moisture transport during drying black grapes. International Journal of Food Science & Technology,45(6): 1146–1152.
Toğrul, İ. T., and D. Pehlivan. 2004. Modelling of thin layer drying kinetics of some fruits under open-air sun drying process.
Journal of Food Engineering, 65(3): 413–425.
United States Department of Agriculture (USDA). 2017. Foreign Agricultural Service. Available at: https://apps.fas.usda.gov/ psdonline/app/index.html#/app/statsByCommodity. Accessed 4 January 2017.
Yaldiz, O., C. Ertekin, and H. I. Uzun. 2001. Mathematical modeling of thin layer solar drying of sultana grapes. Energy, 26(5): 457–465.
Yang, C. Y., D. S. Fon, and T. T. Lin. 2007. Simulation and validation of thin layer models for peanut drying. Drying technology, 25(9): 1515–1526.
Zhao, X., J. Chen, and F. Du. 2012. Potential use of peanut by-products in food processing: a review. Journal of Food Science and Technology, 49(5): 521–529.
Nomenclature
a Coefficient in the drying models
k Drying constants (1/h)
DR Drying rate (g water/g dry matter·min)
MR
exp,i Moisture ratioMRpre
,i Experimental moisture ratioMe
Predicted moisture ratioMi
Equilibrium moisture contentMt
Initial moisture content (%, dry basis)Mt
+dt Moisture content at ‘t’ drying time (%, dry basis)MBE
Moisture content at (t+dt) drying time (%, dry basis)MBE Mean bias error
N Number of observations
n Number of constants in drying models
RMSE Root mean square error