PRIMARY RESEARCH
Long noncoding RNA BSN-AS2 induced
by E2F1 promotes spinal osteosarcoma
progression by targeting miR-654-3p/SYTL2 axis
Xianwei Zhou
1, Jitian Li
2, Junyan Teng
3, Yufeng Liu
1, Di Zhang
1, Linyun Liu
3and Wenming Zhang
1*Abstract
Spinal osteosarcoma (OS) is a rare and aggressive malignancy. Long noncoding RNA (lncRNA) BSN-AS2 has been shown to be an oncogenic gene in several cancers. However, the role and function of BSN-AS2 in spinal OS were unfamiliar. Our study identified that BSN-AS2 expression was boosted in spinal OS tissues and cell lines. Transcription factor E2F1 induced the upregulation of BSN-AS2 expression in spinal OS cells. Afterwards, loss-of-function assays indicated that BSN-AS2 depletion reduced cell proliferation, migration and invasion as well as promoted cell apop-tosis in spinal OS. Thereafter, RIP, RNA pull down and luciferase reporter assays manifested BSN-AS2 could sponge miR-654-3p in spinal OS. After that, the binding effect of between miR-654-3p and SYTL2 was proved. Finally, rescue experiments illustrated that miR-654-3p inhibition or SYTL2 overexpression could counteract the inhibitory effect caused by BSN-AS2 deficiency on spinal OS progression. In conclusion, the availability of miR-654-3p was antagonized by E2F1-induced BSN-AS2 for SYTL2-meidated spinal OS progression.
Keywords: BSN-AS2, E2F1, miR-654-3p, SYTL2, Spinal osteosarcoma
© The Author(s) 2020. This article is licensed under a Creative Commons Attribution 4.0 International License, which permits use, sharing, adaptation, distribution and reproduction in any medium or format, as long as you give appropriate credit to the original author(s) and the source, provide a link to the Creative Commons licence, and indicate if changes were made. The images or other third party material in this article are included in the article’s Creative Commons licence, unless indicated otherwise in a credit line to the material. If material is not included in the article’s Creative Commons licence and your intended use is not permitted by statutory regulation or exceeds the permitted use, you will need to obtain permission directly from the copyright holder. To view a copy of this licence, visit http://creat iveco mmons .org/licen ses/by/4.0/. The Creative Commons Public Domain Dedication waiver (http://creat iveco mmons .org/publi cdoma in/ zero/1.0/) applies to the data made available in this article, unless otherwise stated in a credit line to the data.
Background
Osteosarcoma (OS) is a common type of primary malig-nant tumor of bone. It is more frequently occurring in the extremities than in the spine [1–3]. OS mainly occurs in children and adolescents [4]. Primary OS of the spine is very rare, and among all spinal malignancies, spinal OS only accounts for 3–5% [5, 6]. As a result of its rarity, there is still limited case for successful treatment of spi-nal OS [7, 8]. Unfortunately, the high rates of recurrence, metastasis and mortality of spinal OS resulted in an extremely low 5-year survival rate of it [9, 10]. Therefore, exploring novel biomarkers participated in the pathogen-esis of spinal OS is of great significance.
Long noncoding RNAs (lncRNAs) are a group of non-coding RNAs that generally are defined as RNA tran-scripts of over 200 nucleotides without protein coding ability [11]. Previously, researchers have identified that lncRNAs play a pivotal part in various biological pro-cesses, such as cell proliferation, invasion and migra-tion [12–14]. Moreover, lncRNAs are largely found to be implicated with the development of cancers. For exam-ple, silence of lncRNA TUG1 inhibits the progression of thyroid cancer via targeting miR-145/ZEB1 axis [15]. LncRNA CCAL promotes the progression of colorectal cancer by suppression of activator protein 2α (AP-2α) to activate Wnt/β-catenin pathway [16]. LncRNA PEG10 is boosted in esophageal cancer tissues, and inhibition of PEG10 alleviates cell proliferation and invasion, and induces apoptosis in esophageal cancer [17]. Upregula-tion of lncRNA BCAR4 accelerates the malignant devel-opment of non-small cell lung cancer, indicating BCAR4 might serve as a potential biomarker for non-small cell
Open Access
*Correspondence: [email protected]
1 Spine Surgery, Luoyang Orthopedic Hospital of Henan Province, No. 100 Yongping Road, Zhengzhou 450000, Henan, China
lung cancer treatment [18]. In our research, lncRNA BSN-AS2 was found to aberrantly highly express in spi-nal OS tissues compared with adjacent normal tissues. Besides, BSN-AS2 differentially expressed in pheochro-mocytoma (PCC) samples and was recognized as an independent prognostic biomarker and potential thera-peutic target for PCC [19]. Nevertheless, the underly-ing role and function of lncRNA BSN-AS2 in spinal OS was largely unknown. Additionally, BSN-AS2 is a newly-identified lncRNA and related research about its role in cancers is extremely limited. However, its abnormal upregulation in spinal OS tissues interested us.
The E2F transcription factors are vital participants in various cellular events in cancers [20]. Among the E2F family, E2F1 is the most thoroughly studied transcrip-tion factor in human malignancies, which exerts impor-tant effect in regulating cancer progression. For instance, transcription factor E2F1 aggravates EMT progres-sion in small cell lung cancer via modulating ZEB2 [21]. Transcription factor E2F1 regulates proliferative and apoptotic functions in hepatocellular carcinoma [22]. However, the function of E2F1 in spinal OS still needs to be clarified.
In our study, we focused on investigating the role of BSN-AS2 in spinal OS, and our results might provide some inspirations for finding an underlying biomarker for spinal OS treatment.
Methods
Tissue samples
50 matched samples of osteosarcoma tissues and adjacent normal tissues were collected under the approval from the Ethical Committee of Luoyang Orthopedic Hospi-tal of Henan Province. In the present study, all patients signed the informed consent forms and none had treated by chemotherapy or radiotherapy before study. All tissue specimens were frozen in liquid nitrogen instantly after surgical resection, and then stored at −80 °C until RNA extraction.
Cell culture
Human osteoblasts (hFOB) and OS cells (U2OS, Saos-2, MG-63 and SW1353) were bought from Chinese Acad-emy of Sciences (Beijing, China), and cultured in DMEM (Invitrogen, MA, USA) containing 10% fetal bovine serum (FBS; Invitrogen), 1% penicillin/streptomycin (Sigma-Aldrich, Milan, Italy). Besides, an incubator of 5% CO2 at 37 °C was applied.
Cell transfection
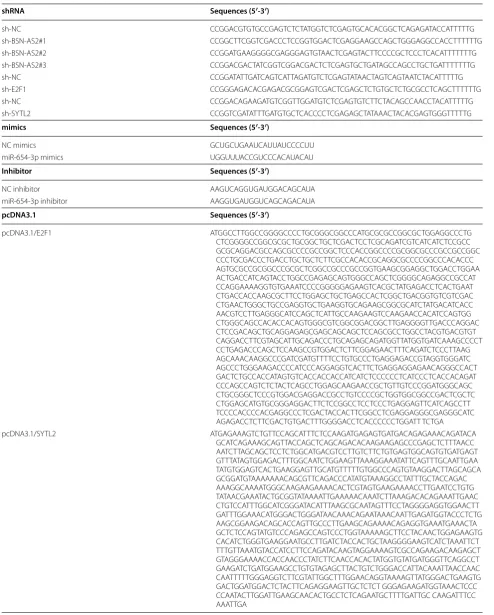
U2OS and Saos-2 cells were transfected with specific shRNAs against E2F1 (sh-E2F1), BSN-AS2 (sh-BSN-AS2#1#2#3), SYTL2 (sh-SYTL2) and the negative control
(sh-NC), and pcDNA3.1/E2F1, pcDNA3.1/SYTL2 and the empty pcDNA3.1 vector (GenePharma, Shanghai, China). The miR-654-3p mimics and NC mimics were gained from GenePharma. Each plasmid was transfected into cells via Lipofectamine 2000 (Invitrogen). Related sequences were provided in Table 1.
Quantitative real‑time PCR (qRT‑PCR)
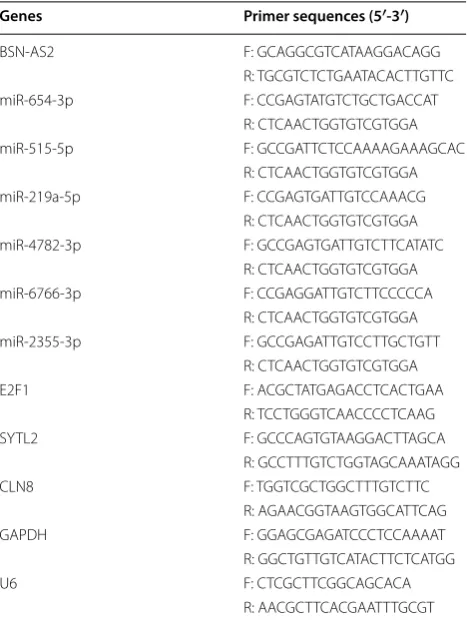
Total RNA was extracted from cultured cells utiliz-ing TRIzol reagent (Invitrogen) and then was reverse transcribed into cDNA using Reverse Transcription Kit (Takara, Dalian, China). qRT-PCR was progressed by SYBR-Green Real-Time PCR Kit (Takara). Relative expression quantity was calculated with usage of 2−ΔΔCT
method, and normalized to GAPDH/U6. Related primer sequences were provided in Table 2.
ChIP assay
U2OS and Saos-2 cells were cross-linked with formal-dehyde (Sigma-Aldrich) for 10 min and the reaction was terminated by using glycine treatment for 10 min. The extracted chromatin was sonicated and fragmented into 150–900 bp. Anti-E2F1 (ab179445; Abcam, Cambridge, MA, USA; 1/1000) and anti-IgG (#2729; Cell Signaling Technology, Danvers, MA, USA; 1/1000) were used to be immunoprecipitated with chromatin fragments. After cleaning, elution, and de-crosslinking, qRT-PCR was performed.
Western blot
Protein was obtained from cells with RIPA lysis buffer (Beyotime, Shanghai, China) supplied with protease inhibitors. Protein was separated through SDS-PAGE and moved to PVDF membranes (Millipore, Darmstadt, Germany). After being sealed with 5% skimmed milk, the membranes were cultivated with primary antibodies for E2F1 (ab218527, 1/1000), SYTL2 (ab231133, 1/1000), Akt (ab235958, 1/1000), p-Akt (ab81283, 1/5000), ERK (ab54230, 1/1000), p-ERK (ab201015, 1/1000) and GAPDH (ab8245, 1/1000) from Abcam (Cambridge, USA). Secondary antibodies were added for cultivating for 1 h. The amount of protein was examined via chemi-luminescence detection system.
CCK‑8 assay
1 × 10³ cells were plated into fresh 96-well plates and
Table 1 The sequences of gene overexpression and interference were presented
shRNA Sequences (5′‑3′)
sh-NC CCG GAC GTG TGC CGA GTC TCT ATG GTC TCG AGT GCA CAC GGC TCA GAG ATA CCA TTT TTG sh-BSN-AS2#1 CCG GCT TCG GTC GAC CCT CCG GTG GAC TCG AGG AAG CCA GCT GGG AGG CCA CCT TTT TTG sh-BSN-AS2#2 CCG GAT GAA GGG GCG AGG GAG TGT AAC TCG AGT ACT TCC CCG CTC CCT CAC ATT TTT TTG sh-BSN-AS2#3 CCG GAC GAC TAT CGG TCG GAC GAC TCT CGA GTG CTG ATA GCC AGC CTG CTG ATT TTT TTG sh-NC CCG GAT ATT GAT CAG TCA TTA GAT GTC TCG AGT ATA ACT AGT CAG TAA TCT ACA TTT TTG sh-E2F1 CCG GGA GAC ACG AGA CGC GGA GTC GAC TCG AGC TCT GTG CTC TGC GCC TCA GCT TTT TTG sh-NC CCG GAC AGA AGA TGT CGG TTG GAT GTC TCG AGT GTC TTC TAC AGC CAA CCT ACA TTT TTG sh-SYTL2 CCG GTC GAT ATT TGA TGT GCT CAC CCC TCG AGA GCT ATA AAC TAC ACG AGT GGG TTT TTG
mimics Sequences (5′‑3′)
NC mimics GCU GCU GAA UCA UUA UCC CCUU miR-654-3p mimics UGG UUU ACC GUC CCA CAU ACAU
Inhibitor Sequences (5′‑3′)
NC inhibitor AAG UCA GGU GAU GGA CAG CAUA miR-654-3p inhibitor AAG GUG AUG GUC AGC AGA CAUA
pcDNA3.1 Sequences (5′‑3′)
pcDNA3.1/E2F1 ATG GCC TTG GCC GGG GCC CCT GCG GGC GGC CCA TGC GCG CCG GCG CTG GAG GCC CTG CTC GGG GCC GGC GCG CTG CGG CTG CTC GAC TCC TCG CAG ATC GTC ATC ATC TCC GCC GCG CAG GAC GCC AGC GCC CCG CCG GCT CCC ACC GGC CCC GCG GCG CCC GCC GCC GGC CCC TGC GAC CCT GAC CTG CTG CTC TTC GCC ACA CCG CAG GCG CCC CGG CCC ACA CCC AGT GCG CCG CGG CCC GCG CTC GGC CGC CCG CCG GTG AAG CGG AGG CTG GAC CTG GAA ACT GAC CAT CAG TAC CTG GCC GAG AGC AGT GGG CCA GCT CGG GGC AGA GGC CGC CAT CCA GGA AAA GGT GTG AAA TCC CCG GGG GAG AAG TCA CGC TAT GAG ACC TCA CTG AAT CTG ACC ACC AAG CGC TTC CTG GAG CTG CTG AGC CAC TCG GCT GAC GGT GTC GTC GAC CTG AAC TGG GCT GCC GAG GTG CTG AAG GTG CAG AAG CGG CGC ATC TAT GAC ATC ACC AAC GTC CTT GAG GGC ATC CAG CTC ATT GCC AAG AAG TCC AAG AAC CAC ATC CAG TGG CTG GGC AGC CAC ACC ACA GTG GGC GTC GGC GGA CGG CTT GAG GGG TTG ACC CAG GAC CTC CGA CAG CTG CAG GAG AGC GAG CAG CAG CTC CAG CGC CTG GCC TAC GTG ACG TGT CAG GAC CTT CGT AGC ATT GCA GAC CCT GCA GAG CAG ATG GTT ATG GTG ATC AAA GCC CCT CCT GAG ACC CAG CTC CAA GCC GTG GAC TCT TCG GAG AAC TTT CAG ATC TCC CTT AAG AGC AAA CAA GGC CCG ATC GAT GTT TTC CTG TGC CCT GAG GAG ACC GTA GGT GGG ATC AGC CCT GGG AAG ACC CCA TCC CAG GAG GTC ACT TCT GAG GAG GAG AAC AGG GCC ACT GAC TCT GCC ACC ATA GTG TCA CCA CCA CCA TCA TCT CCC CCC TCA TCC CTC ACC ACA GAT CCC AGC CAG TCT CTA CTC AGC CTG GAG CAA GAA CCG CTG TTG TCC CGG ATG GGC AGC CTG CGG GCT CCC GTG GAC GAG GAC CGC CTG TCC CCG CTG GTG GCG GCC GAC TCG CTC CTG GAG CAT GTG CGG GAG GAC TTC TCC GGC CTC CTC CCT GAG GAG TTC ATC AGC CTT TCC CCA CCC CAC GAG GCC CTC GAC TAC CAC TTC GGC CTC GAG GAG GGC GAG GGC ATC AGA GAC CTC TTC GAC TGT GAC TTT GGG GAC CTC ACC CCC CTG GAT T TCTGA pcDNA3.1/SYTL2 ATG AGA AAG TCT GTT CCA GCA TTT CTC CAA GAT GAG AGT GAT GAC AGA GAA ACA GAT ACA
Colony formation assay
Transfected cells (1 × 10³) were cultured in 6-well plates
and incubated for 2 weeks. After rinsing by PBS (Solar-bio, Beijing, China), formaldehyde or crystal violet (Sigma-Aldrich) was applied for fixation or coloration, severally. Visible colonies were counted via a microscope (Olympus).
Apoptosis assay
Briefly, cells were incubated in 6-well plates for 48 h and then being cleaned by PBS. After that, cells were fixed with 70% ice‐cold ethanol (Sigma-Alidrich) for 2 h and then double-stained with propidium iodide and Annexin V‐fluorescein isothiocyanate. Apoptosis rate was exam-ined by flow cytometer (BD Biosciences, Beijing, China).
Luciferase reporter assay
The pGL3-BSN-AS2 promoter (Promega, MA, USA) was transfected with pcDNA3.1/E2F1 and pcDNA3.1 vec-tor or sh-E2F1 and sh-NC into U2OS or Saos-2 cells. The wild-type (WT) and mutant (Mut) binding sites of BSN-AS2 sequence or SYTL2 3′UTR was sub-cloned into pmirGLO luciferase vector (Promega) to construct
BSN-AS2-Wt/Mut or SYTL2-Wt/Mut, then co-trans-fected severally with miR-654-3p mimics or NC mimics into U2OS and Saos-2 cells. The luciferase activity was detected using Dual-Luciferase Reporter Assay System (Promega).
TUNEL assay
TUNEL assay was conducted for measuring the frag-mented DNA of apoptotic cells. 1 × 10⁵ U2OS and Saos-2
cells were plated in 24-well plates, and were fixed in paraformaldehyde. The nuclei were stained by the use of DAPI for 10 min. Finally, the numbers of TUNEL positive cells were photographed via a fluorescence microscope (Olympus).
Transwell assay
The capacities of cell migration and invasion were measured on Transwell chambers (8 μm pore size, BD Biosciences). Transwell chamber was pre-coated with Matrigel (BD Biosciences) was employed for invasion assay and without Matrigel for migration assay. Cells (5 × 10⁴) in serum-free medium were placed onto the top
compartment, while the bottom compartment containing 10% FBS was regarded as growth medium. After incuba-tion, cells were fixed by using paraformaldehyde and then dyed with crystal violet. The number of migratory and invasive cells was counted by a microscope (Olympus).
Subcellular fractionation
Nuclear/cytoplasmic fractionation PARIS Kit (Life Tech-nologies, Carlsbad, CA) was used for collecting fractions of nuclear and cytoplasmic. qRT-PCR was performed to determine the relative expression of BSN-AS2, and U2 or GAPDH was nuclear control or cytoplasmic control.
RNA pull down assay
The miR-654-3p-WT, miR-654-3p-Mut and NC were biotin labeled into 3p-WT, Bio-miR-654-3p-Mut and Bio-NC, respectively. Streptavidin-coated magnetic beads were applied for incubation of U2OS and Saos-2 cells. Pull-down assay was carried out in bio-tin-coupled RNA complex. The abundance of BSN-AS2 or SYTL2 in bound fractions was calculated in accord-ance with the results of qRT-PCR. In addition, cell pro-tein lysates were mixed with the magnetic beads and biotin-labeled probes for BSN-AS2, finally analyzed by qRT-PCR.
RIP assay
Supplier’s protocol of the EZMagna RIP Kit (Millipore) was strictly obeyed. Cells were lysed with RIP lysis buffer. Cell extracts were co-cultured with anti-Ago2 or anti-IgG conjugated with magnetic beads for 48 h. After Table 2 The sequences of gene primer were presented
Genes Primer sequences (5′‑3′)
BSN-AS2 F: GCA GGC GTC ATA AGG ACA GG R: TGC GTC TCT GAA TAC ACT TGTTC miR-654-3p F: CCG AGT ATG TCT GCT GAC CAT
R: CTC AAC TGG TGT CGT GGA miR-515-5p F: GCC GAT TCT CCA AAA GAA AGCAC
R: CTC AAC TGG TGT CGT GGA miR-219a-5p F: CCG AGT GAT TGT CCA AAC G
R: CTC AAC TGG TGT CGT GGA miR-4782-3p F: GCC GAG TGA TTG TCT TCA TATC
R: CTC AAC TGG TGT CGT GGA miR-6766-3p F: CCG AGG ATT GTC TTC CCC CA
R: CTC AAC TGG TGT CGT GGA miR-2355-3p F: GCC GAG ATT GTC CTT GCT GTT
R: CTC AAC TGG TGT CGT GGA E2F1 F: ACG CTA TGA GAC CTC ACT GAA
R: TCC TGG GTC AAC CCC TCA AG SYTL2 F: GCC CAG TGT AAG GAC TTA GCA
R: GCC TTT GTC TGG TAG CAA ATAGG CLN8 F: TGG TCG CTG GCT TTG TCT TC
R: AGA ACG GTA AGT GGC ATT CAG GAPDH F: GGA GCG AGA TCC CTC CAA AAT R: GGC TGT TGT CAT ACT TCT CATGG U6 F: CTC GCT TCG GCA GCACA
purification, the relative expression levels of BSN-AS2, miR-654-3p and SYTL2 were evaluated by qRT-PCR analysis.
Animal studies
Subcutaneous xenograft assay was undertaken using 6-week-old male BALB/C nude mice (Beijing Vital River Laboratory Animal Technology, Beijing, China), under the approval from the Animal Research Ethics Commit-tee of Luoyang Orthopedic Hospital of Henan Province. 1 × 10⁶ U2OS cells transfected with sh-NC,
sh-BSN-AS2#1 or sh-BSN-sh-BSN-AS2#1 + SYTL2 were collected and injected subcutaneously into nude mice for 28 days. The volume of tumors was monitored every 4 days and calcu-lated as 1/2 length × width2. After killing mice, the
xeno-graft tumors were excised carefully for weigh assessment.
Statistical analysis
Statistical analysis was completed by GraphPad Prism 7.0 software (La Jolla, CA, USA). Numerical data were manifested as mean ± SD. Differences among groups
were compared via Student’s t test and one-way ANOVA. P < 0.05 had statistical significance. All experiments were done thrice independently at least.
Results
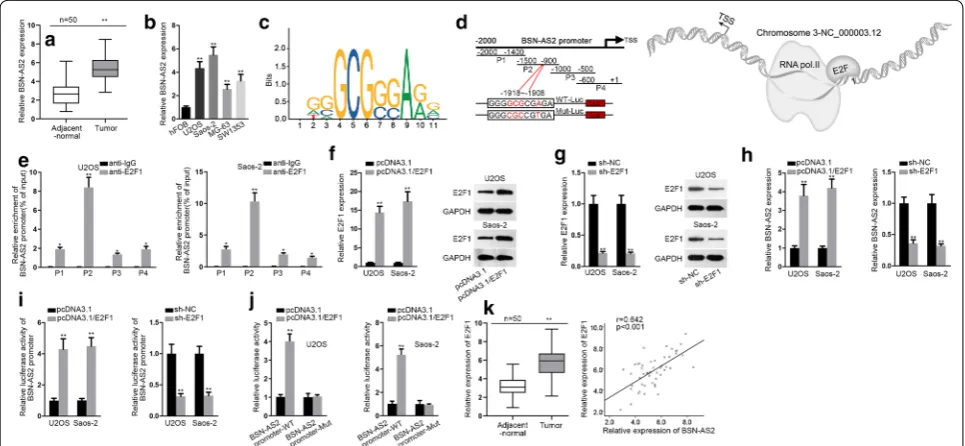
Based on the results of qRT-PCR, BSN-AS2 was sig-nificantly upregulated in spinal OS tissues in com-parison with adjacent-normal tissues (Fig. 1a). Also, BSN-AS2 expression was evidently upregulated in spi-nal OS cells compared with hFOB cells (Fig. 1b). These findings implied that BSN-AS2 was implicated with the development of spinal OS. Furthermore, the mecha-nism associated with the upregulation of BSN-AS2 was investigated in U2OS and Saos-2 cells, which presented higher expression of BSN-AS2. According to UCSC (http://genom e.ucsc.edu/), the potential transcrip-tion factors of BSN-AS2 were identified. Among them, E2F1 was previously confirmed to be a transcription factor in cancers [23, 24]. Then by use of JASPAR data-base (http://jaspa r.gener eg.net/), the binding motif of E2F1 and BSN-AS2 promoter were found (Fig. 1c, left). And part 2 (P2) was predicted as the specific binding area of E2F1 on BSN-AS2 promoter (Fig. 1c, right). The schematic diagram about that E2F1 promoted the tran-scription of BSN-AS2 was shown in Fig. 1d. ChIP assay illustrated the strong affinity of E2F1 to P2 of BSN-AS2 promoter (Fig. 1e). Then E2F1 was effectively overex-pressed and knocked down in U2OS and Saos-2 cells (Fig. 1f, g). Moreover, BSN-AS2 was positively regulated
by E2F1. E2F1 upregulation or downregulation increased or decreased the expression of BSN-AS2 (Fig. 1h). Lucif-erase reporter assays demonstrated that overexpression of E2F1 increased the luciferase activity of BSN-AS2 promoter while ablation of E2F1 decreased that of BSN-AS2 promoter (Fig. 1i), indicating E2F1 transcriptionally upregulated BSN-AS2 in spinal OS. In addition, lucif-erase reporter assays further confirmed that the bind-ing facts between BSN-AS2 promoter and E2F1 in P2 (− 1918 ~ − 1908) (Fig. 1J). Furthermore, E2F1 possessed higher level in spinal OS tissues than adjacent-normal tis-sues, and E2F1 was positively correlated with BSN-AS2 with regards the expression in tissues (Fig. 1k). To sum up, BSN-AS2 induced by E2F1 was upregulated in spinal OS tissues and cells.
In order to explore the role of BSN-AS2 in spinal OS, a string of loss-of-function assays were undertaken in U2OS and Saos-2 cells. To begin with, BSN-AS2 was silenced in U2OS and Saos-2 cells by transfection with sh-BSN-AS2#1, sh-BSN-AS2#2 and sh-BSN-AS2#3 vec-tors (Fig. 2a). qRT-PCR disclosed that sh-BSN-AS2#1 and sh-BSN-AS2#2 could be selected for further study as they presented more satisfactory knockdown effi-ciency. CCK-8 and colony formation assays showed that BSN-AS2 descent markedly reduced the proliferation of U2OS and Saos-2 cells (Fig. 2b, c). Flow cytometry analy-sis and TUNEL assay demonstrated that knockdown of BSN-AS2 had positive effects on cell apoptosis in U2OS and Saos-2 cells (Fig. 2d, e). Next, transwell assays were implemented and disclosed cell migration and invasion were consistently suppressed due to BSN-AS2 deficiency (Fig. 2f, g). Besides, the role of AKT/ERK in cancers including OS has been extensively illustrated [25, 26]. In this research, when downregulating BSN-AS2, west-ern blot assay measured that the expression of AKT- and ERK- related proteins presented no changes (Additional file 1: Fig. S1A). In summary, depletion of BSN-AS2 inhibited spinal OS progression.
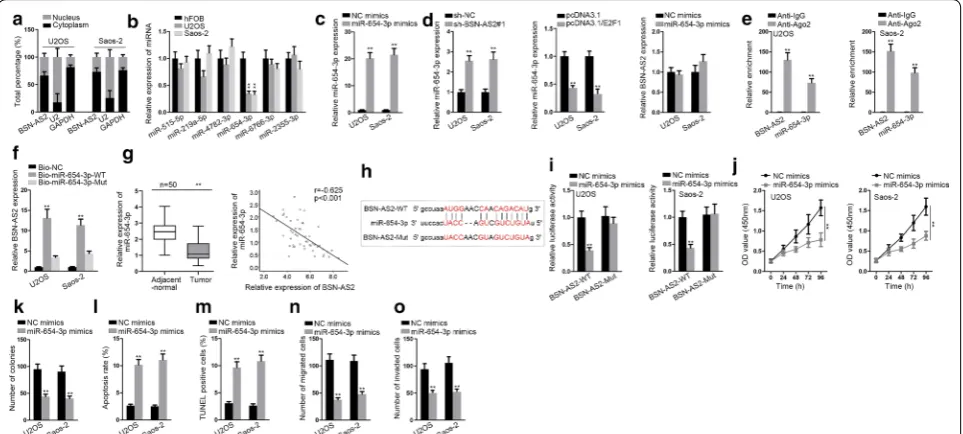
Thereafter, the downstream regulatory mechanism of BSN-AS2 was probed. Nuclear-cytoplasmic fractiona-tion assay disclosed BSN-AS2 expression was enriched in cytoplasm (Fig. 3a), suggesting that BSN-AS2 might function as a ceRNA to regulate gene expression at post-transcriptional level. Based on starBase database (http:// starb ase.sysu.edu.cn/), 10 miRNAs were screened out for that they possessed binding sites for BSN-AS2, and RNA pull down assay examined that 6 miRNAs were enriched in biotin BSN-AS2 probe group (Additional file 1: Fig. S1B). Afterwards, qRT-PCR measured the expression of 6 pre-qualified miRNAs in spinal OS cells (U2OS and Saos-2) and control cells. Among them miR-654-3p was dramatically downregulated in U2OS and Saos-2 cells
(Fig. 3b). Furthermore, we overexpressed miR-654-3p by transfecting miR-654-3p mimics vector, disclosing a strikingly enhancement of miR-654-3p in U2OS and Saos-2 cells (Fig. 3c). qRT-PCR demonstrated that BSN-AS2 silence increased the expression of miR-654-3p and E2F1 overexpression decreased that of miR-654-3p, but miR-654-3p overexpression had no significant effect on BSN-AS2 expression (Fig. 3d), indicating that BSN-AS2 might regulate miR-654-3p in spinal OS. RIP assay showed BNS-AS2 and miR-654-3p were accumulated in anti-Ago2 group rather than anti-IgG group (Fig. 3e). RNA pull down assay revealed BSN-AS2 could be pulled down by bio-miR-654-WT rather than bio-miR-654-Mut and bio-NC (Fig. 3f). Similarly, qRT-PCR detected that miR-654-3p was obviously downregulated in spinal OS tissues, and miR-654-3p was negatively correlated with BNS-AS2 (Fig. 3g). Next, we obtained the putative bind-ing sites between BSN-AS2 and miR-654-3p (Fig. 3h). Luciferase reporter assay uncovered that miR-654-3p upregulation efficiently decreased the luciferase activity of BSN-AS2-WT but not that of BSN-AS2-Mut (Fig. 3i). Thus, the interaction of BSN-AS2 and miR-654-3p in spinal OS was confirmed. After that, the function of miR-654-3p in spinal OS was determined. According to CCK-8 and colony formation assays, cell prolifera-tion was impeded owing to miR-654-3p overexpression (Fig. 3j, k). Reversely, cell apoptosis was promoted by miR-654-3p upregulation (Fig. 3l, m). Cell migration and invasion were alleviated as a result of the transfection of miR-654-3p mimics (Fig. 3n, o). Moreover, AKT and ERK pathways were not affected by miR-654-3p upregulation (Additional file 1: Fig. S1C). All in all, BSN-AS2 sponged with miR-654-3p, which exerted suppressive functions on spinal OS progression.
Further, the downstream mRNAs of miR-654-3p in spinal OS were investigated. SYTL2 and CLN8 were potentially targeted by miR-654-3p based on starBase (Fig. 5a). Then the expression of SYTL2 and CLN8 in spi-nal OS cells and hFOB cells was detected by qRT-PCR. The results showed SYTL2 expression was predomi-nantly increased in spinal OS cells (Fig. 5b). Hence, we speculated miR-654-3p might target SYTL2 to regulate spinal OS progression. Moreover, the mRNA and pro-tein expressions of STYL2 were attenuated in response to miR-654-3p overexpression or BSN-AS2 suppression, but upregulated in response to E2F1 overexpression (Fig. 5c, d). RIP assay manifested BSN-AS2, miR-654-3p and SYTL2 were enriched in Ago2-containing beads (Fig. 5e). Besides, SYTL2 was enriched in bio-miR-654-3p-WT group instead of bio-miR-654-3p-Mut and bio-NC groups (Fig. 5f). In a similar way, qRT-PCR measured that SYTL2 was remarkably upregulated in spinal OS tis-sues compared with control group. Besides, SYTL2 was negatively correlated with miR-654-3p, but positively correlated with BSN-AS2 (Fig. 5g). Then the potential binding site for miR-654-3p and SYTL2 was exhibited in Fig. 5h. Furthermore, the luciferase activity of the SYTL2-WT but not that of SYTL2-Mut was decreased by
upregulation of miR-654-3p (Fig. 5i), validating that miR-654-3p could target SYTL2 in spinal OS. Then favorable knockdown efficiency of SYTL2 was gained in U2OS and Saos-2 cells (Fig. 5j). And by application of CCK-8 and colony formation assays, cell proliferation was depressed by inhibition of SYTL2 (Fig. 4k, l). Cell apoptosis was induced by SYTL2 silence (Fig. 4m, n). Cell migration and invasion were hampered by SYTL2 attenuation (Fig. 4o, p). Furthermore, AKT and ERK pathways were not influenced by SYTL2 knockdown (Additional file 1: Fig. S1E). To sum up, SYTL2 acted as the downstream target gene of miR-654-3p and could facilitate spinal OS development.
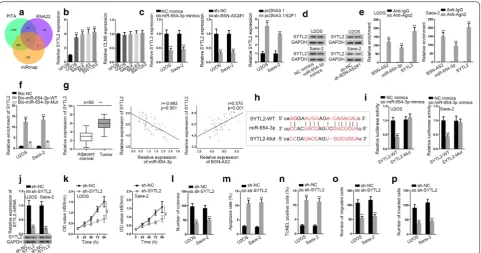
Finally, rescue experiments were performed in U2OS cells and SYTL2 was overexpressed for the experiments using pcDNA3.1/SYTL2 vector. Obviously, SYTL2 expression was strongly increased in U2OS cells (Fig. 6a). SYTL2 upregulation could reverse the inhibitory effect on cell proliferation caused by BSN-AS2 silence (Fig. 6b, c). Elevated cell apoptosis by BSN-AS2 downregula-tion was obstructed by SYTL2 overexpression (Fig. 6d, e). Oppositely, cell migration and invasion inhibited by BSN-AS2 depression were respectively rescued by SYTL2 upregulation (Fig. 6f, g). Meanwhile, the regulation of Fig. 3 BSN-AS2 could bind with miR-654-3p in spinal OS. a Nuclear-cytoplasmic fractionation assay disclosed BSN-AS2 expression was enriched in cytoplasm. b qRT-PCR unveiled the expression of 6 miRNAs in hFOB, U2OS and Saos-2 cells. c qRT-PCR manifested the expression of miR-654-3p in miR-654-3p mimics transfected cells. d qRT-PCR testified the expression of miR-654-3p when downregulating BSN-AS2 or upregulating E2F1 as well as the expression of BSN-AS2 when overexpressing miR-654-3p. e RIP assay showed the enrichment of BNS-AS2 and miR-654-3p in anti-Ago2 or anti-IgG group. f RNA pull down assay revealed BSN-AS2 could bind with miR-654-3p. g The expression of miR-654-3p in spinal OS tissues and adjacent-normal tissues was measured by qRT-PCR (left); Pearson correlation analysis illustrated the correlation between miR-654-3p and BSN-AS2 (right). h The putative binding sites between BSN-AS2 and miR-654-3p. i Luciferase reporter assay uncovered BSN-AS2 could bind with miR-654-3p.
BSN-AS2 and YTL2 expressions didn’t affected the AKT and ERK pathways (Additional file 1: Fig. S1F). Addition-ally, in vivo studies were carried out to further validate above findings. As a result, tumors had a slower growth rate in BSN-AS2-slineced groups, resulting in smaller volume and lighter weight when being excised from mice (Fig. 6h, i). On the whole, SYTL2 was involved in the BSN-AS2-mediated spinal OS progression.
Discussion
Spinal osteosarcoma (OS) is an aggressive malignancy with a poor outcome. Hence, it is imperative to identify novel therapeutic targets for spinal OS. LncRNAs locat-ing in cytoplasm could function as competlocat-ing endog-enous RNAs (ceRNAs) to sponge microRNAs (miRNAs) and regulate gene expression, thus influencing cancer progression. For example, STAT3-induced lncRNA HOXD-AS1 facilitates liver cancer metastasis by com-petitively sponging miR-130a-3p and regulating SOX4 [27]. LncRNA NEAT1 sponges miR-129 to regulate the progression of esophageal squamous cell carcinoma via
increasing CTBP2 expression [28]. LncRNA SNHG5 serves as a sponge of miR-32 to promote proliferation and migration of gastric cancer cells via targeting KLF4 [29]. Nonetheless, whether BSN-AS2 acted as a ceRNA in spinal OS remained to be explored. In present study, BSN-AS2 expression was confirmed to be elevated in spinal OS tissues and cell lines relative to control groups. Then we found that transcription factor E2F1 could bind with BSN-AS2 promoter to enhance the transcription of it. In addition, BSN-AS2 deficiency obviously suppressed cell proliferation, migration and invasion as well as evi-dently enhanced cell apoptosis in spinal OS. Moreover, E2F1 was positively correlated with BSN-AS2. Taken together, BSN-AS2 transcriptionally activated by E2F1 facilitated the progression of spinal OS.
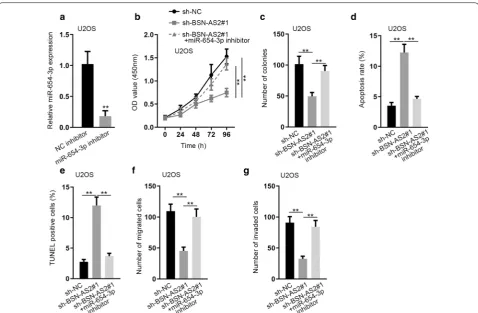
To date, mounting miRNAs have been confirmed as key factors in the development of cancer. Abnormally expressed miRNAs have been shown to be implicated in the carcinogenesis of several cancers. For example, miR-92a-3p is sponged by MT1JP to regulate the pro-gression of gastric cancer [30]. MiR-146b-5p aggravates Fig. 4 BSN-AS2 promoted spinal OS progression via inhibiting miR-654-3p expression. a qRT-PCR measured miR-654-3p expression in miR-654-3p inhibitor transfected cells. b, c CCK-8 and colony formation assays measured cell proliferation in transfected groups. d, e Flow cytometry analysis and TUNEL assay detected cell apoptosis in transfected groups. f, g Transwell assays assessed cell migration and invasion in transfected groups.
Fig. 5 MiR-654-3p targeted SYTL2 to regulate spinal OS progression. a StarBase showed SYTL2 and CLN8 were potentially targeted by miR-654-3p.
b qRT-PCR indicated the expression of SYTL2 and CLN8 in spinal OS cells and hFOB cells. c, d qRT-PCR and western blot assays uncovered the mRNA and protein expressions of STYL2. e RIP assay manifested the enrichment of BSN-AS2, miR-654-3p and SYTL2 in anti-Ago2 group. f RNA pull down showed miR-654-3p could bind with SYTL2. g The expression of SYTL2 in spinal OS tissues and adjacent-normal tissues was measured by qRT-PCR (left); Pearson correlation analysis illustrated the correlation between SYTL2 and miR-654-3p/BSN-AS2 (middle and right). h The potential binding site for miR-654-3p and SYTL2 was exhibited. i Luciferase reporter assay illustrated miR-654-3p could target SYTL2 in spinal OS. j qRT-PCR and western blot assays detected the mRNA and protein expressions of SYTL2. k, l CCK-8 and colony formation assays showed cell proliferation when inhibiting SYTL2. m, n Flow cytometry analysis and TUNEL assay determined cell apoptosis in SYTL2 silenced cells. o, p Transwell assay demonstrated cell migration and invasion in response to SYTL2 attenuation. **P < 0.01
papillary thyroid carcinoma cell migration and invasion and has a positive correlation with the degree of malig-nancy [31]. MiR-188-5p inhibits cell proliferation and metastasis via targeting FGF5 in hepatocellular carci-noma [32]. In current study, miR-654-3p was potentially sponged by BSN-AS2. It has reported that inhibition of miR-654-3p accelerates the progression of papillary thy-roid cancer [33]. However, the interaction between BSN-AS2 and miR-654-3p in spinal OS needed to be further investigated. In our study, BSN-AS2 and E2F1 negatively regulated miR-654-3p in spinal OS cells. As expected, miR-654-3p had negative correlation with BSN-AS2 about the expression in in spinal OS tissues. Meanwhile, miR-654-3p overexpression blocked the development of spinal OS progression. In summary, miR-654-3p was sequestered by BSN-AS2 and could suppress spinal OS progression.
Synaptotagmin-like protein 2 (SYTL2) was previously identified to increase the metastatic potential of ovar-ian cancer [34]. In this study, bioinformatics analysis indicated SYTL2 served as a downstream target of miR-654-3p. Upregulation of miR-654-3p or shortage of BSN-AS2 could decrease the expression of SYTL2. Of note, E2F1 overexpression could stimulate SYTL2 expression. There existed negative/positive correlation between SYTL2 and miR-654-3p/BSN-AS2. Besides, SYTL2 knock down inhibited the progression of spinal OS. At last, rescue assays illustrated that enforced expression of SYTL2 largely abolished the BSN-AS2 deficiency-induced inhibitory influences on the development of spinal OS.Our work elucidated a ceRNA network con-structed by BSN-AS2/miR-654-3p/SYTL2 in spinal OS.
Conclusion
E2F1-activated BSN-AS2 contributed to spinal OS pro-gression by targeting miR-654-3p/SYTL2 axis, revealing a new perspective into understanding spinal OS.
Supplementary information
Supplementary information accompanies this paper at https ://doi.
org/10.1186/s1293 5-020-01205 -y.
Additional file 1: Fig. S1. (A) Western blot assays measured the
expres-sion of AKT/ERK pathway-related proteins when silencing BSN-AS2. (B) RNA pull down assays tested the enrichment of the indicated miRNAs in biotin BSN-AS2 probe group. (C–F) Western blot assays measured the expression of AKT/ERK pathway-related proteins under different transfec-tion conditransfec-tions. *P < 0.05, **P < 0.01. n.s. represented no significance.
Abbreviations
OS: Osteosarcoma; lncRNAs: Long non-coding RNAs; qRT‐PCR: Quantitative Real-Time PCR; ceRNAs: Competing endogenous RNAs; miRNAs: MicroRNAs; SYTL2: Synaptotagmin-like protein 2.
Acknowledgements
We appreciate all people involved in this study.
Authors’ contributions
XZ conceived of the study, analyzed the data, and drafted the manuscript; JL, JT and YL helped revise the manuscript critically for important intellectual content; DZ, LL and WZ helped collect data and design the study. All authors read and approved the final manuscript.
Funding
Development and research of personalized printed 3D intervertebral fusion device in CLIF surgery of spine, department level (2019ZY1031), Key project of Henan TCM science research, Clinical application of personalized 3D printing in accurate external fixation of distal radius fracture (1723001A-4), Luoyang science and technology development project.
Availability of data and materials Research data and material are not shared.
Ethics approval and consent to participate
All the experiments approval from the Ethical Committee of Luoyang Ortho-pedic Hospital of Henan Province.
Consent for publication All authors agree to publish.
Competing interests
The authors declare that there are no competing interests in this study.
Author details
1 Spine Surgery, Luoyang Orthopedic Hospital of Henan Province, No. 100 Yongping Road, Zhengzhou 450000, Henan, China. 2 Laboratory of Bone Tumor, Luoyang Orthopedic Hospital of Henan Province, Zhengzhou 450000, Henan, China. 3 Department of Osteoarthrosis & Health Management Center, Luoyang Orthopedic Hospital of Henan Province, Zhengzhou 450000, Henan, China.
Received: 26 December 2019 Accepted: 3 April 2020
References
1. Shives TC, Dahlin DC, Sim FH, Pritchard DJ, Earle JD. Osteosarcoma of the spine. J Bone Joint Surg Am. 1986;68(5):660–8.
2. Tigani D, Pignatti G, Picci P, Savini R, Campanacci M. Vertebral osteosar-coma. Ital J Orthop Traumatol. 1988;14(1):5–13.
3. Campanacci M, Cervellati G. Osteosarcoma: a review of 345 cases. Ital J Orthop Traumatol. 1975;1(1):5–22.
4. Ottaviani G, Jaffe N. The epidemiology of osteosarcoma. Cancer Treat Res. 2009;152:3–13.
5. Mathkour M, Garces J, Beard B, Bartholomew A, Sulaiman OA, Ware ML. Primary high-grade osteosarcoma of the clivus: a case report and litera-ture review. World Neurosurg. 2016;89:730.e739-730.e713.
6. Katonis P, Datsis G, Karantanas A, Kampouroglou A, Lianoudakis S, Licoudis S, Papoutsopoulou E, Alpantaki K. Spinal osteosarcoma. Clin Med Insights Oncol. 2013;7:199–208.
7. DeLaney TF, Park L, Goldberg SI, Hug EB, Liebsch NJ, Munzenrider JE, Suit HD. Radiotherapy for local control of osteosarcoma. Int J Radiat Oncol Biol Phys. 2005;61(2):492–8.
8. Ozaki T, Flege S, Liljenqvist U, Hillmann A, Delling G, Salzer-Kuntschik M, Jurgens H, Kotz R, Winkelmann W, Bielack SS. Osteosarcoma of the spine: experience of the Cooperative Osteosarcoma Study Group. Cancer. 2002;94(4):1069–77.
9. Kawai A, Huvos AG, Meyers PA, Healey JH. Osteosarcoma of the pelvis. Oncologic results of 40 patients. Clin Orthopaedics Relat Res. 1998;348:196–207.
10. Duffaud F, Digue L, Baciuchka-Palmaro M, Volot F, Perles-Daniel C, Garbe L, Favre R. Osteosarcomas of flat bones in adolescents and adults. Cancer. 2000;88(2):324–32.
•fast, convenient online submission
•
thorough peer review by experienced researchers in your field
• rapid publication on acceptance
• support for research data, including large and complex data types
•
gold Open Access which fosters wider collaboration and increased citations maximum visibility for your research: over 100M website views per year
•
At BMC, research is always in progress.
Learn more biomedcentral.com/submissions
Ready to submit your research? Choose BMC and benefit from: 12. Ren S, Wang F, Shen J, Sun Y, Xu W, Lu J, Wei M, Xu C, Wu C, Zhang Z, et al.
Long non-coding RNA metastasis associated in lung adenocarcinoma transcript 1 derived miniRNA as a novel plasma-based biomarker for diagnosing prostate cancer. Eur J Cancer. 2013;49(13):2949–59. 13. Zheng HT, Shi DB, Wang YW, Li XX, Xu Y, Tripathi P, Gu WL, Cai GX, Cai SJ.
High expression of lncRNA MALAT1 suggests a biomarker of poor prog-nosis in colorectal cancer. Int J Clin Exp Pathol. 2014;7(6):3174–81. 14. Xiong G, Yang L, Chen Y, Fan Z. Linc-POU3F3 promotes cell
prolifera-tion in gastric cancer via increasing T-reg distribuprolifera-tion. Am J Transl Res. 2015;7(11):2262–9.
15. Lei H, Gao Y, Xu X. LncRNA TUG1 influences papillary thyroid cancer cell proliferation, migration and EMT formation through targeting miR-145. Acta Biochim Biophys Sin. 2017;49(7):588–97.
16. Ma Y, Yang Y, Wang F, Moyer MP, Wei Q, Zhang P, Yang Z, Liu W, Zhang H, Chen N, et al. Long non-coding RNA CCAL regulates colorectal cancer progression by activating Wnt/beta-catenin signalling pathway via sup-pression of activator protein 2alpha. Gut. 2016;65(9):1494–504. 17. Zang W, Wang T, Huang J, Li M, Wang Y, Du Y, Chen X, Zhao G. Long
non-coding RNA PEG10 regulates proliferation and invasion of esophageal cancer cells. Cancer Gene Ther. 2015;22(3):138–44.
18. Gong J, Zhang H, He L, Wang L, Wang J. Increased expression of long non-coding RNA BCAR4 is predictive of poor prognosis in patients with non-small cell lung cancer. Tohoku J Exp Med. 2017;241(1):29–34. 19. Liang YC, Wu YP, Chen DN, Chen SH, Li XD, Sun XL, Wei Y, Ning X, Xue
XY. Building a competing endogenous RNA network to find potential long non-coding RNA biomarkers for pheochromocytoma. Cell Physiol Biochem. 2018;51(6):2916–24.
20. Xu TP, Wang YF, Xiong WL, Ma P, Wang WY, Chen WM, Huang MD, Xia R, Wang R, Zhang EB, et al. E2F1 induces TINCR transcriptional activity and accelerates gastric cancer progression via activation of TINCR/STAU1/ CDKN2B signaling axis. Cell Death Dis. 2017;8(6):e2837.
21. Wang T, Chen X, Qiao W, Kong L, Sun D, Li Z. Transcription factor E2F1 promotes EMT by regulating ZEB2 in small cell lung cancer. BMC Cancer. 2017;17(1):719.
22. Farra R, Grassi G, Tonon F, Abrami M, Grassi M, Pozzato G, Fiotti N, Forte G, Dapas B. The role of the transcription factor E2F1 in hepatocellular carcinoma. Curr Drug Deliv. 2017;14(2):272–81.
23. Liu BW, Wang TJ, Li LL, Zhang L, Liu YX, Feng JY, Wu Y, Xu FF, Zhang QS, Bao MZ, et al. Oncoprotein HBXIP induces PKM2 via transcription factor E2F1 to promote cell proliferation in ER-positive breast cancer. Acta Pharmacol Sin. 2019;40(4):530–8.
24. Jin H, Xie Q, Guo X, Xu J, Wang A, Li J, Zhu J, Wu XR, Huang H, Huang C. p63alpha protein up-regulates heat shock protein 70 expression via E2F1
transcription factor 1, promoting Wasf3/Wave3/MMP9 signaling and bladder cancer invasion. J Biol Chem. 2017;292(38):15952–63. 25. Liu Y, He J, Chen X, Li J, Shen M, Yu W, Yang Y, Xiao Z. The
proapop-totic effect of formononetin in human osteosarcoma cells: involve-ment of inactivation of ERK and Akt pathways. Cell Physiol Biochem. 2014;34(3):637–45.
26. Lv DB, Zhang JY, Gao K, Yu ZH, Sheng WC, Yang G, Gao YZ. MicroRNA-765 targets MTUS1 to promote the progression of osteosarcoma via mediat-ing ERK/EMT pathway. Eur Rev Med Pharmacol Sci. 2019;23(11):4618–28. 27. Wang H, Huo X, Yang XR, He J, Cheng L, Wang N, Deng X, Jin H, Wang N, Wang C, et al. STAT3-mediated upregulation of lncRNA HOXD-AS1 as a ceRNA facilitates liver cancer metastasis by regulating SOX4. Mol Cancer. 2017;16(1):136.
28. Li Y, Chen D, Gao X, Li X, Shi G. LncRNA NEAT1 regulates cell viability and invasion in esophageal squamous cell carcinoma through the miR-129/ CTBP2 Axis. Dis Markers. 2017;2017:5314649.
29. Zhao L, Han T, Li Y, Sun J, Zhang S, Liu Y, Shan B, Zheng D, Shi J. The lncRNA SNHG5/miR-32 axis regulates gastric cancer cell proliferation and migration by targeting KLF4. FASEB J. 2017;31(3):893–903.
30. Zhang G, Li S, Lu J, Ge Y, Wang Q, Ma G, Zhao Q, Wu D, Gong W, Du M, et al. LncRNA MT1JP functions as a ceRNA in regulating FBXW7 through competitively binding to miR-92a-3p in gastric cancer. Mol Cancer. 2018;17(1):87.
31. Lima CR, Geraldo MV, Fuziwara CS, Kimura ET, Santos MF. MiRNA-146b-5p upregulates migration and invasion of different papillary thyroid carci-noma cells. BMC Cancer. 2016;16:108.
32. Fang F, Chang RM, Yu L, Lei X, Xiao S, Yang H, Yang LY. MicroRNA-188-5p suppresses tumor cell proliferation and metastasis by directly targeting FGF5 in hepatocellular carcinoma. J Hepatol. 2015;63(4):874–85. 33. Geraldo MV, Nakaya HI, Kimura ET. Down-regulation of 14q32-encoded
miRNAs and tumor suppressor role for miR-654-3p in papillary thyroid cancer. Oncotarget. 2017;8(6):9597–607.
34. Sung HY, Han J, Ju W, Ahn JH. Synaptotagmin-like protein 2 gene promotes the metastatic potential in ovarian cancer. Oncol Rep. 2016;36(1):535–41.
Publisher’s Note