A method of determining cut position of automatic stem removal
system for salted wakame
Adiljan Yimit
1*, Motoki Takagi
1, Yukari Hagihara
2, Tasuku Miyoshi
2,
Yoshihiro Hagihara
2( 1. Orginazation of Revitalization Sanriku-Region, Iwate University, Morioka, Japan; 2. Faculty of Engineering, Iwate University, Morioka, Japan.)
Abstract:In the wakame production procedure, the manual operation process of stem removal is known as a hindrance to the wakame production. In order to solve this problem, we aspire to develop an automatic wakame stem removal system. The purpose of this paper is to propose a cut position determination method for the system by picking up the characteristic changes that appear at the cross section of the wakame. In this method, with the utilization of exposure control, two images are captured from the same cross section that is made by a developed device. These images are used in the segmentation of the cross section. The positions where the stem should be cut can then be determined through the examination of the thickness of the cross section. To verify the feasibility of the proposed method in developing an automatic removal system, 100 cross sections were generated from the roots of 10 samples of the salt-preserved wakame with an interval of 20 mm. In the experiments, the success rate was 76% with the width selection of 1.5mm allowable part of the stem left on the leaves, and it increased with the extension of the allowable part.
Keywords:Marine algae, wakame, automation, stem removal, exposure control and segmentation.
Citation: A., M. Takagi, Y. Hagihara, T. Miyoshi, and Y. Hagihara. 2015. A method of determining cut position of automatic stem removal system for salted wakame. AgricEngInt: CIGR Journal, 17(1):188-196.
1 Introduction
1Marine algae (seaweeds) are prolific around the coasts
of Japan, and have long been used as food as well as
industrial products, and have been played an important
role in the maintenance of health as a source of supply of
vitamins and minerals. Consequently, the consumption
and production of seaweed in Japan are highest in the
world (Murata et al., 2001). Common edible seaweed in
Japan include Nori (Porphyra), Wakame
(Undariapinnatifida), Kombu (Saccharina japonica) and
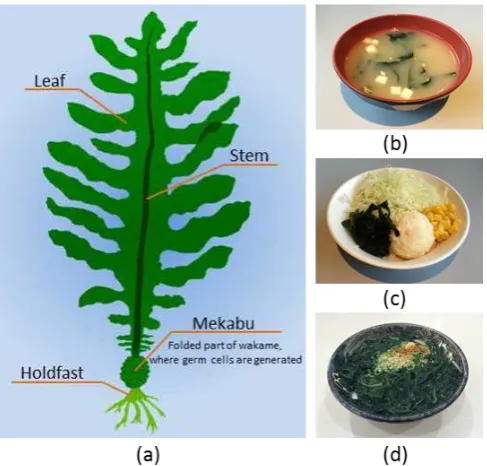
Hiziki (Sargassumfusiforme), etc. Among them, wakame,
as illustrated in Figure 1, is one of the most popular
Received date: 2014-04-20 Accepted date: 2014-12-12 *Corresponding author:AdiljanYimit, Orginazation of Revitalization Sanriku-Region, Iwate University, Morioka, Japan. Email: [email protected]
edible seaweed and widely used in soup, salad and noodle,
etc. The main part of this seaweed used for cooking is the
sterile leaf of the asexual generation. Before the basic
resources become the finished products, the processing
system of wakame production requires many processing
steps. Currently, almost all of the wakame products are
produced from cultivated wakame seaweed, and the
processing steps of cultivated wakame for marketing
include harvesting, boiling, cooling, salting and stem
removing (Hasegawa et al., 2005). The season for
harvesting cultivated wakame usually starts from the
month of February and goes up to the end of April, and
during this season the fishery workers spend their busiest
time to gather their harvests with excessively heavy loads.
Every time the fisheries finish unloading their harvests on
coasts, boiling, cooling and salting processes are carried
harvested wakame is briefly boiled in sea water, and this
is the process that makes brown wakame change its color
to bright green. After boiling, wakame is refrigerated,
then mixed with salt and preserved overnight in a
highly-saturated salt water solution. The salted blades are
then drained and allowed to dehydrate for several days,
after which the mid-ribs are removed (Yamanaka et al.,
1993).
Figure 1 General structure of wakame (a); and Japanese
cuisine made with wakame:(b) Miso soup, (c) salad, (d)
wakame noodle.
The total amount of the wakame harvested in 2010
was about 50 thousand tons (Ministry of Agriculture,
Forestry and Fisheries of Japan); however, it was only
capable of filling about 20% of the domestic demand. The
other part of domestic use was filled with the importation
from Korea and China. The amount of harvested wakame
has decreased over the years, and it causes an increase in
importation. The problems of the decrease of the wakame
production can be considered from several viewpoints.
But, the main reasons are the following ones: (i) decrease
in the number of employees, which is caused by the
problem of low birth rate and aging population; (ii)
quality improvement and low price of the imported
wakame products as compared to the domestic products.
Up till now, a lot of research has been done to
improve the wakame processing, and some of them have
even been used in the production line (Fujii and Korenaga,
2000; Onodera and Ishimura, 2007). Those research
documents include each process from cultivating to stem
removing. Comparing with the procedure held before, the
productivity of harvesting and salt-preserved processing
has been increased with production scale for household.
However, the productivity of stem separating operation is
still extremely low. Because this process is depended
entirely on manual operation, that is, the stemsare
manually removed one by one, and this is why it becomes
a bottleneck to the improvement of total production. For
this reason, Inoue et al.(2004) developed an automated
production system that can separate the stem and leaves
of wakame by guiding two special blades. In their method,
the wakame is pulled by clutching the root edge of it to a
rotation drum. The leaves are separated from the stem by
the two cutting blades which are set on the both sides of a
stem, while the stem is wound onto the drum. However,
their machine was not widely used in production line due
to the several limitations, e.g., before grasping the root of
wakame to the drum, the stem should be manually
separated with certain distance on the both side of the
stem, so that it consumes a little time before finishing the
removal.
Thus, making an automatic stem separation system is
very important to increase the wakame productivity.
Therefore, we are engaging in developing such a system
that can automatically detect cut positions on both sides
of the stem, and then on the basis of those results separate
the stem from the leaves. At the present stage, we have
developed a prototype cross section generation devicefor
carrying out the detection.After making a cross section
two types of images are grabbed from the same cross
section by controlling exposure. Then these images are
Finally the cut positions are obtained by using the
variation of thickness of the cross section.
In this paper, discussions will be made mainly on the
cut position determination for the stem removal system.
The rest of this paper is organized as follows: in section 2,
we first briefly explain the conceptual functions of stem
removal process and present a prototype device that is
developed for generating the cross section. Then, we
provide a detailed explanation about how the image
capturing process is performed and about how to identify
the cut positions.Following these, in section 3, the
effectiveness and usefulness of the proposed method will
be verified by experiments, and finally conclusion and
future worksare presented in section 4.
2Materials and methods
2.1 Stem removal system and cross section generating
device
By observing the manual stem separation, it can be
found that there are three main steps in the process. The
procedure begins with identification of the best point at
which to separate. Stage two involves cutting slits at the
chosen points, and creating a leaver from the roots of the
wakame which is a place to be grasped by the worker.
Finally the stem is removed from the leaves. The leaver
is pulled to separate the leaves and the stem from the rest
of the wakame using the thumb and the index finger.
Because the stem has a high fiber content it is stronger
than the leaves, which will therefore break away easily
where they are slit at the connecting point. This is the
principle on which the system devised by Inoue et al was
based.
According to the above, taking the functions of these
three steps into consideration, it is very important to
develop an automatic wakame stem removal system, in
other words, these functions can be thought of as the
basic requirements for the system to be developed.
Therefore, the main parts of a typical stem removal
system consist of an image processing system to
determine the cut position with regard to the
determination made by visual observation, a slit generator
to cut both sides of stem on the basis of the determined
cut position, and a stem remover to separate the leaves.
Among them, the determination of the cut position is the
most important part of the system. Generally, when made
by worker the decision of where to cut is based on the
color difference and the tangible difference in the
thickness at the boundaries of stem and leaves, as well as,
on intuition developed through experience. Obviously, it
is imposable to provide a detection method that can find
the right points in the same way as humans do, but from
manual determination process we can find a similar way
to do that, that is, utilizing the color difference being
caused by the reflection on the cross section and the
perceptible thickness variation of the cross section.
Therefore, cross section generation is a process that needs
to be done before the detection. Most importantly,
validating the feasibility of the detection method is an
efficient way to develop a system before the integration.
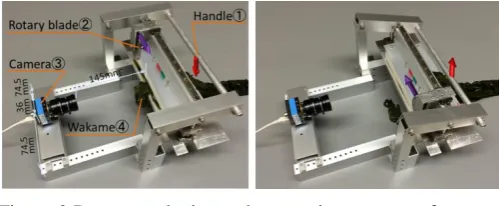
As a first stage of our work, we constructed a prototype
cross section generating device with two degrees of
freedom (DOF) as shown in Figure 2. It has designed
functions to fix the wakame by pressing down the handle
○1, and to make a cross section by cutting the wakame
through sliding the rotary blade ○2. An example image of
cross section that was generated by the device is shown in
Figure 3.
Figure 2 Prototype device and generating process of cross
Figure 3 Sample image of cross section.
Evidently the developed prototype device is only
capable of generating the cross section to test the
performance of the proposed detection method. However,
the final goal of our system is to make a separation of the
whole stem from the leaves in a fully automatic process
after simply setting the wakame and the functions of this
device will be applied to the automatic system in our next
work.
2.2 Detection unit setup
Images of wakame were acquired using a color
CMOS camera (Imaging Source DFK 42AUC03).The
camera has a lens with a focal length of 6 mm, mounted
in the front of the device.The view field of camera has a
width of 116mm and a height of 87mm at a distance of
145 mm from itself and the cross section of wakame. A
single pixel represents approximately 0.1mm.The setup
for image capturing is also shown in Figure 2, and a
sample image captured by the setup can be seen in Figure
3. The environment for collecting data is chosen as
normal office environment with fluorescent lighting
source. To deal with distortion of the image, a typical
problem caused by the lens system, calibration,a process
of estimating intrinsic and external parameters to
minimize the discrepancy between the observed image
features and their theoretical positions, is carried out. In
the present work, the camera is calibrated using a method
proposed by Zhang (2000), and undistortionisapplied to
the captured image.
2.3Exposure control
In order to find the separating positions between the
stem and the leaves, it is crucial to identify the variation
of thickness. For this, however, the most important is to
accurately segment the overall cross section of wakame.
Considering the segmentation, setting a ‘good background,’ from which the cross section can be easily
extracted, is a simple and effective way to be used.
However, directly applying a conventional segmentation
method to the image even with the ‘good background’
does not guarantee the accuracy of the extraction due to
several problems, e.g., reflection appeared around the
cross section of wakame and noise of camera, etc. In this
work, we have focused on a segmentation method with
the use of controlling ‘Exposure,’ which is an important
part of camera and controlling it is an essential process of
photographic light sources. By default settings, most
digital cameras generally implement an automatic
exposure adjustment algorithm to compensate for overall
scene light level changes such as going between lit and
unlit environments (O'Malley et al., 2010). Exposure can
also be manually controlled by changing any of three
parameters, which are shutter speed (exposure time),
F-number (aperture) and ISO value (sensitivity). Most of
the industrial cameras are available for programmable
exposure control. For these cameras, exposure is usually
controlled by changing shutter speed.
Along with setting the configuration of a camera with
higher shutter speed, the target will gradually appear dark,
such that the image detail can be lost in the end. On the
contrary, with slower shutter speed, the intensity of the
bright target can cause saturation in the image, such that
color and shape information can be lost. Since we are
only interested in accurately segmenting comparatively
dark-colored object, wakame, losing the shape and color
of other parts is beneficial to our work. The result of
making lower shutter speed loses high intensity detail in
the resultant scene, which is not of interest to this system.
Therefore, further reduction in high intensity parts of the
image can simplify the wakame segmentation process.
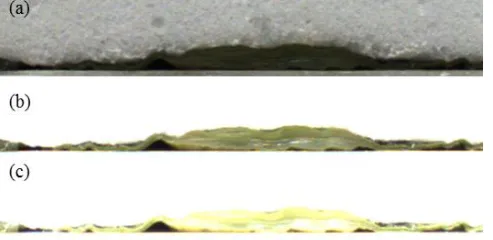
Some of the sample images captured with different
Figure 4 Sample images with different configuration of
shutter speed: (a) automatic exposure control,
(b)exposure time is 0.143 s and (c) exposure time is 0.321
s
As shown in Figure 4, along with slowing the shutter
speed, the background is gradually lost its detail and
becomes white, at the same time the cross section of the
wakame also changes its color from dark to light. In the
present work we utilize this phenomenon to extract the
cross section. Therefore, we firstly need to establish a
way to automatically choose proper exposure
configurations, because the exposure time is mostly
relative to the light condition. In different environments,
e.g. different rooms or different place in the same room,
the images captured with the same exposure time may be
slightly different even with an installed illumination
device. A solution for this problem is to apply a tuning
process with the start of the system. By this way the
system can also perform an automatic calibration of the
exposure time.
The proposed tuning process is carried out by
matching colors of the particular regions in the captured
image to the pre-specified colors. The colors used for
matching are obtained from two color marks, red and
green, which are attached to the device as shown in
Figure 2. In our work, since the segmentation of the
cross section is accomplished by exploiting two images
captured with two different exposure configurations, we
need to set two exposure times, E1 and E2. The main
steps of tuning process of E1 are described as follows:
(1) Initialize E1 as the default exposure time (which
is obtain by the automatic exposure control)
(2) Capture an image and compute the average
intensity
ave
R of the specified region in the green markof that image by following Equation 1:
MN j y i x f
ave N
N j
M M
i R R
R
2 /
2 /
2 /
2 /
) ,
( (1)
whereMN is the size of a window in the green mark and
(xR, yR) is the location of the window in the captured
image.
(3) Calculate the stop condition QR as in Equation 2:
otherwise false
d ave if true
QR R R R
,
,
(2)
where
Risabsolute error, and dR is a constant value andfound by trial and error from pre-experiments of tuning
process.
(4) Repeat steps (2) and (3) with (E1 + Δτ1) until the
stop condition QR becomes true.
The exposure time E2 can also be acquired by a
tuning process in accordance with the same principle as
the use of green mark. In this case, however, the red mark
is used to tune exposure, and the initial value of E2 is set
as E1 + Δτ2.
2.4 Cut position determination
After obtaining the appropriate exposure times (E1 and
E2) at the startup of the system, the camera is configured
with E1 and the system waits for the detection request.
The detection algorithm includes: image acquisition,
segmentation, thickness calculation, decision of cut
positions and configuration of camera. The flowchart of
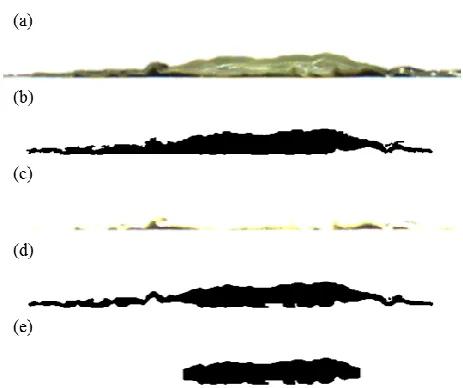
As shown in Figure 5, the image acquisition of this
algorithm includes two parts: the first is for segmenting
the whole area of the wakame, the other is for extracting
the cross section from the result of the first by a synthesis
process. When the system receives the request, it captures
the first image with the pre-configured E1. The first
image is then transformed from RGB color space to Lab color space.Here, we apply Otsu’s thresholding technique
(Otsu, 1979) to the L component of Lab color space to
segment the wakame region. The image captured with E1
is shown in Figure 6(a) and the segmentation result is
depicted in Figure 6(b). And then, the camera is
configured with E2 and captures the second image, as
shown in Figure 6(c). It is clear that the cross section in
the second image became brighter than that of the first
image. In the other regions, however, there was less of a
change in the intensity than in the cross section. We
considered that these changes can be used in effectively
extracting the cross section. To achieve this, the second
image is firstly segmented by a simple thresholding
method. The thresholding method uses two components
(red and green) of the second image, and the segmented
image is obtained by following Equation 3:
otherwise
T y x f and T
y x f if y
x
g R R G G
, 0
) , ( )
, ( ,
1 ) , (
(3)
where
f
R(
x
,
y
)
andf
G(
x
,
y
)
are the intensity values of R and G components of the second image, andT
RandG
T
are threshold values, respectively. In the present work,R
T
andT
Gare set as 200 and 150, experimentally.After these two segmentations, the results of them are
combined by a simple logical ‘AND’ operator to extract
the cross section. The extracted result obtained from
Figure 6(a) and (c) is illustrated in Figure 6(d). Following
these, the thickness is calculated by counting the
minimum lengths of straight line segments that pass
through the pixels of interest and cross the edges of
extracted cross section. Here, the pixels of interest
indicate the pixels on the centerline of the extracted cross
section. The centerline is obtained by implementing
Hilditch’s thinning algorithm (Gonzalez and Woods,
1992) to the synthesized binary image.
Figure 6 Imaged wakame and segmented results: (a)
acquired image with red mark, (b) segmented result of (a),
(c) acquired image with green mark, (d) segmented result
of (c), and (e) extracted cross section of wakame
Finally, the identification of where to separate the
stem from leaves is achieved by using the calculated
thickness. In this case, two approaches can be considered
as common ways to be adopted: finding a characteristic
thickness change around the boundaries or investigating
the distribution of the thickness of the boundaries. For the
first one, it is difficult to find that characteristic due to the
irregular change from the leaves to stem. In addition, the
shape of each sample is different from the other.
Therefore, in the present work, we have measured the
thickness of roots over many salted wakame samples. The
measurement was performed at an interval of 20 mm for
each sample by generating the cross section. We found
that the thickness of the boundary regions is distributed
around 1mm, and is mostly related to the thickness and
width of the stems. Consequently, for our work we
simply selected a 1mm (approximately 11 pixels)
thickness as a boundary point. This means if the thickness
is less than 11 pixels then they will be treated as the
leaves. The extracted stem area of Figure 6(a) is shown in
Figure 6(e). This figure is only illustrated to visualize the
positions at where it should be cut, but for the final
system it is limited to return a feedback of cut positions
corresponding to the origin.
3 Results and discussion
In order to evaluate the performance of the proposed
detection method, 10 samples of salted wakame were
used in the experiments. All of the samples were
harvested from Sanriku region, the largest wakame
culturing place in Japan. The root width of the stem
varies from 10mm to 43mm, and length of them varies
from 500mm to 1800mm. Generally, the stem can be
smoothly removed from the leaves (from root to tip) if the
leaves do not break-off during the separation. In some
cases, however, the leaves may break-off and the
re-removing process will be necessary to carry out again
from where the separation failed. Considering the failed
process and making the experiments on different breadths,
the cross sections were generated at interval of 20mm for
each sample in this work. Consequently, the total of 100
cross sections was generated from 10 wakame samples.
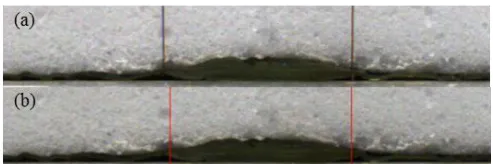
In order to compare the detected results with the observed
positions, 2 fine wires with diameter of 0.1 mm were
vertically set in front of the boundaries of stem and leaves,
wherein the set positions were decided by visual
observation. The positions indicated by 2 wires were then
used as ground truths (GTs) to calculate the differences
between detected positions and GTs. An example of
setting set wires is illustrated in Figure 7(a), and (b)
shows the experimental result of detected cut positions
that correspond to the GTs, in which two vertical red
lines indicate the detected positions.
Figure 7 (a)Observed positions indicated by two wires,
(b) detected positions indicated by two vertical red lines.
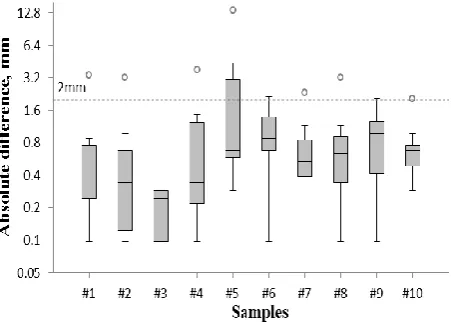
In this work, the absolute differences between
detected positions and GTs were calculated respectively
with regard to the right and left side of the stem, and the
distributions for each wakame sample are plotted in
Figure 8 andFigure 9, respectively. The x axis shows the
absolute difference, and the y axis indicates the number
of samples. The measurements for each sample are shown
as box plot (Moses, 1987), in which the median values
are shown as thin horizontal lines. The box covers the
range between the twenty-fifth and seventy-fifth
percentile, and the whiskers outside the box are extended
to the maximum and minimum values within 1.5 times
the interquartile range. Points outside the whiskers are
outliers and extremes that indicate the incorrect detection.
Observing the parts that are over 2mm line, we can easily
find that most of the incorrect detections were occurred
on the sample #5. This sample was the largest wakame
among the given samples, and the average width and
were 45mm and 4mm, respectively. In addition to the
thickness of cross section that exceeded the pre-set
thickness condition, the uneven surface of the cross
section can be considered as the reasons for the incorrect
detections.
Figure 8Box plot of absolute differences between
detected positions and observed positions for the left side
of all samples.
Figure 9Box plot of absolute differences between
detected positions and observed positions for the right
side of all samples.
To better understand the relation between detection
rate and allowable absolute difference range (AADR), we
calculated the detection rates corresponding to different
AADRs, and illustrated them in Figure 10. From the
figure, it can be known that the detection rate was only
25% while AADR was selected as 0.5 mm, and it
increased along with extension of the AADR. By manual
separation, however, it is said that there is an average of
1.5 mm part of stems left on leaves. Accordingly, the
detection rate can be considered as 76%. Moreover, in
our method pre-set thickness condition was simply
selected as 1mm, and it did not give a good detection
especially for the thick wakame as like the sample #5.
Therefore, the detection rate can be improved by
employing a dynamic selection of thickness condition
corresponding to the thickness and width of cross-section.
Figure 10 Detection rate corresponding to the allowable
absolute difference range.
In the proposed method, computational time is a major
problem that should be dealt with in our future work,
because it takes an average of 1 s to accomplish the
detection. The reason for this problem is that the method
needs to capture 2 images in accordance with the changed
exposure time, and the time taken by them accounts for
more than half of the total computational time. One of the
solutions to deal with this problem may be the utilization
of two cameras, that is, configuring two cameras with two
proper exposure times (with regard to the red and green
marks) after applying the tuning process as the system
starts; otherwise, finding a direct way (without
controlling exposure time) to perform stable segmentation
would be the best way to solve this problem.
In light of the strong need to develop a new system for
wakame production, we developed a method that detects
the positions of where the robot should automatically
separate the stem from the leaves. In the proposed method,
corresponding to two exposure configurations, two
images were captured from the same cross section of
wakame that is made by a developed cross section
generation device. These images werethen utilized in the
segmentation of the cross section. Finally, the cut
positions are determined by using the thickness of the
cross section. Performance tests of the proposed method
showed that it can give good results for finding the
positions. Future works will involve that to establish a
dynamic thickness condition in accordance with the
change of the width and thickness of the cross section and
to find much more effective way of not only reducing the
processing time but also accurately segmenting the cross
section.
References
Fujii, S.,and T.Korenaga.2000. Analysis of material flow and design of zero-emission technology in production process of Wakame (Undariapinnatifida).Environmental Science (Japan), 13(5): 586-592. (in Japanese).
Gonzalez, R. C., andR. E. Woods.1992.Digital Image Processing. Addison-Wesley PublishingCo., Boston.
Hasegawa, K.,andS. Suzuki.2005. Work analysis of harvesting and salt-preserved wakame seaweed (Undariapinnatifida)
processing.Technical Report of National Research Institute of Fisheries Engineering (Japan),27: 61-80. (in Japanese). Inoue, Y., K. Matsumura,andT. Bandou. 2004. The processing test
to separate a leaf from a stem of cultured wakame seaweed (Undariapinnatifida) using the developed leaf separator machine. Technical Report of National Research Institute of Fisheries Engineering (Japan), 26: 47-51. (in Japanese) Ministry of Agriculture, Forestry and Fisheries of Japan.
2010.Statics of Agriculture, Forestry and Fisheries: IndustrialCrops.Available
at:http://www.maff.go.jp/j/tokei/kouhyou/kaimen_gyosei/. (inJapanese)
Murata, M.,and J.Nakazoe.2001. Production and use of marine algae in Japan.Japan Agricultural Research Quarterly, 35(4): 281-290.
Moses, L. E. 1987. Graphical methods in statistical analysis.
Annual review of public health8(1): 309-353.
O'Malley, R., E.Jones,and M.Glavin. 2010. Rear-lamp vehicle detection and tracking in low-exposure color video for night conditions. Intelligent Transportation Systems, IEEE Transactions,11(2): 453-462.
Onodera, M., and S. Ishimura. 2007. MethodforRapidly Salting Seaweed and Salted Seaweed Produced by the method. Japan Patent No.JP2005367117 (In Japanese).
Otsu, N.1979.A threshold selection method from gray-level histograms. Systems, Man, and Cybernetics, IEEE Transactions, 9(1): 62-66.
Yamanaka, R.,andK. Akiyama.1993. Cultivation and utilization of Undariapinnatifida (wakame) as food. Journal of applied phycology, 5(2): 249-253.