CONSUMERS’ PREFERENCE AND SATISFACTION OF GSM SERVICE PROVIDERS
AMONG STUDENTS OF TERTIARY INSTITUTIONS IN LAGOS STATE, NIGERIA
A. M. Opele
1, O. J. Afolabi
2, *and T. A. Onifade
31, 3,
D
EPARTMENT OFB
USINESSA
DMINISTRATION,
B
ELLSU
NIVERSITY OFT
ECHNOLOGY,
O
TA,
O
GUNS
TATE,
NIGERIA
2,
D
EPARTMENT OFM
ANAGEMENTT
ECHNOLOGY,
B
ELLSU
NIVERSITY OFT
ECHNOLOGY,
O
TA,
O
GUNS
TATENIGERIA
E-mail addresses:
1[email protected]
,
2[email protected],
3[email protected]
ABSTRACT
This study contributes to intellectual discuss on consumer preference and satisfaction for GSM service providers in the context of students of tertiary institution in Lagos State, Nigeria. Using primary data, the study provide answer to four research questions and tested four hypotheses with a view to establish the influence of consumers’ preference and satisfaction of GSM service providers in Nigeria. The findings revealed a significant positive relationship between service assurance, service empathy, service reliability, service responsiveness and customers’ satisfaction of GSM service provision among students of tertiary institution in Lagos State. Also, the study also indicated that all variables accounted for 64% of the variance in service satisfaction (R2 = .645; F = 20.400, P = .000). Nonetheless, service reliability (β = .267, t = 3.439, p = .001) was found to have the greatest influence on service satisfaction followed by service assurance (β = .170, t = 2.987, p = .005) and service responsiveness (β = .135, t = 2.056, p = .046). On the other hand, only service empathy was not found to have influence service satisfaction.
Keywords: Consumer preference, customer satisfaction, assurance, responsiveness, reliability.
1. INTRODUCTION
The inability of the Nigeria Telecommunication Limited (NITEL) to meet the communication needs of the people before 2001, lead the Nation among other things to move from a monopolistic telecommunication market to a fully liberalized telecommunication market where there is competition or what can be called revolution in the communication subsector of the economy through the introduction of Global System for Mobile (GSM) Communication service providers whom were licensed to operate in 2001 [2]. Two private companies, MTN of South Africa and ECONET of Zimbabwe, were licensed by National Communication Commission (NCC) to operate GSM in addition to NITEL, the country’s own Telecom Company. These two companies alone increased the mobile telephone line from 300,000 in 2001 to 1,660,000 in 2002 [37]. In 2003, another GSM private provider, GLOBACOM, entered the market with its mobile service Glo-mobile. Thus, it is fair to say that mobile telecommunication, popularly called GSM, has come to stay after Nigeria had battled with the inefficiency of the only service provider, NITEL for ages prior to year 2001. Consequently, consumers can now choose among
multiple service providers, due to the successful deregulation and globalization of the Nigerian telecommunication industry. Nigeria currently have four major service providers that is, Airtel, MTN, Globalcom and Etisalat. However, in order to meet organizational goals, a firm must determine the needs and wants of its consumers and then deliver products and services that satisfy those needs and wants more efficiently than its competitors. In today's telecommunication industry, with its advances in communication technology, delivering services that appeal to consumers should be easier than in the past. An important task, therefore, is to determine, with some reasonable degree of precision, what consumers want or prefer from telecom service providers’ attributes.
Since customer preferences are the subjective (individual) tastes, as measured by utility of various bundles of goods. Preferences permit the consumer to rank these bundles of goods or services according to the level of utility they give the consumer. Consumers of telecommunication products and services in Nigeria are varied and their needs, tastes and expectations are also varied [30]. Customer satisfaction on the other
Vol. 37, No. 4, October 2018, pp.
1099 – 1109
Copyright© Faculty of Engineering, University of Nigeria, Nsukka,Print ISSN: 0331-8443, Electronic ISSN: 2467-8821 www.nijotech.com
hand is the extent to which a firm fulfils a customer needs, desires and expectation better than the competitors.
Literature have shown that a lot has been written about factors that influence customers decision to choose a particular network service provider; Aminu, et al. [5], examined marketing mix value added service, price and promotion; Slew-Phaik, et al. [41] investigated service quality and customer satisfaction in a telecommunication service provider in Malaysia; also, Ogwo, et al. [33], looked at service quality, customer value, brand image/reputation; Asiegbu, et al. [7], observed social affinity, switching cost, and customer service. Olatoku, et al. [34] looked at call rate (price), service quality, service availability, promotion, and brand image; [37], use conjoint analysis to analyse subscribers’ preferences for telecommunication attributes in Nigeria; Dabadhe, et al. [13], considered the impact of service quality on customer satisfaction of mobile users in Indian; In addition, Mooed, et al. [27] observed service quality dimensions impact on customer satisfaction in telecom sector of Pakistan. The various mobile phone service providers in Nigeria play essential role in fulfilling the needs of the consumers, they also provides varieties of mobile phone services for the Nigerian consumers to make their choices, however, there are complaints from customers about the service delivery of networks which could not be accredited to customer satisfaction. Therefore, there is need for the operators in the telecommunication industry to seek ways to improve upon the quality of their product and services. The focal point of this study was to understand the factors that influence mobile phone users in their choice of a mobile phone service provider in the Nigerian mobile telecom market by examined the influence of service assurance, service responsiveness and service reliability on mobile phone users’ perception in selecting a service provider among university students in Lagos State, Nigeria.
2. CONCEPTUAL CLARIFICATION 2.1 Consumer Preference
Consumer preference is defined as the subjective (individual) tastes, as measured by utility of various bundles of goods. According to Novemsky, et al. [31], the consumer preferences are positive motivation, expressed by the affective compatibility towards a product, service or trading firm. Preferences can be triggered by the features related to the material substance of the goods (shape, size, print, taste, colour, consistency, package, etc.); elements referring to label,
name, use instructions that accompany the product; the statute granted to the person owning and using that particular product.
Literatures have shown that preference is different from the concept of choice, choice and preference are two radically different entities: choice is an action while preference is a state of mind [28]. Preferences are the result of a long-term relationship between the brand and the consumer, as choice learns to associate the brand with a symbol and perceive it as having high quality. Following these deep connections created over the course of time, a strong emotion is developed which lies on the basis of preferences, remaining present even in the absence of the friendly symbol or of any other component feature. Additionally, conducted studies have established various concepts related to the preference, such as the concept of the formed preference which underlines the idea that the consumers’ preferences are not better defined, but rather formed along the process of choosing, a constructive point of view which suggests that different tasks and contexts highlight different aspects of the options, the consumer concentrating on different considerations leading to inconsistent decisions. Knowledge of consumer preferences is especially important with respect to the various activities carried out at the organizational level, necessary for its survival.
responsiveness, assurance and reliability in defining, developing, and delivering services will most likely increase customers perceptions of values; which may lead to higher customer satisfaction.
2.2. Assurance
Assurance is knowledge and courtesy of employees and their ability to convey trust and confidence [4]. The assurance dimension is particularly important in service industries offering high level of credence qualities, such as auto repair, medical and telecommunication services. The importance of the assurance dimension increases in proportion to the risk and the greater the inability for a customer to evaluate the service [18]. Employees should have the competence to inspire trust and confidence in consumers about the ability of GSM service providers in anticipating and meeting consumers’ need. Offering better warranty terms convey greater assurance to customers and can result in greater sales.
2.3 Reliability
This is the ability to perform the promised service dependably and accurately [17]. Reliability means accomplishing the services on time and in consistent manner, free from errors. Reliability is defined as the ability to perform the promised service dependably and accurately. [18] emphasized that reliability means doing what you say you will do.
2.4 Responsiveness
Responsiveness is the willingness to help the consumers in case of any problem. Solving the complaints of consumers efficiently creates a positive image about the quality of service but if consumers are kept waiting, it creates negative impression about the quality of service [23]. Responsiveness is the willingness to help customers and to provide prompt service [24]. Ibrahim, et al. [18] stated that customers judge a company’s responsiveness by assessing the amount of time it takes and the attentiveness that is offered in response to their requests, questions, complaints, and problems. Responding quickly to requests or complaints leads to a higher rating on this dimension. Responsiveness accounts for a prompt response to consumers’ need. GSM consumers are keen to get prompt response from the service providers regarding their complaints and enquiries.
2.5 Customer satisfaction
Oliver [35] defined the satisfaction as post consumption judgment by the consumers that whether
a product or service provides a gratifying level of consumption biasness. Thus, for maintaining a long-term relationship between exchange parties, significance of procedural fairness cannot be denied. Study of [10] argued that satisfaction does not depend on the product or service itself rather it relies on the customer’s perception.
Likewise, Cronin et al. [12] stated that satisfaction is as a result of perception of the customer about the value received. Moreover, study of Choi, et al. [11] found that there is a positive influence of perceived value on the satisfaction. Therefore, it is understood that satisfaction level varies to customers experiencing the same level of services. Rapid technological improvements and sturdy competition are forcing the firms to centre their thoughts towards increased market share, for which, customer satisfaction is recognized as a central concept [20]. Achieving customer satisfaction leads the firms towards customer loyalty, improved profitability, positive word of mouth and depressed market expenditures [39].
Customer satisfaction is an evaluation of the perceived discrepancy between prior expectations of the customer and the actual performance of a product [42]. It is how customer evaluates the ongoing performance of a product or service. In the study of Choi, et al. [11] customer satisfaction refers to customer’s reaction to the state of satisfaction, and customer’s judgment of satisfaction level. Customer satisfaction is very important in today’s business world, the ability of a service provider to create high degree of satisfaction is crucial for product differentiation and developing strong relationship with customers. Actual manifestation of the state of satisfaction will differ from one person to another, from one product/service to another. The state of satisfaction depends on a number of factors which consolidate as psychological, economic and physical factors.
showed that the main determinants of customer satisfaction are the behaviour of employees, cleanliness and timeliness. Kang and James [21] concluded that staff quality, product qualities and value are the top three factors that determine customer' satisfaction. These portray good service quality which intend commanding choice behaviour of customer and enhance high patronage.
3. THEORETICAL AND EMPIRICAL REVIEW
The theory underpinning this study was equity theory which argues that people are motivated when they compare the ratio of their input to received outcomes with that of others. Equity theory “focuses on determining whether the distribution of resources is fair to both relational partners” [1]. Equity is measured by comparing the ratio of contributions (or costs) and benefits (or rewards) for each person.
Many studies have been conducted on consumer preference, customer satisfaction and service quality, examples, a study of Siew-Phaik, et al [41] on service quality and customer satisfaction in telecommunication service provider in Malaysia. Servqual model was used to examine the impacts of reliability, responsiveness, assurance, empathy and tangible aspects on customer satisfaction while gap analysis was used to determine the perceived satisfaction on each dimension of service quality and regression analysis was conducted to test the relationship between service quality and level of customer satisfaction. Results indicated that reliability, responsiveness, assurance and empathy positively influenced customer attitudes in terms of satisfaction and loyalty. Likewise the study conducted by Dabhade, et al [13] on impact of service quality and customer satisfaction of mobile users-A case study of Airtel, in India, data was collected through survey method while chi square test was applied to check the authenticity of data given by respondents’ and the findings showed that Airtel provided broad network coverage, heavy expenditure on advertisement, low call drops, good voice quality and many more. This made Airtel become the utmost priority of customer.
Maliki, et al. [26] carried out a research on impact of brand image, service quality and price on customer satisfaction in Pakistan telecommunication sector. Data was collected from educational and business sector of Gujranwala region of Pakistan using stratified random sampling technique. The result indicated that brand image, service quality and price are correlated to customer satisfaction. In addition, the study conducted by Oghojafor, et al. [32] on modelling telecom customer attrition using logistic regression. The study was
conducted in Nigeria, a sample survey was conducted using two stage sampling technique. 600 subscribers were randomly selected in 14 local government areas in Lagos state, logistic regression model was applied to examine the effect of socio-economic factors that influence subscribers switching from one service provider to another and findings revealed that call expenses, providers’ advertisement medium, type of service plan, number of mobile connections and providers service facilities are reliable indicators of customers’ attrition.
A research paper by Agu, et al. [3] on marketing implications of call drops for the patronage of GSM service in Nigeria. The survey research design was adopted using the cross-sectional survey approach in which primary and secondary data were extensively used, collected data were analysed using tables and percentages while hypotheses were tested using spearman’s rank order correlation coefficient and chi square. It was discovered from the study that incessant call drops impact negatively on the level of loyalty, satisfaction and customer patronage of GSM services. Likewise in Kastina State, Nigeria, Shagari and Abubakar [40] appraised customer satisfaction with GSM operators in Dutsin-ma. The results of their work revealed that customers were not satisfied with the customer care services provided by GSM operators in Dutsin-ma.
4. MATERIALS AND METHOD
The research adopted descriptive survey research design which employed a well self-administered questionnaire for data collection among 100 students each from Lagos State Polytechnic Ikorodu, University of Lagos Akoka and Lagos State University Ojo to make a sample of 300. Simple random sampling techniques were used to select the respondents across faculties and departments. The data collected was analysed using deceptive statistics, correlation and regression analysis with the aid of statistical package for social sciences.
5. RESULTS AND DISCUSSION
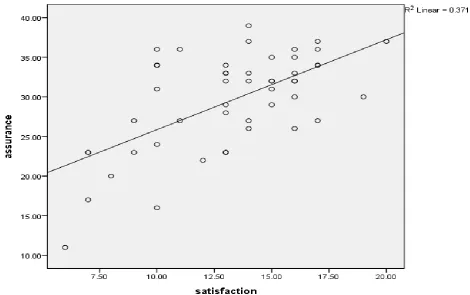
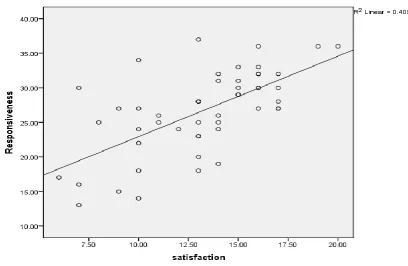
28%. The results also revealed that the highest percentage of the respondents 42% used MTN, although nearly everyone used more than a network. Descriptive Statistics of respondents rating of service assurance revealed a high-level of assurance of the service providers with an average mean of 3.7 on the scale of 5 points (Table 2). The findings (Table 3) revealed a high-level of service empathy of the GSM service providers with average mean of 3.6. As regards service reliability, the respondents indicated a high level of service reliability among GSM service providers even though there are occasional cases of total service failure on the campus (Table 4). The study found a high-level of service responsiveness (Table 5) implying that the GSM service provision on the campus is dependable relatively speaking. The study indicated a significant positive relationship between service assurance, service empathy, service reliability, service responsiveness and customers’ satisfaction (Figures 1-4). The study also revealed that in addition to the most used, MTN was the most preferred (Table 6) due to high-level of responsiveness and reliability of their services in comparison with other networks. Besides, majority wish to continue using the network and even willing to recommend to others.
Table 7 revealed the outcome of the hypothesis formulated and indicated that all variables accounted for 64% of the variance in service satisfaction (R2 =
.645; F = 20.400, P = .000). Nonetheless, service reliability (β = .267, t = 3.439, p = .001) was found to have the greatest influence on service satisfaction followed by service assurance (β = .170, t = 2.987, p = .005) and service responsiveness (β = .135, t = 2.056, p = .046). On the other hand, only service empathy was not found to have influence service satisfaction.
Table 1: Socio-demographic characteristics of the respondents
Parameters Classification Frequency Percentage (%)
Sex
Male 120 40.0
Female 180 60.0
Total 300 100.0
Marital status
Single 276 92.0
Married 24 8.0
Total 300 100.0
Age
Below 25years 216 72.0
Above 25 years 84 28.0
Total 300 100.0
Network used**
Airtel 66 22.0
Etisalat 66 22.0
Glo 42 14,0
MTN 126 42.0
Total 393 100
** Multiple responses; Source: Authors Field Survey, 2018
Table 2: Descriptive Statistics of Service Assurance
Strong
Agree Agree Undecided Disagree
Strongly disagree
Mean Score The customers service staff are polite and always attend to
customers with courtesy 21(42.0) 22(44.0) 3(6.0) 4(8.0) 0(0.0) 4.16
the service provider staff 20(40.0) 21(42.0) 4(8.0) 4(8.0) 1(2.0) 4.04
And always attend to consumer with 9(18.0) 32(64.0) 5(10.0) 3(6.0) 1(2.0) 3.78
Customer service staff seem to have received adequate
supports from the service provider to do their job well 14(28.0) 24(48.0) 7(14.0) 3(6.0) 2(4.0) 3.72
I am pleased with the knowledge of the employees 8(16.0) 28(56.0) 8(16.0) 4(8.0) 2(4.0) 3.52
I can trust the service provider staff 4(8.0) 28(56) 4(8.0) 10(20.0) 4(8.0) 3.48
The customer service staffs are polite 5(10.0) 30(60.0) 10(20.0) 10(20.0) 0(0.0) 3.40
I feel saved when dealing with 8(16.0) 23(46.0) 8(16.0) 7(14.0) 8(16.0) 3.38
Average Mean = 3.7
Source: Authors Field Survey, 2018
Table 3: Descriptive Statistics of service Empathy Strongly
Agree Agree Undecided Disagree
Strongly
Disagree Mean
Std. Deviation The service provider gives me
attention 151(14.2) 629(59.3) 111(10.5) 135(12.7) 34(3.2) 3.64 1.10
My service provider inform me of any network problem due weather condition or system upgrading
Strongly
Agree Agree Undecided Disagree
Strongly
Disagree Mean
Std. Deviation My service provider understands
the needs of consumer with much care and attention
156(14.7) 535(50.5) 165(15.6) 165(15.6) 39(3.7) 3.45 1.25
Whenever I have network problem, my service provide always sympathetic and reassuring
222(20.9) 442(41.7) 178(16.8) 170(16.0) 48(4.5) 3.45 1.33
My service provider places
customers best interest at heart 117(11.0) 469(44.2) 219(20.7) 188(17.7) 67(6.3) 3.19 1.32 My service provider place me
above everything else during the course of interaction with staff
135(12.7) 416(39.2) 231(21.8) 209(19.7) 69(6.5) 3.15 1.35
My service provider treats me
like king 108(10.2) 390(36.8) 246(23.2) 230(21.7) 86(8.1) 3.03 1.34
The service provider staff knows
what I actually want 102(9.6) 351(33.1) 253(23.9) 275(25.9) 79(7.5) 2.97 1.32 Mean Score = 3.30
Source: Authors Field Survey, 2018
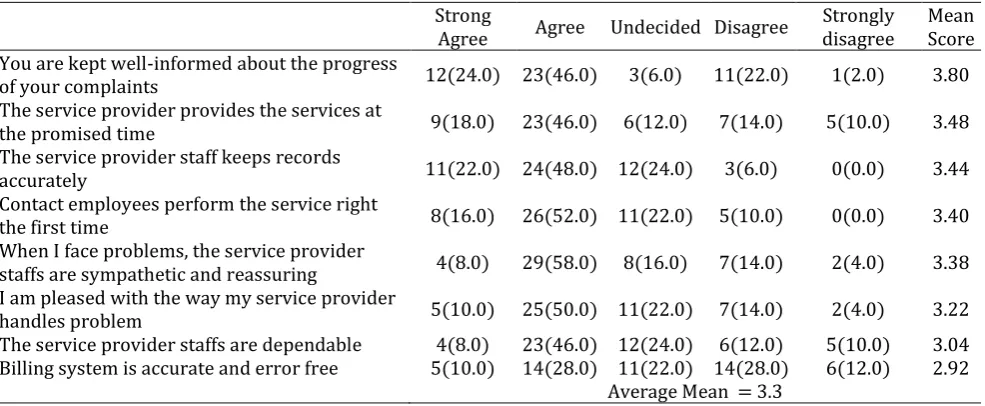
Table 4: Descriptive Statistics of Service Reliability Strong
Agree Agree Undecided Disagree
Strongly disagree
Mean Score You are kept well-informed about the progress
of your complaints 12(24.0) 23(46.0) 3(6.0) 11(22.0) 1(2.0) 3.80
The service provider provides the services at
the promised time 9(18.0) 23(46.0) 6(12.0) 7(14.0) 5(10.0) 3.48
The service provider staff keeps records
accurately 11(22.0) 24(48.0) 12(24.0) 3(6.0) 0(0.0) 3.44
Contact employees perform the service right
the first time 8(16.0) 26(52.0) 11(22.0) 5(10.0) 0(0.0) 3.40
When I face problems, the service provider
staffs are sympathetic and reassuring 4(8.0) 29(58.0) 8(16.0) 7(14.0) 2(4.0) 3.38 I am pleased with the way my service provider
handles problem 5(10.0) 25(50.0) 11(22.0) 7(14.0) 2(4.0) 3.22
The service provider staffs are dependable 4(8.0) 23(46.0) 12(24.0) 6(12.0) 5(10.0) 3.04 Billing system is accurate and error free 5(10.0) 14(28.0) 11(22.0) 14(28.0) 6(12.0) 2.92
Average Mean = 3.3 Source: Authors Field Survey, 2018
Table 5: Descriptive Statistics of Service Responsiveness Strong
Agree Agree Undecided Disagree
Strongly disagree
Mean Score The service provider staffs are always willing to
help you 11(22.0) 29(58.0) 4(8.0) 3(6.0) 3(6.0) 3.80
The service provider staff do not appear to be
too busy in responding to customer request 7(14.0) 26(52.0) 8(16.0) 6(12.0) 3(6.0) 3.42 I am satisfied with the willingness of
employees of my service provider 4(8.0) 30(60.0) 7(14.0) 5(10.0) 4(8.0) 3.40 Your complaints are always taken seriously 7(14.0) 27(54.0) 9(18.0) 3(6.0) 4(8.0) 3.38 Your complaints are resolved quickly 11(22.0) 16(32.0) 9(18.0) 11(22.0) 3(6.0) 3.34 Contact employees give you prompt service 3(6.0) 30(60.0) 9(18.0) 6(12.0) 2(4.0) 3.32 I receive prompt service from the service
provider 4(8.0) 27(54.0) 9(18.0) 7(14.0) 3(6.0) 3.28
Table 6: Consumer Preference of GSM Service provider
Frequency Percent
MTN 138 46.0
Airtel 84 28.0
Etisalat 60 20.0
Glo 18 6.0
Total 300 100.0
Most influential factor of the preferred network
Assurance 66 22.0
Empathy 60 20.0
Reliability 78 26.0
Responsiveness 96 32.0
Total 300 100.0
Intent to continue with preferred GSM Service Provider
Yes 270 90.0
No 30 10.0
Total 100.0
Like to recommend to others
Yes 258 86.0
No 42 14.0
Total 100.0
Source: Authors Field Survey, 2018
Analysis of Research Question
Research Question 1: What is the relationship between service assurance and customer satisfaction with GSM service providers?
Research Question 2: What is the relationship between service empathy and customer satisfaction with GSM service providers?
Research Question 3: What is the relationship between service reliability and customer satisfaction with GSM service providers?
Research Question 4: What is the relationship between service responsiveness and customer service with GSM service providers?
Testing of Hypothesis
Service assurance, service empathy, service reliability and service responsiveness will not jointly influence customer satisfaction with GSM service provision among students of tertiary institutions in Lagos State.
Figure 2: showed a significant positive relationship between service empathy and customer satisfaction with GSM service providers(r= 0.337, P<.05).
Figure 4: Revealed a significant positive relationship between service responsiveness and customer satisfaction with GSM service providers(r= 0.409, P<.05)
Table 7: Results of regression analysis of the influence of service assurance, service empathy, service reliability and service responsiveness on customer
satisfaction
Predictors Unstandardized
Coefficients
Standardized Coefficients
t Sig.
B Std. Error Beta
(Constant) -2.104 1.752 -1.201 .236
Assurance .170 .057 .317 2.987 .005
Empathy -.016 .075 -.028 -.209 .835
Reliability .267 .078 .449 3.439 .001
Responsiveness .135 .066 .246 2.056 .046
a. Dependent Variable: service satisfaction
R2 = .645; F = 20.400, P = .000
6. CONCLUSION
The main focus of the study was to determine the relationship between service assurance, service empathy, service reliability, service responsiveness and customers’ satisfaction with GSM service provision among students of tertiary institution in Lagos State. The outcome of the study revealed a significant positive relationship between the constructs examined. However, on the level of influence, the study found that only service empathy was not found to have influence service satisfaction to undergraduate students in the selected university. Nonetheless, the aspect of empathy was particularly striking, implying that service provision that lacks empathy may only draw the
attention of the customers to a short period of time. Hence, GSM service providers need to improve on their level of empathy so as to draw more customers to their services.
7. REFERENCES
[1] Adams, J. S.. Towards an understanding of inequity. Journal of Abnormal and Social Psychology, 67(7), 422-436, 1963.
[2] Adebiyi, S. O., Shitta, H. A. & Olonade, O. P.. Determinants of customer preference and satisfaction with Nigerian mobile telecommunication services, Journal of Management and Research, 8(1), 1-12, 2016.
[3] Agu, G. A., Acha, I.,&Anyawu, A. Marketing implications of call drops for the patronage of GSM services in Nigeria. Developing Country Studies, 3(8),82-89, 2013.
[4] Akbar, M. M. &Parvez, N. Impact of service quality, trust, and customer satisfaction on customers’ loyalty. ABAC Journal, 29(1), 24-38, 2009.
[5] Aminu, A., &Hartini, A.. Marketing Mix Drivers of Client GSM subscribers. Communication of the IBIMA, 1, 23 – 41, 2008.
[7] Asiegbu I. F., Igwe S. R., &Iruka C. H. Antecedents of Intention-to-use a Particular Mobile Service among South- South University Lecturers in Nigeria. International Journal of Business and Social Science,3(19), 23 – 34, 2012.
[8] Babakus, E. &Mangold, W. G.. Adapting the SERVQUAL scale to hospital services: an empirical investigation. Health Service Research, 26(6), 767-86, 1992.
[9] Bahia, K. &Nantel, J.. A reliable and valid measurement scale for the perceived service quality of banks. The International Journal of Bank Marketing, 18(2), 84, 2000.
[10] Boshoff, C. &Gray, B.. The relationships between service quality, customer satisfaction and buying intentions in the private hospital industry. South African Journal of Business Management, 35 (4) 27–37, 2004.
[11] Choi, K., Cho, W., Lee, S., Lee, H. & Kim, C.. The relationship among quality, value, satisfaction and behavioural intention in health care provider choice: a South Korea study. Journal of Business Research, 57(9), 13-21, 2004.
[12] Cronin, J. J., Brady, M. K., &Hult, G. T. M.. Assessing the effects of quality, value, and customer satisfaction on consumer behavioural intentions in service environments. Journal of Retailing, 76 (2), 193-218, 2000.
[13] Dabhade, N, and Yadav, R. K. Impact of service quality on customer satisfaction of mobile users – A case study of Airtel, International Journal of Innovative Research and Studies, 2(5), 139-163, 2013.
[14] Dick, A., &Basu, K. Customer Loyalty: Toward and Integrated Conceptual Framework. Journal of Academy of Marketing Services, 22(2), 99-113, 1994.
[15] Eshghi, A., Haughton, D., &Topi, H.. Determinants of customer loyalty in the wireless
telecommunications industry.
Telecommunications policy, 31(2), 93-106, 2007.
[16] Farris, P. W., Neil T. B, Phillip, E.P.& David J. R. Marketing Metrics: The Definitive Guide to Measuring Marketing Performance. Upper Saddle River, New Jersey: Pearson Education, Inc, 2010.
[17] Gronroos, C.. The perceived service quality concept - a mistake? Managing Service Quality,11 (3), 150- 162, 2001.
[18] Ibrahim, M., Nyame, R. K., &Kumah, A.. Quality service delivery among telecommunication service operators in Ghana: A Case of Vodafone- Ghana. International Journal of Economic and Management,11(5), 1-17, 2014.
[19] Jain, S. K., & Gupta, G.. Measuring service quality: SERVQUAL vs SERVPER scales. Vikalpa, The Journal of Decision Makers, 29(2), 25-37, 2004.
[20] Jones, T.O. and Sasser, W. E. Why Satisfied Customer Defect. Harvard Business Review, 73(6), 88-99, 1995.
[21] Kang, G.D. & James, J.. Service Quality Dimensions: An Examination of Gronroos’s Service Quality Model. Managing Service Quality, 14(4), 266–277, 2004.
[22] Kukar-Kinney, M., Xia, L., & Monroe, L.B.. Consumers’ perceptions of the fairness of price-matching refund policies. Journal of Retailing, 83(8),325–33, 2007.
[23] Lai, F., Hutchinson, J., Li, D., & Bai, C. An empirical assessment and application of SERVQUAL in mainland China’s mobile communication industry. International Journal of Quality & Reliability Management, 24(3), 244-262, 2007.
[24] Lassar, W. M., Manilis, C., & Windsor, R.. Service quality perspectives and satisfaction in private banking. Journal of Service marketing, 14(3), 244-271. 2000.
[25] Lewis, B. R. & Mitchell, V. W. Defining and measuring the quality of customer service. Marketing Intelligence & Planning, 8 (6), 11-17, 1990.
[26] Malik, M. E., Ghafoor, M. M. &Igbal, H. K. Impact of brand image, service quality and price on customer satisfaction in Pakistan telecommunication sector. International Journal of Business Science, 3 (23), 123-129. 2012.
[27] Moeed, A. S., Syeda, S.M.,&Asad Ur Rehman, S. M. Service quality dimensions impact on customer satisfaction in telecom sector in Pakistan. Journal of basic and Applied Science Research, 3(8), 27-34. 2013.
[28] Mohammad, J. &Wajidi, A. Z.. Cellular Mobile Phone Service and Users’ Preference in Quetta City. Journal of Managerial Sciences, 11(1) 141-153. 2010.
[29] Nadiri, H., Kandampully, J. & Hussain, K. Zone of tolerance for banks: a diagnostic model of service quality. The Service Industries Journal, 29(11), 1547 — 1564, 2009.
[30] NCC Press Release, Quarterly Summary of Telephone Subscribers in Nigeria, (internet) http://www.ncc.gov.ng/. (Accessed 23th May, 2017). 2015.
[32] Oghojafor, B. E. A., Mesike, G. C., Omoera, C. I. &Bakare, R. D.. Modelling telecom customer attrition using logistic regression. African Journal of Marketing Management, 4(3),110-117. 2012.
[33] Ogwo, O. E. &Igwe, S. R. ‘‘Some Key Factors Influencing Attitudes to Patronage of GSM Services: The Nigerian Experience’’. International Journal of Business and Management,7(18), 82-91, 2012.
[34] Olatokun, W. &Nwonne, S. ‘‘Determinants of Users’ Choice of Mobile Service Providers in Nigerian Telecommunications market’’. African Journal of Computing & ICT, 5(4); 19-32, 2012.
[35] Oliver, R.. Satisfaction: A behavioural perspective on the consumer. McGraw-Hill, New York, NY, 1997.
[36] Oliver. R. L..Whence Consumer Loyalty. Journal of Marketing, 63 (Special Issue), 33-44, 1999.
[37] Oyatoye, E. O., Adebiyi, S. O. & Amole, B. B. . ‘‘An Empirical Study on Consumers Preference for Mobile Telecommunication Attributes in Nigeria’’. British Journal of Ities, March. Economics, Management and Trade, 3(4); 419-428, 2013.
[38] Parasuraman, A., Zeithaml, V. A., & Berry, L. L. SERVQUAL: A multiple item scale for measuring consumer perceptions of service quality, Journal of Retailing,64(1),12-40, 1988,
[39] Reichheld, F. F. The loyalty effect: The hidden force behind growth, profits, and lasting value. Boston, MA: Harvard Business School Press. 1996.
[40] Shagari, J. N. &Abubakar, A. Appraisal of customer satisfaction with GSM service in Dutsina-Ma, Katsina State, Nigeria. European Journal of Business and Management, 6 (35), 19-24, 2014.
[41] Siew-Phaik, L., Ayankunle, .A. T., Hanisah, M. S. &Downe, A. G. Service Quality and Customer Satisfaction in a Telecommunication Service Provider, International Conference of Financial Management and Economics,11(8), 24-29, 2011.
[42] Tse, D. K., & Wilton, P. C.. Models of consumer satisfaction formation: an extension. Journal of Marketing Research, 25(1), 204-212. 1988.