http://www.sciencepublishinggroup.com/j/ijber doi: 10.11648/j.ijber.20190804.14
ISSN: 2328-7543 (Print); ISSN: 2328-756X (Online)
Modelling the Effects of Variations in Corporate Tax Rate
on Revenue Output in Zimbabwe
Leonard Mushunje
Department of Applied Mathematics and Statistics, Midlands State University, Gweru, Zimbabwe
Email address:
To cite this article:
Leonard Mushunje. Modelling the Effects of Variations in Corporate Tax Rate on Revenue Output in Zimbabwe. International Journal of Business and Economics Research. Vol. 8, No. 4, 2019, pp. 192-200. doi: 10.11648/j.ijber.20190804.14
Received: May 10, 2019; Accepted: June 24, 2019; Published: July 9, 2019
Abstract:
Corporate tax, has significantly become one of the major sources of revenue to the government. Whether the economy is shadow, enriched or booming, its government needs some revenue to promote and to lubricate its formal sector. Because of this, corporate tax at varying rates are being agreed and set by Zimbabwean government. However, less on the effects of corporate tax on revenue yields seems to be known and understood in Zimbabwe. Our conjecture was to study the effects of varying corporate tax rate on revenue. We used the simple logistic harvesting model with varying effort coefficient. Quantitative, qualitative and geometric methods were used for model results and analysis. The research was more of theoretical with a small data set used only for validating the polynomial estimation model. Interestingly, all the methods seem to move in the same direction. The results suggest that revenue is inversely related to company tax. Lastly, we used a Lagrange polynomial to predict possible revenue output from any given corporate tax rate. So, the government can use the polynomial framework when considering a revenue-neutral tax reform to apply to its economy. To validate the polynomial function, we applied the mean absolute percentage error method which supported its use.Keywords:
Corporate Tax Effort, Lagrange Polynomial, Revenue, Output, Simple Logistic Harvesting Model, Variations1. Introduction
Revenue needs have become more significant across the world due to dynamic nature of economies. Because of this, different revenue avenues have emerged so as to meet these needs. One of the interesting avenues is taxes. According to the organization for economic co-operation and development a tax is a compulsory, unrequited payment to the general government [1]. James and Nobes, supports that a tax is a compulsory levy made by public authorities for which nothing is directly received in return [2]. Therefore, taxes are transfers of money to the public sector but they exclude loan transactions and publicly produced goods and services. Taxes fall under two broad heads that is direct and indirect taxes. Direct taxes are those whose burden is directly born by the tax payer and contrary to these taxes is where the burden is transferred to others or public and are specially called indirect taxes [3]. Direct taxes include corporate income tax, personal tax, property tax and fringe benefit tax, whereas indirect taxes include value added tax (vat), excise duty and customs duty, all among others. We shall focus on one direct
controlled and regulated by Zimbabwe revenue authority (zimra). Zimra’s responsibility is also to collect other revenue streams under the revenue authority act passed by parliament of Zimbabwe in 2002. All registered companies occupying and operating in the informal sector of Zimbabwe are obliged to pay taxes levied on them. Records from zimra highlights that the lowest tax rate in Zimbabwe since 2006 was at 25% corresponding to a minimum contribution to revenue of 10%. Between 2008 and 2009 we had the highest level of corporate tax at 30,9% followed with a revenue contribution of 10% as well. This was because of failure of firm’s complaints following economic hardships during that period. However, between 2006 and the first half of 2018 the average corporate tax is 27,22% and the matching average revenue contribution is 11,33%. The current company tax rate is standing at 25% with a pending revenue contribution. Practically, corporate tax presents some notable effects on gross domestic product (GDP) of any country. Higher marginal company tax rates are often associated with low GDP levels emanating from lower investment marginal faced by firms and true otherwise, ceteris paribus. Romer and romer emphasis the negative effect of taxes on economic growth, where company tax and personal tax are identified as most damaging to the economy [5]. Ferede and dahlby used panel analysis and they found that a higher corporate tax rate is related to slower economic growth or that a 1% cut in the company tax is associated with 0.1-0.2% increase in the yearly growth rate [6]. On the other hand, economically it is believed and known that high tax efforts are associated with high revenue outcomes though it depends on many issues such as corruption levels, number of firms adhering to the tax rules and payments among others. This paper aimed at examining any existing correlations between corporate tax and revenue output in zimbabwe in a more of theoretical with slight empirical considerations and to provide a healthy tax estimation framework. An extended simple logistic harvesting modelandthree-degree Lagrange polynomial were used in meeting these aims. This harvesting model is commonly used for biological purposes and population studies and less in finance and economics (forecasting) like the one by Meyer and Ausebel [7] and this paper took it in another interesting view. The rest of paper is as follows, literature review, methodology, data, findings, overall analysis, estimation and discussions.
2. Review of Literature
Musgrave and Musgrave outlined that taxes, charges or borrowing fund the government expenditures [8]. A good tax structure had attributes that included: equitabilityin the distribution of the tax burden: minimal misallocation of resources; facilitation of macroeconomic stability, and
efficiency in administration. Mashkoor studied the relationship between tax revenues and the rate of economic growth in Pakistan [9]. The main argument was that higher taxes decrease the investment rate, discourage research and development activities (that are key to higher productivity), reduce the work effort and distort both labour and capital
markets. Using Pakistan data for the period 1973-2008, the author concluded that the direct tax to GDP ratio granger caused the growth in real GDP significantly and recommended that the country should decrease its heavy reliance on indirect taxation. our focus is not on taxation at large, rather it is strictly on corporate tax against revenue. In understanding why corporate taxation is such a highly contested issue, critics argue that the current tax system discourages business entities from organizing as taxable corporations and encourages corporations to veer from socially efficient decisions [10]. Also, lee young in his study of tax structure and economic emphasised on how tax policies affected a country’s growth rate and he concluded that that statutory corporate tax rates are significantly negatively correlated with cross- sectional differences in average economic growth rates [11]. In a similar study by Yayakeho on tax structure and economic growth in Coted’ivoire, it was established that tax variables except direct taxes and real GDP exhibit a long term and positive relationship [12]. They further demonstrated that there was bidirectional causality between tax revenues and output in the long run. In line with lee young’s conclusion Zimbabwe’s high tax burdens in the formal sector is resulting in the booming of informal sectors and hence a perpetuated decreasing revenue totals.
Table 1. GDP effect of corporate tax reforms.
company tax reform policy Low response Medium Response
tax_rate tax_base
increase in average growth rates, (2018-2028)
cumulative increase in GDP by 2028
change in steady state GDP
increase in average growth rates, (2018-2028)
culative increase in GDP by 2028
change in steady state GDP
35% cash flow 0.04 0.45% 78% 0.09 89% 155%
28% profit 0.11 1.09% 190% 0.21 215% 372%
28% cash flow 0.14 1.44% 250% 0.28 282% 487%
25% profit 0.15 1.55% 268% 0.3 303% 522%
25% cash flow 0.18 1.85% 321% 0.36 362% 622%
20% profit 0.23 2.30% 397% 0.44 447% 763%
20% cash flow 0.25 2.54% 438% 0.48 493% 839%
Source: Jensen, 2017 with author’s additional remarks.
These results show a modest to high impact of corporate tax reform on long-run GDP, depending on the elasticity chosen. During the transition path, GDP growth rates are higher than baseline, but in the long run, only the GDP level is higher and GDP growth rates converge back to the baseline GDP growth rates, assuming higher elasticityleads to greater estimated impacts from tax reform. All these mentioned methods were indeed successful but failed to provide a specific one-one variable analysis and they were more empirical. This paper however, examines the association between corporate tax and revenue totals at wider context in case of Zimbabweusinga simple logistic harvesting modeland a third-degree Lagrange polynomial (3lgp) estimation technique theoretically and empirically.
Source: Laffer (2004) with Author’s additional remarks.
Figure 1. Laffer curve illustration.
We aimed at producing a Laffer curve based on the idea propounded by Laffer [13], whose opinion holds that increasing the rate of corporate tax causes revenue to rise at first, then to fall, peaking at certain point. This curve shall be used in the results and comment section where our conclusions are centred on this function. In fact all our results did agree with the Laffer results which supported our paper relevance. Refer to the geometric approach in the result section and compare the graphs.
3. Overview of Revenue Movements in
Zimbabwe
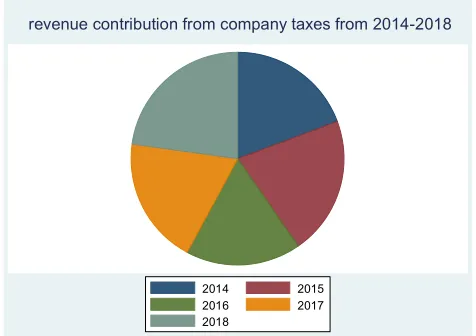
Notes on revenue movements in Zimbabwe specifically from Tax heads seem to notably exist. It is a common known thing that it rarely exists to find similar trending figures in the long run especially for economic variables like revenue. We shall present revenue contributions from different tax heads. We considered a period spanning from 2008 to 2018. See graphical representations below.
Source: Author’s remarks with ZIMRA guidelines.
Figure 2. Illustrative company tax Revenue productivity figures.
The graph is showing over time trends in the revenue contributions specifically from company taxes. The graph tried to demonstrate and to put on surface our conjecture of negative relations between company tax rates and revenue outcomes. We can safely see that we recorded high revenue outcomes where we had lower tax rates and true others and with the slight exception of the middle period where our tax rate seem to be constant.
Figure 3. Pie chart representation of revenue contributions.
4. Methodology
Literature suggest different methods and models used by different scholars in measuring the impacts of taxes on revenue productivity. But, linear regression models seem to be widely used. As well Ndedzu et al used a log linearized model to measure revenue productivity for Zimbabwe from tax heads [15]. The model is as,
= + + (1) Which gives:
= + + (2) After log transformation.
The model was used to estimate the revenue-tax buoyancy and elasticity. Other scholars such as macek used a multiple linear regression model to evaluate the impacts of tax heads on economic growth. Also models such as error correction models from granger theorem can be used to measure the impact of company taxes on revenue output. The simple ECM is as
= + + + + (3)
Which can be rearranged and simplified to give the increment in the response variable (revenue output) following changes in the explanatory variables (taxes such company tax). However, this paper took another angle to model revenue output sensitivity to taxes by considering company taxes only. To fully establish the effects of variations of corporate tax rates on revenue totals of Zimbabwe we used an extension of the simple logistic model similar to that used by [7]. The simple logistic model is denoted as,
= 1 − (4)
Our extended logistic harvesting model is as below,
= 1 − − ! (5)
Where,
R is the revenue available at time.
is the net revenue growth depending on the number of companies shutting down and the incoming registered ones.
K is the maximum revenue attained by the government from its taxed companies.
P is the corporate tax effort. Our model assumes that, revenue is in time series form, all other factors affecting revenue figures are held constant and the upper limit (k) for revenue is time independent that is it is constant.
Data
We used the annual data for both corporate tax rates and the corresponding revenue contributions for the period spanning from 2009 to 2017. The data was collected from ZIMRA and there were insignificant variations with data from other agencies, like ZIMSTAT hence a true representation of the actual picture of Zimbabwean corporate tax and revenue situation. However, our corporate tax rates data appeared to be barely dispersed suggesting insignificant changes done to the tax rate over the period. We used the data in percentages for analysis and to interpolate the Lagrange polynomial.
5. Findings
5.1. Quantitative Method
Using (5) above,
dr
dt = δr 1 −k − prr
There is no such a general way of solving this kind of an equation. However, we shall restrict ourselves to some special assumptions but they will venture in during the process. Now,
+
+, = − -− !
+
+, = ( − − !) +
( − − .) = +,
/ 01 + 1(1 − )2 + = / +, ℎ 4 , 1 = − !1
Which then results in,
= 6 7 (1 − )8 (6) Where 6 is an arbitrary constant.
Our solution above looks abstracted and it looks not easy to get a solution for r. So, we insert and empower our first assumption. Let δ = 1 a non-effect value, since δ is a small change in number of companies participating and shutting down and it lies in the range 0 ≤ ≤ 1. Then, it follows that.
= 61 7 − 6 7
2014 2015
2016 2017
2018
Finally, = ;7<=>
( ?;<=>) (7)
But 1 = − ! hence we have our final equation as,
=;(8 @)<?;<(ABC)>(ABC)> (8)
The value of from equation 5 at time , is the most interesting part which we shall use to evaluate the movement relationships between revenue " $ and tax effort "!$.
5.2. Qualitative Method
We first find the critical and stasis points of the equation and establish their stability which we use for our analysis.
+
+, 0
01 E2 ! 0
0 F4 - G" !$, ! :
We have two solutions for the value of revenue, these two values are affected by our tax effort p except for = 0. For
- H8" !$I3 4 ! : for viability. As ! J ∞, J 0
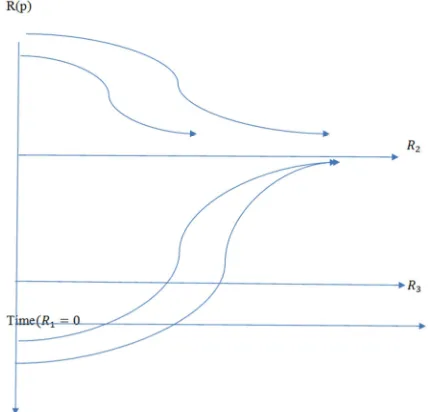
and the reversed limit order holds. Thus, suggesting the existence of an inverse relationship between corporate tax effort "!$ and revenue output " $. Below is a graphical establishment of and -.
Figure 4. Stability analysis of stasis values.
From figure 4, we see that the critical revenue value R_1=0 (which is on the horizontal axis) is considered an unstable point as the trajectories are moving away from it. This means that it is not possible for the government to get no revenue. R_3 is just an averaged revenue value which is neither stable nor unstable which helped us in our analysis. Further, R_2 is a stable critical revenue level since all the
trajectories are approaching the point. It entails that in the long run the government will be enjoying that level of revenue ceteris paribus.
5.3. Geometric Approach
Geometric analysis is all based on graphical reasoning and here we will be looking at changes in revenue, r following changes in the tax effort, p.
From our model, 0,
01 E2 ! 0
! 01 E2
We now use ! L + 1 to plot the
effects of a varying corporate tax and revenue output. Where is the resultant revenue after varying our tax effort (p) and r is the current revenue before. The function is presented graphically as below.
Figure 5. The geometric representation of three functions, with three distinct and separate points of intersection defined uniquely and with different meanings. We have points labelled a, b and c representing revenue levels R_0, R_1 and R_2following changes in the tax effort, P_0, P_1 and P_3 respectively. Y_1andY_2are both resultant shifts of the function R_t depending on the movement of company tax rate (p). See results section below.
6. Overall Analysis
Quantitatively, using our derived function for revenue, r, to determine the effects of corporate tax on revenue, we find the limit of revenue, r, as company tax rate grows larger. We used a direct approach that is direct plug in the approached value for p. The procedure is as:
Lim
Q→P
6( − !) (8 @)
1 + 6 (8 @)
Lim
@→P6∞ P
1 + 6 P
From the calculus of exponential functions, we get:
lim
@→P
0 1 + 0 = 0
Hence, as ! increases our revenue, decreases.
From the qualitative approach, we have two different critical values for our revenue possibly gained by the government. = 0 means no revenue at all, however from the analysis it is an unstable level in the longrun, indicating its impossibility. It also means that the tax rate value has no effect on that value since it is not significant. Whether the government increases or reduces the corporate tax rate, non-are the chances of getting no revenue. This is because per every 10 registered companies in the informal sector 90% of them pays the tax, except those shutting down, therefore there are no cases of getting no corporate tax revenue. Also, we have - which depends sorely on the tax effort. If the government increases its tax effort,!then it is more likely to get low revenue, reasons being failure of some firms to balance off the rate and the profits possibly made. On the other hand, if it reduces the rate then more revenue is likely to be harvested as the companies will be able to manage and to handle the burden. From the analysis in fig we deduced that - is a stable point in the long term, but its stability depends on the value of!, the tax effort. It is more likely to be stable if the tax effort is kept invariant from time to time.
Geometrically, we have L, S, and T as our points of intersection indicating the revenue levels to the government following the agreed corporate tax effort. is representing the revenue to the government given the initial tax rate. . Now if the government increases its tax effort or rate to .-, we have an upward shift of the curve = ! to intersecting at S giving a reduced revenue level from to
-. Also, if the government reduces its tax effort to . we have a downward shift of the curve = ! to -intersecting at c giving an increased revenue level from
,F .
Analytically, all the approaches used on the model seem to suggest the same and tend to move in one direction. It has been shown that as ! our corporate tax effort increases the revenue totals often decreases ceteris paribus.
Model limitations
Nothing can be as good as to be totally good. Despite the ability of our model on analysing the effects of corporate tax rate on revenue the model bears a number of considerable limitations. Firstly, the model is non-linear hence estimation of parameters is not easy. The reason being the inconveniences created for the statistical applications. In addition, the model lacks coverage. It only considers one factor at time. In reality given any dependent variable, its behaviour highly depends on a number of explanatory factors. Contextually, it is not only company tax rate that
determines the level of revenue disposed to the government. Tax rate can be lowered but still experiencing a lower revenue contribution. The model is based on some rigid assumptions. This means the model success in use rest on the effectiveness and validity of the assumptions used.
7. Lagrange Polynomial Estimation
Model
Weused the lagrange polynomial to estimate the corporate tax revenue of the government in zimbabwe. We used the polynomial of third degree. We only used a standardised sample data from 2014 to 2017, so we constructed the lagrange polynomial of degree three to use it to estimate the future corporate tax revenue contribution. the polynomial is as follows.
Table 2. For corporate tax rate and revenue.
P 0 10 25 20
R (p) 10 15 12 20
Here p values are representing different corporate tax rates by the government and (!) is a function representing values of the percentage revenue corresponding to the tax rate, p.
U(!) = ∑ (!)
Where,
(!) = WYX (@ @@ @ZZ)
=(! − 10)(! − 25)(! − 20)(0 − 10)(0 − 25)(0 − 20)
=−!Y+ 55!-5000− 950! + 5000
=(10 − 0)(10 − 25)(10 − 20)(! − 0)(! − 25)(! − 20)
!Y− 45!-+ 500!
1500
-=(25 − 0)(25 − 10)(25 − 20)(! − 0)(! − 10)(! − 20)
!Y− 30!-+ 200!
1875
Y=(20 − 0)(20 − 10)(20 − 25)(! − 0)(! − 10)(! − 25)
−!Y+ 35!-− 250!
1000
Whence,
U(!) = ∑ (!)
U"!$ a@
b?- @c aad@? -d
-d (9)
7.1. Polynomial Validation and Diagnostics.
For validation of our polynomial we used the mean
absolute percentage error defined as, e6.f gh h|h |^g× U
where n is the sampling units, l L +l^ are for the actual and estimated revenue outputs respectively. The formula
represents the distance between the actual data and the predicted. Interestingly, if the distance is less than 10 then the fit and the predicted performance is accepted. We used our collected data for the specified above period though it seems to be not normally distributed. Wemanuallyperformed our predictions and as well calculate our MAPE values. See summary table below.
Table 3. Summary of Lagrange polynomial.
Time period Corporate tax rate (%) Actual revenue (%) Estimated revenue (%) Mean absolute percentage error (mape) (%)
2009 30.9 111 86.029 2.499
2010 25.75 111 90.1849 2.084
2011 25.75 111 90.1849 2.084
2012 25.75 114 90.1849 2.321
2013 25.75 112 90.1849 2.164
2014 25.75 111 90.1849 2.084
2015 25.75 112 90.1849 2.164
2016 25.75 110 90.1849 2.002
2017 25 111 88 2.302
The table above clearly shows that our (mape) values are all less than 10 margins of error hence suggesting that the lagrange polynomial can be better used for prediction. However, it should not be used alone if the government is keen to make vibrant decisions implying that its significance is highly realised if fused with other techniques.
7.2. Why Not 100% Company Tax Revenue Output in Zimbabwe
Revenue totals for Zimbabwe are normally falling below the expected. This is being stimulated by a number of factors operating in the economy. Here we pointed out three main causes of a decreasing revenues in Zimbabwe. These points out to be inefficiency of government officials, booming corruption levels and dominance of the underground economies in Zimbabwe. We shall explain these separately as follows.
7.2.1. Corruption
The inevitability of corruption in Zimbabwe has become tremendous up to the extent of stunting the growth and well-being of our firms both formal and informal. Adam Smith wrote about the basis of free market economies as being self interest. This has however, dominated and is quite becoming a mislead to our present day economic agents. People are mainly considering themselves instead of a nation as one. And this is ending in some laws and some policies being breached and neglected. Similarly, Across all sectors, corruption is a very high risk for companies operating in Zimbabwe. Investors face both high-level corruption in the form of nepotism, patronage and abuse of power, as well as petty bribery and extortion. Formally corruption is generally understood as the abuse of public power for private gain and also as the abuse of public office for private gain [24]. The last definition best describes our case in Zimbabwe. Zimbabwe is a country whose revenue sources are mainly tax defined and thee revenues are collected by selected officials.
It is only surprising that the revenue to be collected for national use is sometimes considered a private issue. It is well known that firms especially those from private sector do try by all ways to avoid tax, commonly termed tax avoidance and some officials are being found striking deals with such firms for their benefit and the tax bearer. This is commonly done through a payment of invisible and non-receipted money called (Chiokomuhomwe). This is really killing and destroying the economy of Zimbabwe. As a result we are finding our totals failing to beat the past figures as only a few is being formally collected. We have three types of corruption which are Bribery, Fraud, Nepotism / Favouritism, Abuse of power and Extortion. All of them appear to be practised in Zimbabwe across almost all areas with the same motive of self interest. These should not by any chance entertained to ensure smooth revenue flows and harvests.
7.2.2. Underground Economies
few will be collected and consequently insignificant revenue outcomes will be realised in the form of corporate tax revenue. Therefore, it will be spurious to think of 100% or more revenue from company taxes, unless if the government can widen its tax base enough. Therefore, this can be dealt with, by setting up a favourable tax rate and by widening tax base and by posing issues to reduce the extension and further existence of underground economies by using price controls, special officials such as police, only for regulation purposes, although this has its own consequences as explained in the subject corruption above.
7.2.3. Inefficiency
Government agents who are the for the collection of tax revenue do present some weak traits in terms of revenue collection and tax law enforcement. Inefficiency is harmful and should be avoided as it may retard revenue potential harvest growth. Long chains of command together with unreliable information sources do lead to a limited revenue harvest. In Zimbabwe, we are facing a tremendous challenge of information asymmetry within the economy. We are finding that some individuals are not even able to access information related to their tax payment mandates and the possible procedures including dates, rates and times. Revenue collection officials should make it a firsthand priority to spread and to reach out all the mandated groups in the economy with the right information concerning the tax payments. Some groups or individuals who are located in remote areas from the main agents may fail to adhere with tax payment requirements only because of lack of adequate information and knowledge. The agents should carefully find time to explain to all who should pay tax for clarity sake. This includes all procedural clarifications including all additional requirements to that of getting registered first. Long chains of command should not be pursued as they may long up the time taken by information to reach its intended audience in time. once we are done with bureaucracy and imperfect information flow channels, tax payments by all the required will be easy and mostly better revenue outcomes will be recorded with a better harvesting coefficient. These are some of the highly contesting reasons behind stunted revenue totals mainly from companies and even from individuals. Other trace reasons are available and also should not be tolerated and entertained as they may be troublesome and may also corrode the potential revenue avenues.
8. Discussions
From our research, we see that revenue and corporate tax rate are inversely related. That is an increase in government corporate tax effort is associated with a fall in total corporate tax revenue contribution and true the other way. If the government want to increase the contribution of corporate tax revue to its totals, it should apply an effort that is neither too high nor too low. This is to allow companies work efficiently and to allow more firms enter the market. Therefore, we recommend the government of Zimbabwe to lower its
corporate tax to the informal companies so as to boost its revenue. However, for effective fiscal return, the Zimbabwean government has also to consider other factors such as number of registered firms in the informal sector despite its shadowiness. Also, there is need to estimate first, the likely revenue to be earned, by using the Lagrange polynomial. This is helpful especially when considering the appropriate and healthy tax rate to impose. However, the tax rate should not be under set that is it should not be too low. The more healthy and reasonable company tax rate happened to be 20% which is 5% lower than that prevailing in Zimbabwe. Also, the government should not consider tax effort alone when explaining revenue falls. Other factors such as government expenditures, corruption levels, economic recessions and slowdowns, bureaucracy and inefficiency combined with imperfect information in all economic zones should not be considered. Further, it means that the tax rate can be lowered but still experiencing lower revenue totals. But, this paper looked at company tax effects on revenue using mathematical modelling only, implying that there is enough room for research on the subject.
We have a number of mathematical applications especially in the finance, business and economics field. With respect to these fields we apply our mathematics to solve related problems that may be of significant interest. In this note we aimed to highlight some mathematical applications for some scenarios. Specifically we used differential equation modelling techniques to generalise and to make some sounding inferences about the case problems.
9. Conclusions
This paper managed to provide an unique way of assessing the impacts of variable corporate tax rates on revenue totals of Zimbabwe. We used a logistic harvesting model with a variable harvesting factor. Despite the fact that, increases in tax rates results in a larger revenue harvest, our paper managed only to agree with the results of the study [13]. We discovered that there is an inverse relationship between company tax rate and revenue totals to the government. We therefore, recommend government officials to use a healthy company tax rate and as well for all its tax heads. To support our recommendation, we proposed a mathematical estimation framework. We proposed the use of a Lagrange polynomial to estimate a healthy tax rate to apply so as to ensure a better tax revenue harvest by government officials and policymakers.
References
[1] Aamir m, butt s, hussain s, khan ki, nasir a, qayyum a. Determinants of tax revenue: a comparative study of direct taxes and indirect taxes of pakistan and india. Vol 2 no. 19 (special issue-october 2011).
[3] Aamir m, butt s, hussain s, khan ki, nasir a, qayyum a. Determinants of tax revenue: a comparative study of direct taxes and indirect taxes of pakistan and india. Vol 2 no. 19 (special issue-october 2011).
[4] Karas, m.: tax rate to maximize the revenue: laffer curve for the czech republic. Actauniv. Agric. Etsilvic. Mendel. Brun., 2012, lx, no. 4, pp. 189–194.
[5] Romer, c and romer, d. (2010). The macro-economic effects of tax changes: estimated based on a new measure of fiscal shocks. American economic review, 100 (3), 763-801. [6] Ferede, e., dahlby, b. (2012). The impact of tax cuts on
economic growth: evidence from the canadian provinces. National tax journal, 65 (3), 563-594.
[7] Ausubel, jh, meyer ps. Carrying capacity, a model with logistically varying limits. Technological forecasting and social change 1999; 61: 209-214.
[8] Musgrave. R. And musgrave p. (1980). Public finance in theory and practice, (3rd edition). Tokyo: mcgraw-hill co. [9] Mashkoor. Massod (2010). “tax revenue and economic
growth: an empirical analysis for pakistan”. World applied sciences journal 10 (11) pp- 1283-1289.
[10] Scholes, ms.; wolfson, ma. Erickson, mm; maydew, el.; and shevlin. Ausubel, jh, yungjw, meyer ps. A primer on logistic growth and substitution. Technological forecasting and social change 1999; 61: 247-271.
[11] Lee. Y., and gordon. R. H. "tax structure and economic growth." journal of public economics, vol. 89. Issues 5-6, 2005, pp. 1027-43.
[12] yayakeho (2011). ‘tax structure and economic growth in cote d’ ivoire: are some taxes better than others?” Asian economic and financial review vol. I, no. 4, pp. 226-235.
[13] Laffer, a. B., 2004: the laffer curve: past, present, and future.
[cit. 2011-10-19]. Cited from
http://www.heritage.org/research/reports/2004/06/thelaffer-curve-past-present-and-future.
[14] Oecd, (1996). Definition of taxes, daffe/mai/eg2 (96) 3. [15] Ndedzu, d, macheka, m. Mavesere, i, zivengwa, t. Revenue
productivity of zimbabwe’s tax system, issn: 2186-8492, vol 2 no 4 (2013).
[16] Gerald ea, edwardhr (1976). A general model for state tax revenue analysis vol 29, no 4 (1976) pp. (422-435).
[17] Dixon jm, nassios j. Modelling the impacts of a cut in company tax in australia. No g206 2016.
[18] Kalas b, mirovic v, andrasic j. Estimating the impacts of taxes on the economic growth in the united states (2017) 55 (4): 481-499.
[19] Jensen, m, mathur, a, kallen, c. (2017). Analysing the link between corporate tax, investment and GDP (online). Available at www.aei.org/publication/analysing the link between corporate tax, investment, GDP.
[20] “taxes and business strategy, a planning approach,” prentice-hall, upper saddle river, nj.
[21] Diprimarc, williameb (2001) elementary differential equations and boundary value problems. Usa: john wiley and sons. inc. [22] Suli e, meyers d. (2003) an introduction to numerical analysis.
Cape town: cambridge university press.
[23] Suyono, e and yi, f. (2014) the relationship between tax revenue and economic growth of hebei province based on the tax multiplier effect. Vol. 7. No. 2. September 2014. Pp. 1 – 18.