The level of physical and social skills after completion of the training program
for children aged 9–11
Lucie Francová*
Department of Physical Education and Sports, University of Pardubice, Pardubice, Czech Republic
Copyright: © 2014 L. Francová. This is an open access article licensed under the Creative Commons Attribution License (http:// creativecommons.org/licenses/by/4.0/).
Objective: The objective of the study was to determine changes in physical and social indicators in participants of a table tennis training program lasting 10 months. Physical and social indicators were compared within two different research groups. Methods: Two research groups were created. The first one comprised beginners with intellectual disabilities and the reference group was created by non-disabled participants. Altogether 15 participants, aged 9–11, were included in each group. A pre-test was introduced at the beginning of the study and was followed by a post-test 10 months later. Physical parameters were evaluated with the help of individual skills post-tests designed for table tennis. The area of social indicators was determined according to the Scales for Assessing Coping Skills by Whelan and Speake (1979). Results: As far as physical indicators (e.g. individual skills used in table tennis) are concerned, individuals with intellectual disabilities improved by 24.5%. The improvement of non-disabled population reached 11%. Positive changes in social indicators, which include self-help socio-educational issues and interpersonal skills, were seen in individuals with intellectual disabilities – the improvement reached 7%; whereas the improvement in non-disabled participants was only 2%. The obtained results were evaluated separately for each group, due to the default level in pre-tests. Having compared the two groups we learnt that individuals with intellectual disabilities reached on average 63% of the non-disabled participants. Conclusions: The training programme has brought positive changes into the lives of individuals with intellectual disabilities in all of the studied parameters, social and physical skills included. In accord with our comparative findings it has been recommended to reduce sport demands to the observed level. Also, a number, of methodological skills required for table tennis, has been modified in accordance with our findings. Based on the results a set of games and exercises customized to the needs of the intellectually disabled individuals has been created. Within the study, we also transformed The Scales for Assessing Coping Skills by Whelan and Speake (1979) from English into Czech language. The transformed scale was used in both groups. The results of this study demonstrated positive development of social indicators within all of the selected areas in the group of children with intellectual disabilities. The whole study has confirmed the importance of physical activity for children in younger school age.
Keywords: intellectual disability, non-disabled population, table tennis, quantitative testing, training process
whether at home, at work or in free time. An approach towards society, environment, and the human being itself and provision of physical activity should be evalu-ated and taken into consideration. This study identifies the importance and influence of regular physical activ-ity on selected areas of personalactiv-ity and should thus lead to an increased interest.
After 1989, sports opportunities in the Czech Republic began to spread not only to the non-disabled population, but also to people with disabilities. Sports for people with intellectual disabilities are organized by the Czech Special Olympics Movement (ČHSO) and the international level is overseen by the commit-tee of Special Olympics International (SOI). Another
Introduction
Currently, the impact of sports is the subject of many studies. Based on Hardman’s (2005) project “Sport for all”, sport should be independent of age or sport level. He emphasizes focus on marginalized groups and not solely on selected groups. Blair (2005), as well as Hard-man, also sees the need for physical activities being incorporated to the daily activities of modern society
very important organization involved in holding sports activities for individuals with intellectual disabilities is the Czech Association for Athletes with Intellectual Disabilities (CSMPS). At the international level the organization is the International Sports Federation for Persons with Intellectual Disabilities (Inas).
Table tennis is one of the most popular sports in the Czech Republic and is included in competitions held by ČHSO and CSMPS. CSMPS organizes regional championships and table tennis is the only one out of 13 sports which holds competitions in 8 regions of the Czech Republic. Each regional championship has about 30–80 athletes, the best players are nominated to the national championships. As far as other sports are concerned there are either none or up to 6 regional competitions organized each year.
There are no age restrictions for playing table ten-nis. Table tennis may be played by all – children, adults and people with various types of disabilities at both recreational and competitive levels. This sport requires a relatively small amount of equipment and also the playing environment is easy to implement. In com-parison with tennis, cycling, and skiing table tennis has lower financial requirements. Also, table tennis needs less space for training in comparison with for instance basketball, swimming, floor ball or football. It may be played in smaller areas without a large gym and does not increase costs for rent.
Competitions held at all levels (e.g. in sporting clubs, regional, national, and international competi-tions) prove general accessibility of table tennis. Table tennis players (either with or without disabilities) take part in World and European Championships, and Olympic games [e.g. Paralympics, Deaflympics or Global Games (GG)] – the Czech Republic sent 5 rep-resentatives to the last GG held in the Czech Repub-lic in 2009 and 3 representatives participated in the last Open European Championships in France 2012. Czech female representatives won bronze medals in two out of three competitions.
A systematic training of athletes with intellectual disabilities at higher levels does not exist in the Czech Republic. Currently there is neither much literature nor any appropriate methodology available in this field. The main problem is the lack of physical activ-ity of children and adolescents with intellectual dis-abilities; they are typically less able-bodied than their non-disabled peers. Fernhall et al. (1996) examined physical fitness in persons with intellectual disabili-ties and reported on the potential health risks posed by physical inactivity within this population. Results indicated that individuals with intellectual disabilities experienced deficiencies in all areas of physical fitness. Robertson et al. (2000) identified that the significant
physical inactivity among persons with intellectual disabilities predisposes them to greater health risks (related to overweight and obesity) in contrast to their non-disabled peers. It is estimated that individuals with disabilities compared to their peers are less involved in physical activities and games (Longmuir & Bar-Or, 2000). Válková (2007), who conducted the research project concerning the assessment of various types of daily leisure activities of 266 residents in the Czech Republic, documented that male adults (174 out of 266) spent only 4% of total hours per week (7 days) by monitored physical exercises and sports, whereas female adults (92 out of 266) only 3.5% in the same period.
This work should provide some current information concerning the issue and inspire educators and trainers working with individuals with intellectual disabilities. This study builds on many years of work with the intellectually handicapped and the previous work of Lukáčová (1998, 2005).
Methods
Research groups
Two research groups were created for the purpose of research:
1. The research group comprising non-disabled individuals For the purpose of the study table tennis sport clubs in Hradec Králové led by qualified coaches willing to participate were approached. These sport clubs met the requirements to form a group comparable to individu-als with intellectual disabilities. Eventually, age-homo-geneous children (the average age 10.07), 12 boys and 3 girls, from two sport clubs in Hradec Králové (SK Stěžery and DTJ Hradec Králové) were included in the study. After the agreement of both coaches had been ensured, pre-tests were performed in 20 children. As 10 children is an optimal number for one training les-son provided there are 4–5 tables available, 10 children were chosen from each club. Post-tests were performed 10 month later, only 15 children were included due to the fact that 5 children had begun to attend another activity during the school year. Children could join the research group upon two conditions, e.g. age between 9 and 11 and minimal experience with table tennis. The selected group of 15 non-disabled children consisted of pupils from primary schools who voluntarily attended table tennis lessons within their leisure activities.
2. The research group comprising individuals with intel-lectual disabilities
who are being educated in the curriculum of special elementary school. The research group was age-homogeneous with children from 9 to 11 (the average age was 10) and suffered from mild mental retarda-tion. Altogether 11 boys and 4 girls from the Special elementary school and practical school in Hradec Králové were included in the study. The school offers a wide range of leisure activities including table ten-nis. All the participants were members of the school Table tennis club which is offered as a leisure activity within the school. Consistent with the first research group a training group of 11 children (9–11years) was made and pre-tests were performed. Facing problems with correct numbers of pupils under research we were forced to create the second training group in the follow-ing school year (reasons are mentioned in the restric-tions). An additional 10 children had to be summoned; four of them stopped attending the activity and two of them had a very irregular attendance, therefore six chil-dren had to be excluded from the study. The remain-ing 15 children from both groups formed the required research group. The trainings were led by a qualified and experienced coach with a license B, who was at the same time working as a special education teacher and an assistant teacher.
Parents of all the children involved in the study had attended an informational meeting before the training program started. They were informed about the course of our study, and their written consent was obtained.
Training programme
The training program was practised 2 times a week for 90 minutes for a period of 10 months. Output test-ing was carried out after completion of approximately 80 training lessons.
Structure of one training lesson (90 minutes): 1. Introduction (3 minutes) – organizational issues,
checking pupils.
2. Warm up (5 minutes) – for instance running for-ward, backfor-ward, and walking.
3. Stretching exercises (10 minutes). 4. The main part:
• special warm up (5 minutes) – the movement behind the table,
• training and improvement of strokes (40 min-utes) – explanation, technique correction, sim-ple game combinations,
• training matches (10 minutes).
5. Games (10 minutes) – e.g. catch me with a ball, relays.
6. Conclusion (7 minutes) – stretching and evaluation.
Methods for collecting data
Selected indicators (motor and social) were used for the study.
1. Physical indicators – the level of individual table tennis skills
In order to detect the development of motor skills quantitative testing was applied. Standardized tests of individual table tennis skills, used and recommended the Czech Special Olympics Movement (ČHSO) were selected for the study. Individual skill tests were certi-fied in the Czech Republic by Schicklová (2003). The tests contained the following skills:
• Hand dribbling, dribbling the table tennis ball onto the table within the time limit of 30 seconds. Both hands could be used. In case of the ball loss a differ-ent one was passed and the test continued without any time interruption, stroke counting continued, too. Every single hand stroke counted as a point. The minimum or maximum limit of bounces was not given.
• Dribbling by a paddle, dribbling was done only on one side of the paddle. Rules correspond to the pre-vious test.
• Forehand, the person being tested was trying to play the forehand. The ball had to be played fore-handed and land on the opposite side of the table each properly executed return of the ball counted as one point; a maximum of 25 points were possible. • Backhand, the person being tested was trying to
play the backhand. Rules correspond to the previ-ous test.
• Service, 5 times from the right side (forehand vice) and 5 times from the left side (backhand ser-vice). Service had to be carried out according to the rules of table tennis. Each properly executed service counted as one point; a maximum of 10 points were possible.
2. Social indicators – the level of social skills
A questionnaire called the Scales for Assessing Coping Skills (Whelan & Speake, 1999) was used to detect the development of social skills. The Scales gave us their permission to use and transform it into Czech language. The permission was obtained with the help of PhDr. Dana Štěrbová, Ph.D. The principle of translation-retranslation (Banville, Desrosiers, & Genert-Volet, 2000) was used for the transformation of the question-naire. This principle determines the subsequent steps: 1. To verify the origin of the original text.
2. To sum up the semantic units in the original language.
4. To review and compare the consensus between the original text and the translator.
5. To build a pilot version of the text in Czech language. 6. To organize a pilot study.
7. To edit the text with notes from a pilot study. 8. To retranslate back to English.
The final Czech version of the text was assigned to three additional translators with the aim to retranslate the text back to English. The resulting text was com-pared again and semantic units from both the original and translated texts were summarized. The new version has been proven valid because in accordance with the APA (American Psychology Association) recommen-dation the difference of semantic units in the resulting text should not exceed 15%. The new version may be used from now on.
The assessment, the Scales for Assessing Coping Skills, was designed for parents and experts working with the intellectually handicapped. The Scales for Assessing Coping Skills was published by Whelan and Speake (1979) in the book “Learning to cope”. A part of our work was to translate the evaluation scale. Both, the original Scales for Assessing Coping Skills and its translation into the Czech language are a separate part of the work.
The content of the rating scale has been thoroughly investigated and the items are divided into areas of knowledge and skills most important for life in the society. Involved individuals were advised to monitor their behaviour again and to compare their own obser-vations with the observation of someone else.
The entire rating scale consists of 3 areas:
1. The self-help, the level of mastering self-care. It includes hygiene habits, taking care of grooming, clothing, household chores, eating habits, commut-ing and shoppcommut-ing. The points that may be achieved within the study are in the range of 90 to 270 points. 2. The socio-educational level summarizes the
knowl-edge and skills within the educational process and includes communication skills of elementary trivia, orientation in time, handling financial issues and knowledge of colours. The observed levels may vary from 50 to 150 points.
3. The area of interpersonal relations covers com-munication and basic social rules and principles, personal information, friendship, leisure time, sex-ual knowledge, responsibility, and ability to make phone calls. The observed levels may vary from 45 to 135 points.
Furthermore, the rating scale is divided into 36 sub-areas which are further divided into 5 separate items.
Each item reflects the level of difficulty (from the easi-est to the most difficult in the range of a–e).
Completing the questionnaire is accomplished by simple ticking boxes presenting opposite levels.
Data processing
Measuring was processed in two separate steps: • overview of the frequency in given area,
• group comparison – the results were displayed in tables and graphs using Microsoft Excel (Version 2010; Microsoft, Redmond, WA, USA) and SPSS (Version 7.5; IBM, Armonk, NY, USA).
For comparison the following quantities were obtained – mean, standard deviation, difference, the first interval of normal distribution and the level of sta-tistical significance (stasta-tistically significant values are in bold, p < .05). Differences between the correspond-ing variables in the groups were used uscorrespond-ing the non-parametric test – Wilcoxon Signed Rank Test. For data processing the statistical system of SPSS 7.5 was used.
Due to the lower number of individuals in the research groups, statistical analysis is provided solely as supporting material. The small number of indi-viduals in the research groups allowed us to focus on individuals who are out of 1st interval of the normal distribution.
The main interpretation of the results was based on the logical analysis in accordance with the opinions of experts who had expressed their views on progress of individuals in monitored areas in percentage. Based on the obtained data the expert opinion on the issue was defined and the expected range of individuals with intel-lectual disabilities in selected areas was determined.
Dating of the research
It has been divided into two phases, the following actions took place in the first phase:
1. Research files creation. Consultations and discus-sions with the participating coaches and special education teachers (summer 2009).
2. Pre-tests – both groups were tested at the beginning of a school year (September 2009, 2010).
3. Forms concerning the assessment of the social skills’ level were distributed (September 2009, 2010).
4. Processing of the results.
The following actions took place in the second phase:
5. Realization of the training program (2009–2011). 6. Post-test – both groups were tested after ten months
7. Forms regarding the assessment of coping skills were distributed (June 2010–2011).
8. Treatment of results (2011–2012). 9. Evaluation of findings (2012).
Limits
Due to the limited possibility to establish a sufficient number of individuals with intellectual disabilities will-ing to train under qualified coaches, the research was conducted only on a narrow sample. The first factor that had greatly influenced the creation was the age restriction, e.g. the age from 9 to 11. Secondly, num-ber of primary school-age children in the special edu-cational program within one school is rather limited. Finally, the research had been conducted within leisure time activities, which was another complicating factor. Some children had not completed the training program and therefore we were forced to create additional group.
Demarcation
All the participating individuals (with or without dis-ability) had to be beginners in table tennis.
Results
Area of physical indicators in individuals with intellec-tual disabilities
Obtained results in the time span of 10 months showed that a group of children with intellectual disabilities had improved in all skills after the completion of regu-lar training process.
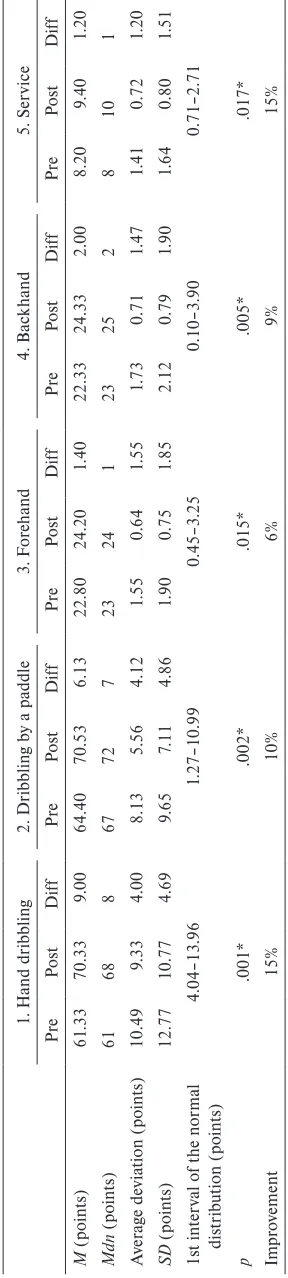
The range for improvement in all tests of individual skills was 13–48%; the average improvement was 24.2%. The improvements in tests may be specifically seen by looking at the difference between the average figures of the pre-test and post-test. This difference was converted to the percentage value where the result obtained in the pre-test equals 100%. The smallest improvement of 13% may be seen in the test 4 – back-hand. A significant improvement of 16 and 22% may be found in the tests 1 to 3. The greatest progress of 48% may be found in test 5 – service. Assessing the level of statistical significance the values of .001 were achieved, hence the statistical significance of the tests was confirmed.
Area of physical indicators in non-disabled individuals The results of children from non-disabled population correspond in many ways with a group of children with intellectual disabilities. An improvement in all mea-sured skills was achieved.
The range for improvement in all tests was from 6–15%, the average improvement was 11%. The
improvement in the tests is especially obvious from the difference between the average figures of the pre-test and post-test, this difference was converted to per-centage value and the result obtained in the pre-test equals 100%. The smallest improvement of 6% was in test 3 – forehand. A slight improvement of 9 and 10% may be found in the tests 2 and 4 – paddle dribbling and backhand. The greatest, 15%, progress was mea-sured in the test 1 and 5 – hand dribbling and service. While evaluating the level of statistical significance for all tests, lower p-value < .05 was found, hence the statis-tical significance of these tests was confirmed.
Comparison of the physical parameters
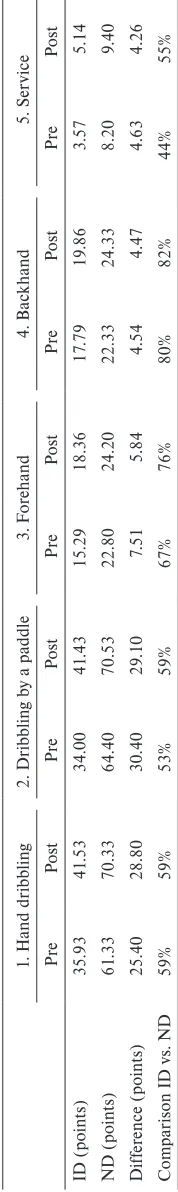
We expected the level of individual skills of partici-pants with intellectual disabilities to oscillate within the range of 40 to 70% with regard to the non-disabled population. Our aim was to confirm the claim of Win-nick (2000) under Czech conditions.
Individuals with intellectual disabilities made 44–80% progress in table tennis individual skills dur-ing the pre-test with a slight increase in the post-test (55–82%) compared to the non-disabled population.
Individual tests of table tennis skills have been independently analysed and they are available from the author of this work. Specifically, the results of all participants in the research study are presented. Not only the individual progress is evident here, but also the differences in both research groups.
Area of social indicators among individuals with intel-lectual disabilities
Prior to the training program the parents had filled in study questionnaires so that the level of social skills of the participating children could be determined. After completing the training program the same ques-tionnaires were re-distributed to the families so that changes in the level of social skills could be detected. The results in the Table 4 describe gained values in the initial evaluation of social skills and subsequently performed final evaluation. The group of children with intellectual disabilities improved in all measured skills.
The improvement range in all areas of social skills was 6–7%. The improvement in individual areas specifi-cally illustrates the difference between the pre-test and the post-test, this difference is converted to a percent-age value and the result obtained in the pre-test is set as the 100% value. The questionnaire is divided into three areas which describe three separate categories of social skills (self-help, socio-educational and interpersonal relations). Each area was evaluated separately.
Table 1 Table t ennis t es t r esult s r eg ar din g indi vidual s
kills in a g
roup of c
hildr en w ith int ellec tual dis abilitie s 1. H and dr ibblin g 2. Dr ibblin g b
y a paddle
3. F or ehand 4. Bac khand 5. Ser vice Pre Po st Dif f Pre Po st Dif f Pre Po st Dif f Pre Po st Dif f Pre Po st Dif f M (point s) 35 .93 41 .53 5.60 32 .80 40 .00 7.20 14 .80 18.07 3.27 17 .53 19 .73 2.20 3.33 4.93 1.60 Mdn (point s) 39 41 7 37 45 7 16 19 3 19 20 1 3 5 2 A ver ag e de via tion (point s) 10 .22 11 .24 2.35 13 .15 12 .67 1.55 4.08 2.46 1.92 2.96 1.69 1.55 1.82 1.28 0.83 SD (point s) 11 .90 12 .98 2.73 14 .19 14 .08 1.94 4.58 3.13 2.32 3.58 2.43 1.72 2.05 1.61 1.02 1s t int er
val of t
he nor mal dis tr ibut ion (point s) 2.87–8.33 5.26–9 .14 0.95–5 .59 0.48–3 .92 0.58–2 .62 p .001* .001* .001* .001* .001* Im pr ov ement 16% 22% 22% 13% 48% No te . Pr
e = pr
et
es
t, P
os
t = pos
tt
es
t, Dif
f = dif
fer ence be tw een pos tt es
t and pr
et es t. * s ta tis tic all y si gnif ic ant a t p < .05
Table 2 Table t
ennis t es t r esult s r eg ar din g indi vidual s
kills in non-dis
abled indi viduals 1. H and dr ibblin g 2. Dr ibblin g b
y a paddle
3. F or ehand 4. Bac khand 5. Ser vice Pre Po st Dif f Pre Po st Dif f Pre Po st Dif f Pre Po st Dif f Pre Po st Dif f M (point s) 61 .33 70 .33 9.00 64 .40 70 .53 6.13 22 .80 24 .20 1.40 22 .33 24 .33 2.00 8.20 9.40 1.20 Mdn (point s) 61 68 8 67 72 7 23 24 1 23 25 2 8 10 1 A ver ag e de via tion (point s) 10 .49 9.33 4.00 8.13 5.56 4.12 1.55 0.64 1.55 1.73 0.71 1.47 1.41 0.72 1.20 SD (point s) 12 .77 10 .77 4.69 9.65 7.11 4.86 1.90 0.75 1.85 2.12 0.79 1.90 1.64 0.80 1.51 1s t int er
val of t
he nor mal dis tr ibut ion (point s) 4.04–13 .96 1.27–10 .99 0.45–3 .25 0.10–3 .90 0.71–2 .71 p .001* .002* .015* .005* .017* Im pr ov ement 15% 10% 6% 9% 15% No te . Pr
e = pr
et
es
t, P
os
t = pos
tt
es
t, Dif
f = dif
fer ence be tw een pos tt es
t and pr
skills. The individuals with intellectual disabilities achieved improvement of 6%.
More significant progress was reflected in the self-help and interpersonal areas, where individuals with intellectual disabilities had improved by 7%. In terms of the statistical significance the value .001 in each area was achieved. This result confirmed the statistical significance.
An interesting finding was that a repeated measure-ment after 10 months of the regular training program reclassified, in the self-help area, three individuals to a higher assessment category (two individuals from the category requiring assistance to the self-help cat-egory and one from the mismanagement catcat-egory to the requiring assistance category). One individual was transferred to a higher assessment category in socio-educational area, from the category requiring assistance to the self-help category. In the area of inter-personal relations two individuals were classified to a higher category (from the category requiring assistance to the category without assistance). These results could be perceived as highly beneficial for the individuals.
Area of social indicators among individuals of non-dis-abled population
In the group of children chosen from non-disabled population the improvement in all measured skills was allocated.
Minimal improvement in the range of 1–2% can be observed. The improvement in individual survey areas is documented by the difference between the pre-test and post-test. The difference is converted to the per-centage value and the result obtained in the pre-test is set as the 100% value.
The children of the non-disabled population achieved the improvement of 2% in self-help area. In the socio-educational area the results were only about 1%. Regarding the interpersonal area the children of the non-disabled population improved by 2%. In terms of the statistical significance the value of .011 was set and this confirms the significance. The values of results in the areas 2 and 3 are not statistically significant.
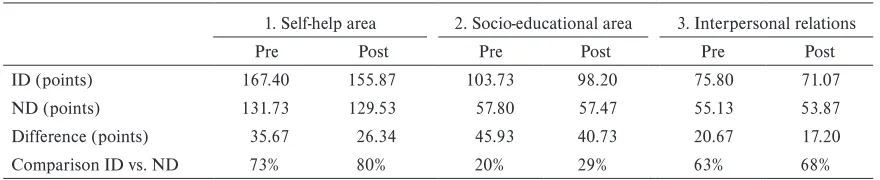
Comparison of social skills in individuals with intellec-tual disabilities and non-disabled population
As noted in the comparison of motor skills, even when comparing social skills we based our work on the pre-sumption of Winnick (2000).
Individuals with intellectual disabilities made 20–73% progress in social skills during the pre-test with an increase in the post-test (29–80%) compared to the non-disabled population.
The areas of social skills have been analysed inde-pendently and they are also available from the author
Table 3 Com
par
ison of t
he a
ver
ag
e t
es
t sc
or
es of indi
vidual t
able t
ennis s
kills
1. H
and dr
ibblin
g
2. Dr
ibblin
g b
y a paddle
3. F
or
ehand
4. Bac
khand
5. Ser
vice
Pre
Po
st
Pre
Po
st
Pre
Po
st
Pre
Po
st
Pre
Po
st
ID (point
s)
35
.93
41
.53
34
.00
41
.43
15
.29
18.36
17
.79
19
.86
3.57
5.14
ND (point
s)
61
.33
70
.33
64
.40
70
.53
22
.80
24
.20
22
.33
24
.33
8.20
9.40
Dif
fer
ence (point
s)
25
.40
28.80
30
.40
29
.10
7.51
5.84
4.54
4.47
4.63
4.26
C
om
par
ison ID v
s. ND
59%
59%
53%
59%
67%
76%
80%
82%
44%
55%
No
te
.
Pr
e = pr
et
es
t, P
os
t = pos
tt
es
t. ID = c
hildr
en w
ith int
ellect
ual disabilit
ie
s, ND = non-disabled popula
tion
Table 4
Test results in social areas in a group of children with intellectual disabilities
1. Self-help area 2. Socio-educational area 3. Interpersonal relations
Pre Post Diff Pre Post Diff Pre Post Diff
M (points) 167.40 155.87 11.53 103.73 98.20 5.53 75.80 71.07 4.73
Mdn (points) 159 151 9 94 93 2 75 69 4
Average deviation (points) 24.03 22.52 6.70 19.18 21.04 5.71 9.52 11.28 3.45
SD (points) 27.83 25.78 7.70 21.03 23.46 8.48 11.73 13.53 4.54
1st interval of the normal distribution (points)
3.83–19.23 0–14.01 0.19–9.27
p .001* .001* .001*
Improvement 7% 6% 7%
Note. Pre = pretest, Post = posttest, Diff = difference between posttest and pretest. * statistically significant at p < .05
Table 5
Processing the results of tests in the area of social indicators within the group of non-disabled population
1. Self-help area 2. Socio-educational area 3. Interpersonal relations
Pre Post Diff Pre Post Diff Pre Post Diff
M (points) 131.73 129.53 2.20 57.80 57.47 0.33 55.13 53.87 1.27
Mdn (points) 133 127 1 56 56 0 52 52 0
Average deviation (points) 16.15 14.57 2.56 4.43 4.22 0.53 8.14 7.31 2.03
SD (points) 19.00 17.96 4.42 5.78 5.75 0.70 9.18 8.54 3.51
1st interval of the normal distribution (points)
0–6.62 0–1.03 0–4.78
p .011* .102 .109
Improvement 2% 1% 2%
Note. Pre = pretest, Post = posttest, Diff = difference between posttest and pretest. * statistically significant at p < .05
Table 6
Comparison of the average test scores of social skills
1. Self-help area 2. Socio-educational area 3. Interpersonal relations
Pre Post Pre Post Pre Post
ID (points) 167.40 155.87 103.73 98.20 75.80 71.07
ND (points) 131.73 129.53 57.80 57.47 55.13 53.87
Difference (points) 35.67 26.34 45.93 40.73 20.67 17.20
Comparison ID vs. ND 73% 80% 20% 29% 63% 68%
of this work. Specifically, the results and improvement of all participants in the research study are presented. Not only individual progress is evident here, but also the differences in both research groups.
Discussion
In the beginning we would like to mention that the comparison of results gained in this research study with results from similar studies is extremely diffi-cult. The reasons that complicate the matter are for instance – focus on adulthood age (Cluphf, Vanina, & O’Connor, 2001; Lahtinen, Rintala, & Malin, 2007; Sherill, 1998), different ages of individuals (Kvapilík, 1995; Wieczorek, 2005), use of different type of tests (Fernahall & Petitti, 2004; Onyewadume, 2006; Pitetti & Yarmer, 2002), different disability (Duronjic & Válková, 2010; Sit, Lindner, & Sherrill, 2002). As men-tioned in the introduction of the research most studies deal with detection of motor skills, such as fitness and coordination skills (Kursová, 2009; Lejčarová, 2006, 2007; Winnick, 2000). The level of physical, sport and social skills is monitored at its minimum; therefore we evaluated gained results with the aim to help to supple-ment the addressed issues.
For the purpose of our study individuals with intel-lectual disabilities and the non-disabled population were approached. Both research groups consisted of children aged 9–11. The study included coaches, teach-ers, teacher assistants and parents of children partici-pating in the training program.
Selection of motor skills’ tests was considerably reduced, because there are no other specialized tests for table tennis skills available. The used tests seemed optimal with regard to organizational, material, spatial, personnel, and safety criteria. Regarding the age group the individual tests were motivating and attractive for participating children. These tests induced interest in findings and subsequent improvement of their skills after completing the training program. During both the training program and the actual measurements, individuality of each participant was respected. Tested individuals were thoroughly acquainted with both measurements.
Identified shortcomings in testing both research groups confirm the importance of the above mentioned problem concerning methodological and diagnostic materials. The evaluation of individual tests’ results within both groups will be addressed in the following comments.
Notes on tests of individual table tennis skills
Based on the above described results conclusions on the physical skills in table tennis may be drawn.
The test results of individual skills demonstrate that the training positively influences the skills monitored in both groups. The results point to the importance of the preparation of athletes, not only with the aim to compete, but for an overall physical activity of an individual.
One of the monitored parameters was the com-parison of the achieved level between the two research groups. Many authors, for instance Černá, Novotný, and Zemková (1982), Tilinger, Urbanová, Lejčarová, Svoboda, and Erlebachová (2002), have dealt with the shortcomings of cognitive processes in individuals with intellectual disabilities causing slower acquisi-tion of new skills, as Karásková (2005) claims. Such an approach is in accord with Winnick (2000) whose assumption about the proportion of the learning pro-cess had already been examined by us. In our study the level of progress that may be expected in children with intellectual disabilities compared to non-disabled children was determined.
In our study the table tennis individual skills are included within the broad category of motor skills (tests 1–2); the tests 3–5 were included to the sub-category – the sports skills. As there are not any available studies on motor skills, the existing knowledge will be used for the purpose of our comparison of motor abilities. The relationship between abilities and skills is double-sided and reciprocal, as Měkota and Cuberek (2007) state; therefore we consider the use of knowledge from the area of motor abilities as understandable. Authors describe motor abilities as one of the prerequisites for the acquisition of motor skills. The final result of physical activity is determined by motor skills and also motor abilities.
Motor skills
The first two tests (hand dribbling and dribbling by a paddle) are included in the general motor skills, because the use of technique and rules of the sport is seen as redundant. Apart from the table, a paddle and a ball nothing else is needed. The transfer of previously learnt (in our case – dribbling with different types of balls, or experience with other types of paddles or rac-quets) may bring about positive effects as characterized by Měkota and Cuberek (2007).
A significant improvement in both tests within the group with intellectual disabilities occurred. Neverthe-less, these results are considered positive and perceived as a significant progress.
of non-disabled individuals confirmed the improve-ment of 15%. We consider this result as a significant progress. The comparable improvement in this test was identified. We can agree with Van Biesen (2010) who also shows comparable progress in learning process among table tennis players with intellectual disabili-ties and without disabilidisabili-ties. The likely reason was the concept of the tests, when the tested individuals had plenty of space for improvement and no limits, which should or may be achieved, as it was the case in all other tests. The already mentioned transfer could have had an effect on improvement.
In test 2 (dribbling by a paddle) the individuals with intellectual disabilities improved by 22%, the improvement among the non-disabled population was 10%. Identically with test 1 we consider the progress among individuals with intellectual disabilities to be significant. The smaller result in the group of the non-disabled population might be explained by high values already achieved in the pre-test, which greatly compli-cated significant progress in this test.
In these tests the group of children with intellectual disabilities reached the level of 59% of the acquired skills of the non-disabled population and hence the statement of Winnick (2000). The results confirm the findings of the authors Lahtinen, Rintala and Malin (2007), who reported a reduced level of the individuals with intellectual disabilities compared to the individu-als without disabilities in the area of manual dexterity which in our case is comparable to the handling of a paddle and a ball. Our comparison complies with the statement of Měkota and Cuberek (2007), who describe the motor component as dominating skill linked to handling tools and materials. Thus leading to a very close connection between motor and working skills.
Sports skills
Sports skills are described by Měkota and Cuberek (2007) as a definition of the motor task with ruleswhen the learning of the relevant skills is a part of mastering sports technique. In our case, this definition complies with tests 3, 4 and 5 (forehand, backhand and service), where we can already discuss exercises with the use of all table tennis equipment (a paddle, balls, nets and a table), techniques and rules.
In test 3 (forehand) individuals with intellectual dis-abilities achieved significant progress of 22%; the non-disabled population reached only moderate progress of 6%. The likely reason for such a progress in individuals with intellectual disabilities is a greater complexity in comparison with the backhand stroke test, which could be the reason for lower values in the pre-test. Chyba, Nepomucký, and Vašek (1985) state that the forehand
stroke requires greater body coordination, which could cause initial difficulties among individuals with intel-lectual disabilities. A regular training program may cre-ate an ample space for improvement. On the contrary, the children from the selected sports clubs representing the non-disabled population already approached the maximum limit of the test during the pre-test; therefore greater progress in the post-test was prevented.
Similar results to the previous test (forehand) were achieved in the test 4 (backhand). Individuals with intellectual disabilities achieved progress of 13%, the non-disabled population improved by 9%. Consistent with the previous test the lower values in the pre-test followed by a broader space for further improvement could be considered as the reason for greater improve-ment occurred among individuals with intellectual disabilities. The backhand stroke is more natural and the coordination is less demanding. Hýbner (1999) states that the backhand is a simple stroke and it is suitable for beginners training. The backhand stroke is perceived as more natural and easier, it is probably the reason for greater success and higher values in the pre-test, but a smaller improvement. As in the previous pre-test, the group of the non-disabled individuals approached the maximum limit in the first test.
reaction time in conjunction with the coordination of the body, hand and eye significantly influences the per-formance of this skill.
Surprisingly, if we take into consideration test 3 and 4 the group of children with intellectual disabilities approached the levels of the non-disabled population. They reached the level of 76% and 82% of the skills acquired by the non-disabled population respectively. We may not confirm the claim of Winnick (2000), who states that the percentage assessment of children with intellectual disabilities in connection to non-disabled children is 40–70%.
We agree with Lejčarová (2007), who underlines that individuals with intellectual disabilities, in the con-text of their disabilities, have enough prerequisites for the development of motor abilities and subsequently also their skills, although these skills demand great coordination. In our case, the progress was so great that it even exceeded the expected improvement.
Notes on testing social indicators
Pursuant to the before illustrated results we may deduce conclusions in each social indicator. Social indicators may be divided into three levels.
The results of individual areas confirm that the training positively influences the monitored skills in both groups. The results also show the influence of the preparation of athletes not only in the physical, but also in the social area.
One of the parameters compares the skills between the two groups. We were dealing with the matter regard-ing the extent of progress in children with intellectual disabilities in comparison to non-disabled children.
Self-help area
In the first area (self-help) the individuals with intellec-tual disabilities reached the progress of 7%. The regular training program leads to repetitive rituals. Each initia-tive that works repeatedly may have a posiinitia-tive impact on the formation of habits of self-help. Our results support the research of Dlużewska-Martyniec (2002) in which she showed that independence through sport activities might be developed. Routine and systematic activities could be one reason for the significant improvement of results in the post-tests compared to the pre-tests, which influenced any significant progress in the area of self-help in the group of children with intellectual disabilities. Our findings confirmed the results of stud-ies conducted by Chadwick, Cuddy, Kusel, and Taylor (2005) who reported a significant progress in everyday skills by individuals with intellectual disabilities.
It should be noted that the range of activities for children with disabilities is significantly lower than for non-disabled children. In the group of non-disabled
individuals only a moderate progress was found. It might have been caused by the effect of the already mentioned higher number of stimuli and values approaching the 100% success in the pre-test.
The group of children with intellectual disabilities significantly approached the level of skills of the non-disabled population. It reached 80% of the acquired skills of the non-disabled population. These results did not confirm the statement of Winnick (2000) who predicted the expected improvement in the range of 40–70% of the level of the non-disabled population.
Socio-educational area
The individuals with intellectual disabilities showed the significant progress of 6%. Our results are in agree-ment with Tilinger (2009) who assessed restricted pub-lic opinion about the abilities and skills of people with intellectual disabilities. Individuals with intellectual disabilities are seen, unfortunately, also by teachers and coaches, as persons with very limited abilities and skills to perform many activities. From the presented results it is evident that individuals with intellectual disabili-ties are, with support and professional guidance, able to achieve progress in various areas, even in those of the highest limitation. We should also emphasize that the aforementioned progress is affected by a number of other factors regarding an individual.
In the group of the non-disabled population we expected greater progress; however, due to the fact that in the first test the individuals approached maximum achievable test score, any higher progress was consider-ably limited.
In this area the group of children with intellectual disabilities varied the most from the non-disabled pop-ulation. Children with intellectual disabilities reached 29% of the acquired skills in the group of the non-dis-abled population which did not confirm the statement from Winnick (2000). He estimated that the improve-ment level would vary between 40–70%. In this area the different characteristics of both research groups came to display in the most significant way.
Area of interpersonal relations
In the third area (interpersonal relations) the individu-als with intellectual disabilities reached the expected progress of 7%. We can positively evaluate the effect of the regular training program for individuals with intel-lectual disabilities. This shows certain analogy to the first area (self-help).
intellectual disabilities. Our findings also confirm the results of studies from Chadwick, Cuddy, Kusel, and Taylor (2005) who report some progress in communi-cation (this was one of the segments of the interper-sonal relations).
The improvement of social feeling and behaviour is confirmed in the work of Finn and Válková (2007). Other studies by Martin and Smith (2002) dealt with the area of relations and friendship in sport among people with disabilities. We agree with results of these authors that sport provides an opportunity for people with disabilities to get in touch with friends, which is an important personal benefit for them.
In the group of individuals from the non-disabled population the results show a statistically insignificant value in this area. As it has already been mentioned, one reason may be a wider offer of leisure time activi-ties, school groups with higher number of and greater opportunity for creating different teams and friendship ties. The second reason from the perspective of current parents and coaches is the tendency to maximize sports performance. The trainings are directed to the develop-ment of fitness, technical and tactical skills. Educa-tional, pedagogical and psychological aspects leading to development of interpersonal relations, involvement in fun games leading to mutual communication and cooperation are absent. From a psychological point of view and in accordance with Svoboda, Krejčířová, and Vágnerová (2009), who mention the necessity of short and simple tasks, a variety of activities and games included in the training process, not only when being occupied with children with intellectual disabilities, should be widely emphasized.
In the monitored area the group of children with intellectual disabilities by reaching 68% of the acquired skills significantly approached the level of skills of the non-disabled population. The statement of Winnick (2000), who estimated the improvement in the range of 40–70% of the non-disabled population, was narrowly confirmed.
Conclusions
In 2003/2004 an investigation (Lukáčová, 2005) of individual differences on table tennis skills in two groups of adolescents with intellectual disabilities involved in the training program and adolescents without physical activity was conducted. The results confirmed the expected progress of adolescents in the training program. The work offered an extensive exami-nation regarding the comparison with the non-disabled individuals and the focus on lower age category.
Stimuli from the previous work was used in our study and extended further by another dimension – to detect the effect of the training program within the physical area and possible changes within social indica-tors. The aim of the work was to specify improvement of the aforesaid skills, to compare the level of skills in both research groups and to draw conclusions. Two age-homogeneous groups of children with and without disabilities were involved in the study. Both groups par-ticipated in the table tennis training program for one school year.
We consider positive changes in the areas of physi-cal and social indicators to be very significant. Indi-viduals with disabilities were able, within their capabili-ties (thanks to their results in the first test), to achieve greater progress in both fields, whereas individuals of the non-disabled population reached much more moderate improvement. The important result is the mutual level of both research groups where the range of 40–70% of the level of individuals with intellectual disabilities was confirmed.
The question for each coach is how to use new knowledge to optimize and increase the efficiency of the training of individuals with intellectual disabilities.
The results will require further research on a larger sample of the population as well as focus on changes caused by a different intervention program. Verified Scale for Assessing Coping Skills requires further advances in the standardization process.
References
Banville, D., Desrosiers, P., & Genet-Volet, Y. (2000). Trans-lating questionnaire and inventories using a cross-cultural translation technique. Journal of Teaching in Physical Educa-tion, 19, 374–378.
Blair, S. (2005). Physical inactivity: The major public health problem of the 21st century. In D. Milanović & F. Prot (Eds.), Proceedings of the 4th International Scientific Sonfer-ence on Kinesilolgy, SciSonfer-ence and Profession – Chllenge for the Future (p. 22). Zagreb: University of Zagreb.
Černá, M., Novotný, J., & Zemková, J. (1982). Kapitoly z psy-chopedie [Chapters from psychopaedia]. Praha: Univerzita Karlova.
Cluphf, D., O’Connor, J., & Vanin, S. (2001). Effects of aero-bic dance on the cardiovascular endurance of adults with intellectual disabilities. Adapted Physical Activity Quarterly,
18, 60–71.
Chadwick, O., Cuddy, M., Kusel, Y., & Taylor, E. (2005). Handicaps and the development of skills between childhood and early adolescence in young people with severe intellec-tual disabilities. Journal of Intellectual Disabilities Research,
49(12), 877–888.
Dlużewska-Martyniec, W. (2002). The need of autonomy in Special Olympics athletes and its satisfying through sports activity. Acta Universitatis Palackianae Olomucensis. Gym-nica, 32(1), 53–60.
Duronjić, M., & Válková, H. (2010). The influence of early intervention movement programs on motor skills develop-ment in preschoolers with autism spectrum disorder (case studies). Acta Universitatis Palackianae Olomucensis. Gym-nica,40(2), 37–45.
Fernhall, B., Pitetti, K. H., Rimmer, J. H., Mccubbin, J. A., Rintala, P., & Millar, A. L. (1996). Cardiorespiratory capac-ity of individuals with mental retardation including Down syndrome. Medicine & Science in Sports & Exercise, 28, 366–371.
Finn, K., & Válková, H. (2007). Motor skills development in preschool children with mental and developmental disor-ders – the difference after a one year comprehensive edu-cation program. Acta Universitatis Palackianae Olomucensis.
Gymnica, 37(4), 91–98.
Hardman, K. (2005). Trends in physical education and soci-ety: Challenges for the physical. In D. Milanović & F. Prot (Eds.), Proceedings of the 4th International Scientific Sonfe-rence on Kinesiolgy, Science and Profession – Challenge for the Future (pp. 9–17). Zagreb: University of Zagreb.
Hýbner, J. (1999). Učební texty pro trenéry stolního tenisu [Text-books for table tennis coaches]. Prague: Czech association of table tennis.
Karásková, V. (2005). Úvod do didaktiky tělesné výchovy žáků s mentálním postižením [An introduction to didactics of physical education of students with learning disabilities]. Olomouc: Palacký University.
Kursová, V. (2009). Rozvoj zdraví a integrace osob s mentálním postižením pomocí cílených pohybových aktivit: Ověřený inter-venční pohybový program [Health development and integra-tion of people with intellectual disabilities through targeted physical activities: Verified motion intervention program]. České Budějovice: University of South Bohemia.
Kvapilík, J. (1995). Životospráva mentálně postižených [Life-style of mentally handicapped]. Prague: Association for helping mentally handicapped in the Czech Republic. Lahtinen, U., Rintala, P., & Malin, A. (2007). Physical
perfor-mance of individuals with intellectual disability: A 30 year follow up. Adapted Physical Activity Quarterly, 24, 125–143. Lejčarová, A. (2006). Motorická výkonnost žáků zvláštních
škol v závislosti na jejich intelektovém postižení [Motor per-formance of pupils in special schools depending on their intellectual disability] (Doctoral dissertation). Charles Uni-versity, Faculty of Physical Education and Sport, Prague. Lejčarová, A. (2007). Úroveň vybraných koordinačních
schopností žáků základních škol praktických v závislosti na etiologii jejich intelektového postižení [The level of coordi-nation abilities of selected primary school pupils practical depending on the etiology of intellectual disability]. Česká kinantropologie, 11(3), 61–71.
Lejčarová, A. (2009). Coordination skills in 9 to 11 years old pupils at practical elementary schools in relationship to their degree of intellectual disability. Acta Universitatis Palackianae Olomucensis. Gymnica, 39(4), 53–61.
Longmuir, P. E., & Bar-Or, O. (2000). Factors influencing the physical activity levels of youths with physical and sensory disabilities. Adapted Physical Activity Quarterly, 17, 40–53. Lukáčová, L. (1998). Nácvik herních činností stolního tenisu u
mentálně postižených [Training game activities of table ten-nis for mentally handicapped] (Diploma thesis). University of Jan Evangelista Purkyně, Faculty of Education, Ústí nad Labem.
Lukáčová, L. (2005). Vliv pravidelné tréninkové činnosti na úro-veň herních dovedností mentálně postižených ve stolním tenisu
[Effect of regular training activities to the level of table tennis skills of mentally handicapped] (Master’s thesis). Palacký University, Faculty of Physical Culture, Olomouc. Martin, J., & Smith, K. (2002). Friendship quality in youth
disability sport: Perceptions of a best friend. Adapted Physi-cal Activity Quarterly,19, 472–482.
Měkota, K., & Cuberek, R. (2007). Pohybové dovednosti– činnosti–výkony [Motor skills–activities–performances]. Olomouc: Palacký University.
Onyewadume, I. U. (2006). Fitness of black African early ado-lescents with and without mild mental retardation. Adapted Physical Activity Quarterly, 23, 277–292.
Pitetti, K. H., & Fernhall, B. (2004). Comparing run perfor-mance of adolescents with mental retardation, with and without Down syndrome. Adapted Physical Activity Quarterly, 21, 219–228.
Pitetti, K. H., & Yarmer, D. (2002). Lower body strength for children and adolescents with and without mild mental retardation: A comparison. Adapted Physical Activity Quar-terly, 19, 68–81.
Robertson, J., Emerson, E., Gregory, N., Hatton, C., Turner, S., Kessissoglou, S., & Hallam, A. (2000). Lifestyle related risk factors for poor health in residential settings for people with intellectual disabilities. Research in Developmental Dis-abilities, 21, 469–486.
Schicklová, D. (2003). Testy individuálních dovedností stolního tenisu v programu Speciálních olympiád [Table tennis tests of individual skills in the Special Olympics] (Diploma thesis). Palacký University, Faculty of Physical Culture, Olomouc. Sherrill, C. (1998). Adapted Physical Activity, recreation and
sport: Crossdisciplinary and lifespan (5th ed.). New York, NY: McGraw-Hill.
Sit, C., Lindner, K., & Sherril, C. (2002). Sport participation of Hong Kong Chinese children with disabilities in special schools. Adapted Physical Activity Quarterly, 19, 453–471. Svoboda, M., Krejčířová, D., & Vágnerová, M. (2009).
Psycho-diagnostika dětí a dospívajících [Psychological assessment of children and adolescents]. Prague: Portal.
Tilinger, P., Urbanová, H., Lejčarová, A., Svoboda, P., & Erle-bachová, A. (2002). Sportovní aktivity osob s mentálním postižením [Sports activity of individuals with intellectual disabilities]. Česká kinantropologie, 6(1), 109–121.
Tilinger, P. (2009). Sport osob s mentálním postižením[Sport of individuals with intellectual disabilities]. Prague: Charles University.
Válková, H. (2007). Male-female residents with mental disabil-ity and their participation in leisure time of physical activi-ties. In Sport and Science, supplement to issue 2. CEEPUS, Adapted of physical activities – European dimensions (pp. 13–17). Sofia: Tip-top press.
Van Biesen, D. (2010). The ability of elite table tennis players with intellectual disabilities to adapt their service/return.
Adapted Physical Activity Quarterly, 27, 242–257.
Whelan, E., & Speake, B. (1979). Scale for assessing coping skills. Manchester: Copewell Publication.
Wieczorek, M. (2005). The asymmetry of body function in mentally disabled and non-disabled 12 years old girls and boys. In F. Vaverka (Ed.), Movement and Health: Abstracts
(p. 125). Olomouc: Univerzita Palackého.